
- Preface
- 1. Introduction
- DEMOGRAPHY
- 2. Mortality and health
- 3. Marriage, divorce, and birth trends
- 4. Migration
- LABOUR MARKET
- 5. Labour market impacts of Covid-19
- 6. Labour market mobility between Nordic countries
- 7. Working from home
- ECONOMY
- 8. The impact of Covid-19 on the Nordic economies: shock and recovery
- 9. Consumption, GHG emissions, car sales, and housing markets
- 10. Covid-19 and tourism: a game-changer?
- 11. Conclusions. Covid-19: From crisis to opportunity for the Nordic Region
- About State of the Nordic Region 2022
MENU
Contents
About State of the Nordic Region 2022
Nordregio Report 2022:2
Published: 23 March 2022
ISBN
ISSN
DOI http://doi.org/10.6027/R2022:2.1403-2503
© Nordregio 2022
The State of the Nordic Region 2022 report has been developed by Nordregio with Gustaf Norlén as the project leader. Gustaf and his colleagues Linda Randall, Nora Sánchez Gassen, and Carlos Tapia coordinated the writing process with authors from Nordregio. Johanna Feuk Westhoff oversaw the communication activities related to the project with assistance from Åsa Ström Hildestrand.
In addition to the editors and authors from Nordregio a reference group consisting of members from Nordregio’s board gave valuable inputs. The reference group consisted of Ulla Agerskov, Hans-Henrik Bull, Gitte Mondrup, Anna Rosenberg, and Katarina Fellman. We also want to thank others at the NCM secretariat, EK-A as well as Kjell Nilsson, Luciane Aguiar Borges, Johannes Lidmo and Lisa Rohrer for valuable comments.
Preface
The Nordic governments have a vision to become the most sustainable and integrated region in the world by 2030.
In order to realise these ambitious goals, we need to focus on the local and regional level of our countries and continuously follow the developments and results of our policy decision and initiatives.
We do this to make sure that we end up at the place we want to be.
State of the Nordic Region 2022 is the 18th edition of the report. The report is a valuable tool to monitor our work and secure that we do not lose sight of our Nordic goals and ambitions.
The work with State of the Nordic Region 2022 started when we were in the midst of the Covid-19 pandemic. This edition differs from previous years’ report as the pandemic and its effects play a central role in all chapters. We still look at demography, labour market, and economy in the Nordic region and beyond – but this time with the effects of the pandemic as the very starting point.
The data, maps, and trends will be fed into the work of The Nordic Council of Ministers and Nordregio in order to achieve our vision of becoming the most sustainable and integrated region in the world in 2030.
As the final touches to this report are being made, our world has once more changed overnight. Two years ago, we entered a new world as the Covid-19 pandemic started, and it has been two challenging years for many people with restrictions and uncertainty. Now, as the pandemic is passing, a new crisis is upon us. The Russian invasion of Ukraine has broken the grounds for European security and underlined the need for basic values such as democracy, rule of law and human rights. The impacts it will have for our region and the world are still uncertain, but we know that there will be long-term effects and that Nordic cooperation is more important than ever.
Rolf Elmér
Director,
Nordregio
Paula Lehtomäki
The Secretary General,
Nordic Council of Ministers
1. Introduction
Author: Linda Randall
Maps and Data: Gustaf Norlén and Linda Randall

Introducing the 18th edition of State of the Nordic Region
State of the Nordic Region 2022 has its point of departure in the Covid-19 pandemic and examines how it has affected demography, labour market and economy in the Nordic countries, regions and municipalities. State of the Nordic Region is published every two years and provides a comprehensive account of regional development trends in the Nordic countries based on the latest statistical data. Charts and maps on different geographical scales are accompanied by expert analysis, providing policymakers and practitioners with a solid evidence base for informed decision making. In writing this edition of State of the Nordic Region, it was, of course, vital to acknowledge the impact of the Covid-19 pandemic. Given the magnitude of this crisis, a conscious decision was taken early in the process to make the pandemic the explicit focus of the publication.
The Covid-19 pandemic has resulted in a wide range of challenges for the Nordic countries. Health systems have come under considerable pressure, school and office closures have put a strain on families, and both internal and international migration has been affected. Labour markets have suffered short-term disruption as well as the potential for long-term transformation, including layoffs in non-essential, high-proximity professions and a large increase in remote working. Economic resilience has been challenged in both the short and long term, particularly in regions reliant on a single dominant industry, for example, tourism.
The pandemic has also called into question many aspects of Nordic co-operation previously taken for granted, in particular, the free flow of people facilitated by the Nordic Passport Union for 65 years.[1]The initial agreement to waive passport checks at internal Nordic borders was made on 12 July 1957 between Sweden, Denmark, Finland and Norway. Iceland joined on 24 September 1965 and the Faroe Islands on 1 January 1961. Greenland and Svalbard are not part of the union. (Norden, 2019) Travel restrictions were felt strongly in cross-border communities, where border closures divided families and friends, created considerable challenges for cross-border commuters and increased nationalist sentiment (Giacometti & Wøien Meijer, 2021). The notable absence of Nordic collaboration in developing policy responses to the pandemic has also raised broader ideological questions about the role of Nordic co-operation in times of crisis (Creutz et al., 2021).
At the same time, the Nordic countries have demonstrated striking resilience in the face of the crisis. All Nordic countries performed in line with or better than the OECD average with respect to excess mortality, total mortality, number of cases and vaccination rates in 2020-2021 (OECD, 2021). The Nordic economies also weathered the storm relatively well overall when considered in a European or global context (IMF, 2021). Companies demonstrated considerable resilience, adapting quickly to new ways of working (Gruß et al., 2021). At the same time, generous support schemes softened the blow to workers and businesses in sectors where adaptation was a less viable option. Perhaps as a result, Nordic citizens were less likely to report having trouble making ends meet during the pandemic than those from most other EU-27 countries (Ahrendt et al., 2021).
The chapters that follow provide a detailed account of the impact of the pandemic on the Nordic Region based on the three main themes that are usually addressed in State of the Nordic Region: Demography, Labour market and Economy. In addition, a final chapter seeks to draw some overall conclusions, charting the road ahead for the Nordic countries and Nordic co-operation as a whole. It is important to acknowledge that, at the time of publication, the pandemic was still ongoing. As such, this report cannot be considered a complete account of the impacts of the pandemic. Instead, it provides an informed analysis of the initial shock and its immediate implications based on the latest available statistical data.
How the pandemic unfolded
The first known Nordic cases of Covid-19 were reported in Northern Finland on 29 January 2020 (Niinimäki, 2020) and in Sweden on 31 January 2020 (Ludvigsson, 2020). Broader community spread became evident approximately one month later and was largely attributed to travellers returning from winter vacations in Northern Italy (Yarmol-Matusiak et al., 2021; Holmager et al., 2020). When the World Health Organisation declared Covid-19 a pandemic on 11 March 2020 (WHO, 2020), 2 586 cases had been recorded in the Nordic Region (912 in Norway; 755 in Denmark; 620 in Sweden; 191 in Finland; 106 in Iceland; 2 in the Faroe Islands; 0 in Greenland; and 0 in Åland; Naqvi, 2021; Statistica, 2022; Worldometer, 2022).
To understand the way that the pandemic unfolded from that point forward, Intensive Care Unit (ICU) admissions is perhaps the most useful indicator. The number of ICU admissions, normalised by population size, is considered a good barometer for comparing the severity of a disease between different countries, provided that there are adequate ICU beds in the countries being compared (Fitzpatrick, 2021). The number of ICU admissions per million inhabitants for all Nordic countries is shown in Figure 1.1, alongside a European average based on the 20 EU countries for which data were available. As can be seen in Figure 1.1, the severity of the pandemic, when considered only in terms of the disease itself, was less pronounced in most Nordic countries than in the EU as a whole. The clear exception here was Sweden, where the experience was closer to, though still for the most part less severe than, the EU average.
Figure 1.1 is also useful in understanding how the severity of the pandemic varied at different times in the different national contexts. It appears that all five countries experienced a first ‘wave’ in a similar way, with a spike in severity in late March/early April and a gradual regaining of control at some point in late April (Iceland), May (Denmark, Finland and Norway) or June (Sweden). Identification of subsequent waves in a consistent way across the countries is somewhat more challenging. Denmark and Sweden experienced a second large spike in admissions towards the end of 2020. This was followed by a downward trend from the end of January 2021 in both countries. While these lower numbers were maintained in Denmark, in Sweden admissions began to rise again in February. Norway and, to a lesser extent, Finland also saw increases in admissions around this time; however, Iceland did not see a second peak in admissions until August 2021. From late October 2021, all countries again experienced increased admissions. In Sweden and, to a lesser extent, Denmark, the number of admissions in the latter part of 2021 reflects a less severe situation compared with earlier points in the pandemic. In Finland, the situation is comparable to earlier peaks, with perhaps the exception of the first wave. In Iceland and, in particular, Norway, the latter part of 2021 appears to be one of the most severe periods of the pandemic in their national contexts to date.
Footnotes
- ^ The initial agreement to waive passport checks at internal Nordic borders was made on 12 July 1957 between Sweden, Denmark, Finland and Norway. Iceland joined on 24 September 1965 and the Faroe Islands on 1 January 1961. Greenland and Svalbard are not part of the union. (Norden, 2019)
Figure 1.1. Admissions to ICU of patients with Covid-19 per million inhabitants.
Data sources: SE: Svenska Intensivvårdsregistret; NO: Helsedirektorated; IS: Landspitali; DK, FI & all other EU countries: Our World in Data.
Note: The EU average includes the EU27 minus seven countries for which data were not available (Croatia, Greece, Hungary, Latvia, Lithuania, Malta and Poland). The remaining 20 countries represent 85% of the EU27 population.
Mapping the number of confirmed cases is another strategy used to compare the severity of the pandemic between countries. Some studies have critiqued this method due to large between-country differences in testing and reporting regimes (Fitzpatrick, 2021). Nonetheless, looking at case numbers can still be interesting, provided that national differences in testing rates are taken into account. Map 1.1 shows the cumulative number of confirmed cases of Covid-19 per 10,000 inhabitants until 31 December 2021 in most European countries. In addition, Figure 1.2 shows the total number of tests per thousand inhabitants for the countries included in the map.

Map 1.1. Confirmed cases of Covid-19 per 10,000 inhabitants.
Figure 1.2. Number of Covid-19 tests per thousand inhabitants as of 31 December 2021.
Note: GL: Number of Covid-19 tests per thousand inhabitants as of 31 January 2022.
Sources: European Centre for Disease Control. Except FO: korona.fo; GL: Naalakkersuisut; UK: gov.uk
In a European context, the Nordic countries again stand out as having a relatively low number of confirmed cases in most regions. Sweden and Denmark are the countries with the highest number of confirmed cases among the Nordic countries. It is possible however that the high case numbers in Denmark can be explained, at least to some extent, by the high levels of testing per capita (see Figure 1.2). The equivalent of 18 tests per person were carried out in Denmark, one of the highest testing rates in Europe. Looking at Europe as a whole, the UK, Spain, Czechia, Croatia and the Baltic States stand out as having experienced the highest number of cases overall. From a regional perspective, higher case numbers can often be observed around the capital regions and other large cities. There are also several cross-border differences that are interesting to note. In Germany, for example, the border with the Netherlands is clearly evident with a much higher number of confirmed cases on the Dutch side of the border. In contrast, the situation in the eastern part of the country more closely resembles that in the Czechia than what was observed in the rest of Germany.
Containment measures
Alongside the impact of the disease itself, the measures put in place to curb the spread of infection have also caused considerable disruption to the Nordic economies and societies. Figures 1.3 and 1.4 display basic timelines showing several of the key measures. It should be noted that the complex and rapidly changing situation makes it challenging to provide detailed, reliable and comparable data on social distancing measures. As such, these figures are not intended as a comprehensive or precise guide to all measures employed throughout the pandemic. Instead, they provide a general overview of the measures which were deployed in the countries at different points in time as context for the other data presented in this report.
Figure 1.3. School closures in the Nordic countries.
Source: European Centre for Disease Control.

Figure 1.4. Restrictions to public life in the Nordic countries.
Source: European Centre for Disease Control.

School and workplace closures were important measures in curbing the spread of infection. As Figure 1.3 shows, school closures or adjusted operations mostly affected older students. Denmark and Norway were the only countries to implement school closures at all levels, including early childhood education. Finland and Iceland implemented closures and adjusted operations in primary, secondary and higher education at different points in time. In Sweden, early childhood education and primary education were not affected; however, secondary and higher education institutions saw quite substantial closures and adjustments to their operations. All Nordic countries also recommended or required distance learning and working from home at various points throughout the pandemic.
Various aspects of public life were also curtailed at different points. As Figure 1.4 demonstrates, the most common strategy in all Nordic countries was to limit the extent of activities rather than to close them down or prohibit them completely. Both private and public gatherings were always possible; however, the number of people allowed to gather was limited to different extents at different points, and social distancing measures were also required. Public places, as well as restaurants and cafes, were closed in the early stages of the pandemic in all countries except Sweden. In Denmark, non-essential shops were also closed during this time, and they, together with public places and restaurants, closed again in late 2020 and early 2021. Even when they were open, public places and restaurants were expected to ensure an appropriate distance between visitors through measures such as limiting guests and rearranging tables and chairs. Restrictions had begun to ease in most countries by September 2021; however, many were reintroduced in December 2021 as the Omicron variant fuelled a rise in Covid-19 cases.
Restricting the movement of people was another important strategy to curb the spread of the disease. Movement restrictions in the Nordic countries were primarily concerned with international travel, though recommendations to avoid travel between regions were also issued at various points in the different countries. International travel restrictions were introduced at different points in time in each country (see Figure 1.5). Finland and Iceland were the quickest to begin monitoring international travel, advising those arriving from mainland China to be alert for symptoms (Finland) and avoid unnecessary social contact (Iceland) in late January 2020. Denmark, the Faroe Islands, Finland, Greenland and Norway all closed their borders around the middle of March, while Iceland and Sweden continued to allow arrivals from some countries.
Figure 1.5. International travel restrictions in the Nordic countries.
Source: Our World in Data.
Perhaps the most important strategy put in place to curb the spread of infection has been the vaccination programme, which is currently ongoing in all Nordic countries. Figure 1.6 shows the proportion of the population who have received two doses of the Covid-19 vaccine for the EU-27 and Iceland, Norway, the Faroe Islands, Greenland and Åland Islands. Among the Nordic countries and independent territories, the Faroe Islands, Iceland and Denmark are the places with the highest vaccination rates. Åland Islands, Finland, Sweden and Norway are not too far behind, followed by Greenland, where just under 70% of the population has had two doses of the Covid-19 vaccine.
Figure 1.6. Vaccination rates as of 1 January 2022 (or closest available date). Includes ‘fully vaccinated’, i.e., two doses, as a proportion of the total population.
Source: Our World in Data, Åland Health & Healthcare.
Methodology
Each chapter of State of the Nordic Region is based on a dialogue between statisticians, researchers, communications experts and the editorial team to provide a publication that is statistically sound, policy-relevant and accessible to a broad audience. The report displays data based on national, regional and local administrative divisions (see Table 1.1). Data sources include the national statistics institutes and other public authorities in the countries, Eurostat and other European agencies (e.g., European Centre for Disease Control) and various OECD databases. For the first time, the publication also uses alternative data sources such as Google Mobility data to understand changes in mobility patterns throughout the pandemic. Data are harmonised to ensure comparability between the countries. For example, in the labour market section, register data is at times combined with results from the Labour Force Survey to ensure comparable data across all countries and territories.
Wherever possible, data covers the whole of the Nordic Region, which consists of Denmark, Finland, Iceland, Norway and Sweden, as well as the Faroe Islands and Greenland (both part of the Kingdom of Denmark) and Åland (part of the Republic of Finland). The maps in the report are based on the administrative structures on 1 January 2021 (see Table 1.1). It is worth noting that several Nordic territories, e.g., Svalbard (Norway), Christiansø (Denmark) and the Northeast Greenland National Park (Kalaallit Nunaata avannaarsuani kangianilu Nuna Allanngutsaaliugaq) are not part of the national administrative systems, and thus are not included in the maps.
| Nomencla|ture level | NUTS O | DK | FI | IS | NO | SE | SNUTS O | FO | GL |
| Regional | NUTS 1 | Manner-Suomi / Fasta Finland; Åland / Ahvenan|maa 2 | Landsdel 3 | SNUTS 1 | |||||
| NUTS 2 | Region 5 | Suuralue; Storom|råde 5 | Landsdel 5 | Riks-område 8 | SNUTS 2 | ||||
| NUTS 3 | Landsdel 11 | Maakun|ta; Landskap 19 | Hagskýrs|lusvæði 2 | Fylke 11 | Region/Län 21 | SNUTS 3 | |||
| Local | LAU 1 | Kommune 98 | Landsvædi 8 | Økonomisk region 85 | SNUTS 4 | Sýsla 6 | |||
| LAU 2 | Sogn 2141 | Kunta; Kommun 309 | Sveitar-félög 69 | Kommune 356 | Kommun 290 | SNUTS 5 | Kommuna 29 | Kommunia 5 |
Table 1.1. Administrative structures in the Nordic Region on 1 January 2021.
Notes: 16 of Finland's 309 municipalities and 1 of the 19 Maakunta/Landskap make up the Åland Islands.
Light green frames represent the regional levels presented in most regional maps in this report, comparable from a Nordic perspective, while dark green frames show the local units represented in the majority of our municipal level maps.
Highlights from the chapters
The remainder of this publication will explore the implications of the pandemic and the subsequent containment measures for the Nordic countries, regions and municipalities.
References
Ahrendt, D., Mascherini, M., Nivakoski, S., & Sándor, E. (2021). Living, working and COVID-19 (Update April 2021): Mental health and trust decline across EU as pandemic enters another year. 21.
Creutz, K., Berglund, S., Betül Karacan, T., Giacometti, A., Haugevik, K., Nyberg Sørensen, N., Wøien Meijer, M., & Lares, A. (2021). Nordic Cooperation amid Pandemic Travel Restrictions | FIIA. FIIA – Finnish Institute of International Affairs. https://www.fiia.fi/en/publication/nordic-cooperation-amid-pandemic-travel-restrictions
Fitzpatrick, P. (2021). The challenges of international comparisons of COVID-19. Irish Journal of Medical Science (1971 -), 190(2), 483–484. https://doi.org/10.1007/s11845-020-02370-9
Giacometti, A., & Wøien Meijer, M. (2021). Closed borders and divided communities: Status report and lessons from Covid-19 in cross-border areas. http://doi.org/10.6027/R2021:6.1403-2503
Gruß, C., Carlsen, T., Malby, A., & Galper, D. (2021). Winning in the Pandemic. Lessons from the Nordics. Nordics - EN. https://www.bcg.com/en-nor/publications/2021/nordic-companies-pandemic-transformation
Holmager, T. L., Lynge, E., Kann, C. E., & St-Martin, G. (2020). Geography of COVID-19 in Denmark. Scandinavian Journal of Public Health, 1403494820975607. https://doi.org/10.1177/1403494820975607
IMF. 2021. World Economic Outlook 2021/10: Recovery During a Pandemic. Health Concerns, Supply Disruptions, and Price Pressures. Washington, DC: International Monetary Fund, Publication Services. https://www.imf.org/en/Publications/WEO/Issues/2021/10/12/world-economic-outlook-october-2021
Ludvigsson, J. F. (2020). The first eight months of Sweden’s COVID-19 strategy and the key actions and actors that were involved. Acta Paediatrica, 109(12), 2459–2471. https://doi.org/10.1111/apa.15582
Niinimäki. (2020, December 18). Topic: Coronavirus (COVID-19) in Finland. Statista. https://www.statista.com/topics/6666/coronavirus-covid-19-in-finland/
Naqvi, A. (2021). COVID-19 European regional tracker. Scientific Data, 8(1), 181. https://doi.org/10.1038/s41597-021-00950-7
Norden. (2019). Den nordiska passkontrollöverenskommelsen | Nordic cooperation. https://www.norden.org/en/node/36797
OECD. (2021). Health at a Glance 2021: OECD Indicators. Organisation for Economic Co-operation and Development. https://www.oecd-ilibrary.org/social-issues-migration-health/health-at-a-glance-2021_ae3016b9-en
Statistica. (2022). Norway: Coronavirus cases 2022. Statista. https://www.statista.com/statistics/1102249/cumulative-coronavirus-cases-in-norway/
WHO. (2020). WHO Director-General’s opening remarks at the media briefing on COVID-19—11 March 2020. https://www.who.int/director-general/speeches/detail/who-director-general-s-opening-remarks-at-the-media-briefing-on-covid-19---11-march-2020
Worldometer. (2022). Greenland COVID - Coronavirus Statistics—Worldometer. https://www.worldometers.info/coronavirus/country/greenland/
Yarmol-Matusiak, E. A., Cipriano, L. E., & Stranges, S. (2021). A comparison of COVID-19 epidemiological indicators in Sweden, Norway, Denmark, and Finland. Scandinavian Journal of Public Health, 49(1), 69–78. https://doi.org/10.1177/1403494820980264

DEMOGRAPHY
How has the Nordic Region changed during the pandemic? Do we live for as long as we used to? How have closed borders affected migration patterns? The Demography section takes us through mortality and health, marriage, divorce, birth, and migration in the Nordic Region based on the most recent available data.
2. Mortality and health
Authors: Timothy Heleniak
Maps and data: Timothy Heleniak, Gustaf Norlén and Anna Vasilevskaya

Among OECD countries, prior to the Covid–19 pandemic, the five Nordic countries ranked at or above average on four key health status indicators – life expectancy, avoidable mortality, chronic disease morbidity and self-rated health (OECD, 2019). However, a high proportion of their populations was also elderly and would prove more susceptible to severe illness or death from Covid–19, and large numbers of them lived in nursing homes. This chapter examines trends in mortality and life expectancy since the start of the Covid–19 pandemic in early 2020 by country, region and over time.
Mortality
Covid–19 deaths
Much of fixation during the pandemic has been on Covid–19 deaths, over time and by country, with charts of Covid–19 deaths rapidly becoming permanent fixtures in newspapers. That is why analysis of all-cause mortality in the next section, coupled with data on deaths from Covid–19, provides a fuller picture of the overall impact of the pandemic on mortality. Daily data on confirmed new Covid–19 deaths for the Nordic countries is shown in Figure 2.1. Two distinct periods of high Covid–19 mortality can be observed. The first is from March to June 2020, and the second is during the winter of 2020–2021. Whereas in the other countries, Covid–19 deaths were fewer than three a day by 1 March 2021, in Sweden, the figure remained at around twenty deaths a day until the beginning of June. During the second wave, mortality from Covid–19 lasted longer in Sweden than in the other Nordic countries. Data show a rising trend of Covid–19 deaths in November-December 2021 and January-February 2022.
Figure 2.1. Daily Covid-19 deaths per million inhabitants, 1 March 2020 to 31 January 2022.
Source: Our World in Data, 2022. How Covid–19 deaths are recorded varies between countries.
Note: Deaths are a seven-day average of the daily figures reported on that day. Data for the Faroe Islands, Greenland and Åland are not included. Data from Finland include Åland.
The cumulative number of Covid–19 deaths differs by country, despite differences in population size. At the end of January 2022, Sweden reached 15,900 deaths attributable to Covid–19; Denmark had 3,800, followed by Finland, 2,000, Norway, 1,400, and Iceland 46. There have been significant differences in the impact of Covid–19 deaths on overall mortality. In 2020, in Finland, Iceland, and Norway, Covid–19 deaths accounted for just 1% of all deaths. In Denmark, they accounted for 2% and in Sweden 9%.
Excess mortality at the national level
Excess mortality is a measure used in public health, epidemiology, and demography to measure the difference in the number of deaths from an event or crisis from the number of deaths that would have occurred under ‘normal’ circumstances (Giattino, Ritchie, Roser, Ortiz-Ospina, & Hasell, 2021). Of interest is the number of deaths during the Covid–19 pandemic compared to the number of deaths had the pandemic not occurred. Excess mortality is a more comprehensive indicator in that it measures not just deaths directly attributable to Covid–19 but deaths from all causes. During the pandemic, in addition to deaths from Covid–19, deaths from some causes may have increased, in part, because of overcrowded hospitals, deferred treatment of other conditions, unhealthy behaviour such as excess drinking or less exercise. Deaths from other causes could also have decreased, such as lower rates of influenza and other infectious diseases due to social distancing, hygiene measures such as wearing face masks and hand washing and fewer traffic deaths due to restrictions on movement. The net effect of the pandemic on mortality is the balance between more deaths attributable to the pandemic and fewer deaths from other causes (Modig, Ahlbom, & Ebeling, 2020).
Excess mortality could be negative (termed a mortality deficit) if the number of deaths is fewer than expected. One measure of excess mortality is to compare the number of deaths in 2020 to the average for the preceding five years, 2015 to 2019 (Table 2.1). Overall, in the Nordic Region, there were 4% more deaths in 2020 than the average for 2015 to 2019. Sweden (8%) and Åland (7%) had the highest number of excess deaths. It is important to note that no Covid-19 deaths were recorded in Åland in 2020 so this excess mortality cannot be attributed directly to the pandemic.Greenland, Finland, Iceland and Denmark had small amounts of excess deaths, ranging 2–4%. Norway had no excess deaths. The Faroe Islands had a mortality deficit of 9%.
Excess mortality can be estimated for 2021 based on preliminary data, though it should be noted that this data may be subject to revision. In 2020, for the entire Nordic Region, there were nearly 10,000 more deaths than the average for 2015 to 2019. This was driven largely by the large number of excess deaths in Sweden and its population weight. In 2021, estimated excess mortality fell to only 2% as there was no excess mortality in Sweden but increases in some other countries. Of the five Nordic countries, Iceland, Norway, and Finland maintained similarly moderate excess mortality as in 2020 (using deaths in 2015 to 2019 as the base). Sweden went from having the highest excess mortality among Nordic countries and regions in 2020 to having no excess mortality in 2021. Denmark went from having excess mortality of just 2% in 2020 to 7% in 2021. For the three autonomous regions, it’s difficult to discern a trend given the small numbers.
| Annual average number of deaths, 2015-2019 | Deaths, 2020 | Deaths in 2020 compared to 2015-2019 average (percent) | Deaths, 2021 | Deaths in 2021 compared to 2015-2019 average (percent) | |
| Denmark | 53,566 | 54,645 | 2 | 57,142 | 7 |
| Finland* | 53,723 | 55,488 | 3 | 56,035 | 2 |
| Iceland | 2,251 | 2,301 | 2 | 2,325 | 3 |
| Norway | 40,750 | 40,611 | 0 | 41,693 | 1 |
| Sweden | 90,962 | 98,124 | 8 | 88,906 | 0 |
| Faroe Islands | 401 | 365 | -9 | 407 | 1 |
| Greenland | 499 | 520 | 4 | 525 | 5 |
| Åland | 271 | 291 | 7 | 261 | -5 |
| Total | 242,152 | 252,054 | 4 | 247,033 | 2 |
Table 2.1. Excess deaths in the Nordic Region in 2020 and 2021.
Sources: NSIs of the Nordic countries.
* Data from Finland includes Åland.
Excess mortality over time
In response to increased interest in mortality levels brought on by the pandemic, many national and international statistical and public health agencies started publishing mortality data much sooner and in greater detail than usual. Some of the Nordic statistical offices set up websites dedicated to mortality statistics and Covid–19 information (Statistics Iceland, 2021; Statistics Denmark, 2021; Statistics Finland, 2021; Statistics Sweden, 2021).
With high-frequency mortality data, the impact of the pandemic during the different waves can be tracked quite closely. Sweden and Denmark provide data on deaths by day, Iceland, Norway, Finland, and Åland by week, and the Faroe Islands and Greenland by month (Figure 2.2). The data refers to all-cause mortality and not just specifically Covid–19 deaths.
Figure 2.2. Relative change in the number of deaths by week in 2020 and 2021 compared to the average of the same week in 2015-2019.
Sources: Iceland (Statistics Iceland, 2021), only data from 2017-2019. Greenland (Statistics Greenland, 2021). Faroe Islands (Statistics Faroe Islands, 2021). Norway (Statistics Norway, 2021). Sweden, 2021 (Statistics Sweden, 2021). Finland (Statistics Finland, 2021). Åland (Statistics Finland, 2021). Denmark (Statistics Denmark, 2021).
Note: Data from Iceland is a three-week average compared to the same three-week average in the years 2017-2019.
Iceland had excess mortality of only 2% in 2020 and no discernible uptick of deaths in spring 2020 or at any other period during the pandemic. Greenland had excess mortality of 4% in 2020 and a mortality deficit in the spring of 2020. The Faroe Islands had a mortality deficit of 9% in 2020 and no discernible monthly trend. Norway had no excess mortality in 2020. There were weeks of a mortality deficit early in 2020, followed by excess mortality in weeks 13 to 16, early in the pandemic. However, the overall trend followed the usual pattern of higher mortality in the colder months and lower mortality in the summer. Finland had excess mortality of 3% in 2020. There was very slight excess mortality from weeks 12 to 20 in 2020, but generally, the weekly pattern did not deviate much from the previous five years. Overall, in 2020, Denmark had excess mortality of 2%. There was a slight mortality deficit (fewer deaths than expected) in February, followed by slight excess mortality in March and April and again in December, though in general, the pattern of mortality followed that of previous years.
Sweden stands out among the Nordic countries in having the highest excess mortality at 8% in 2020. There were 6,361 more deaths in 2020 than the average for the previous five years.[1]The deaths by day are considered preliminary and differ from annual totals presented later. The daily data show excess mortality of 6,361 in 2020, while the annual data show excess mortality of 7,162. Several distinct periods of excess mortality in Sweden can be identified based on the different waves of the pandemic. From the beginning of the year until 19 March, there was a mortality deficit nearly every day. In this period, there was a mortality deficit of 1,442 deaths. From 20 March until the end of June, there was excess mortality nearly every day, and for some days during this early period, rather significant excesses. This was one of the longest durations of excess mortality in Europe during the first wave, when excess mortality in Sweden was 5,568 (Kontis, o.a., 2020). From 1 July until 10 November, there was overall a mortality deficit of 590. During the second wave of the pandemic in winter 2020–2021, mortality increased again. Starting on 11 November and lasting until the end of January 2021, excess mortality was recorded every day, resulting in a total of 4,124. Between February and the middle of May 2021, there was a mortality deficit of 1,587. During the period March 2020 to February 2021, there were 12.4% more deaths in Sweden than in the corresponding 12-month period prior to the pandemic (Andersson, Drefahl, Mussino, Modig, & Meyer, 2021).
Similar to public health officials making decisions with incomplete information, much of the early research analysis and media coverage of the factors explaining the paths of the pandemic and differential impacts was based on fragmentary information, not just in the Nordics but globally. This was true of much of the commentary on the virus in Sweden and the other Nordic countries in 2020. For much of the early period of the pandemic, Sweden was held up by journalists, public health officials and politicians as an example by both those advocating more stringent lockdown measures and those advocating less stringent measures. In 2021, as more data became available about the spread of the pandemic, assessments of the situation in Sweden and other Nordic countries became considerably more nuanced. One hypothesis that has been put forward to explain the high mortality in Sweden during the first wave is that the mild winter of 2019–2020 meant many more elderly people survived the winter than normal (Rizzi, Søgaard, & Vaupel, 2021). This means that when the pandemic hit in March 2020, there were many vulnerable elderly people who were particularly susceptible to Covid–19. Evidence of this can be seen in the large mortality deficit from the start of the year until mid-March 2020.
A second related hypothesis explaining the higher excess mortality in Sweden considers differences between Sweden and other countries in the way that elderly care is organised, coupled with less successful strategies to protect the elderly (Rizzi, Søgaard, & Vaupel, 2021). Sweden has a policy of trying to allow people to live in their homes for as long as possible and to provide services to allow them to do so (Modig, Lambe, Ahlbom, & Ebeling, 2021). Once people do move to a care home, they are often quite frail and thus would be more susceptible to infectious diseases such as Covid–19. In one study, those aged 70 and older were divided into three groups – those in care homes, at home receiving care, and those living independently (Modig, Ahlbom, & Ebeling, 2020). The excess mortality in Sweden during the first wave was primarily confined to the first two groups. In fact, the age-standardised excess all-cause mortality in the first half of 2020 was 3% higher for those 65 and older, while it was 3% lower for those 64 and younger (Diderichsen, 2021). In Norway, Denmark, and Finland, there was a mortality deficit for both age groups during this period. Thus, the difference in excess mortality between Sweden and these other Nordic countries during the first wave can be explained almost entirely by excess mortality among elderly people. The privatisation of many welfare services in the 1990s in Sweden offers a partial explanation for the high mortality in nursing homes during the first wave (Diderichsen, 2021). For-profit elderly homes may have led to lower levels of care. However, the debate around Sweden’s excess mortality continues and more research is needed regarding the effectiveness of different mitigation measures.
Excess mortality at the regional level
The rankings for regions by excess mortality in 2020 are shown in Figure 2.3. Excess mortality is calculated in the same way as in Table 2.1 at the national level. The national patterns drive much of the patterns seen at the regional and municipal levels. Most of the regions with excess mortality of 10% or more were in Sweden. With the exception of one small region in Finland, the region with the highest excess mortality in 2020 was Region Stockholm. Regions in Sweden account for most of those with excess deaths, above the Nordic average of 4%. Only a few regions in Sweden such as Region Västerbotten and Värmland had a mortality deficit. The Faroe Islands, with its large mortality deficit in 2020, is at the bottom of the figure.
The biological factors which lead individuals to have more severe symptoms or higher mortality from Covid–19 are well-known. There are also numerous socio-economic and geographic characteristics of individuals, households, and regions that are less well understood in explaining the diffusion and differential impacts of the virus. One early study of the geography of Covid–19 in Sweden showed that factors associated with diffusion mattered more than place-based factors like density, population size, income, and other socio-economic characteristics of places (Florida & Mellander, 2021). The presence of high-risk nursing homes explained much of the geographic variation of mortality during the first wave in Sweden. At the neighbourhood level, there was an association between high numbers of cases and lower incomes, low levels of education, more frontline workers, overcrowded housing, and higher shares of immigrants (Sigurjónsdóttir, Sigvardsson, & Oliveira e Costa, 2021).
Footnotes
- ^ The deaths by day are considered preliminary and differ from annual totals presented later. The daily data show excess mortality of 6,361 in 2020, while the annual data show excess mortality of 7,162.
Comparison of 2020 to previous years

Figure 2.3. All-cause mortality in Nordic regions in 2020.
Source: NSIs.
Note: Bars show two standard deviations around the 2015-2019 mean.
Municipalities in various shades of blue (Figure 2.4) had lower mortality in 2020 than the 2015–2019 average, while municipalities in pink and shades of red had higher mortality. Those in beige are where mortality was mostly unchanged in 2020. In Sweden, many municipalities in the south had excess mortality. Noticeable is a ring of municipalities surrounding Stockholm with excess mortality. During the first two months of the pandemic, March-May 2020, there were 2,110 excess deaths in the Stockholm Region (Calderón-Larrañaga, o.a., 2020). Many of these occurred in distant suburbs with high shares of socioeconomically deprived populations (Sigurjónsdóttir, Sigvardsson, & Oliveira e Costa, 2021). There was a disproportionate impact of Covid–19 in Stockholm (Kolk, Drefahl, Wallace, & Andersson, 2021). Denmark had a mix of municipalities with slight excess mortality, slight mortality deficits, or little change, consistent with having very moderate excess mortality overall. Finland showed a similar pattern, with some municipalities recording excess mortality and others mortality deficits. Consistent with having no excess mortality at the national level, Norway had many municipalities with moderate or significant mortality deficits and only a few areas with high amounts of excess mortality. In Iceland, with the exception of the Reykjanes Peninsula, there were no large differences in excess mortality throughout the country.

Map 2.1. Excess mortality by region.
Life expectancy
The excess mortality described above has affected overall life expectancy at birth across Europe. In 2019, prior to the start of the pandemic, Spain, Switzerland, and Italy had the highest life expectancy in Europe, followed closely by Sweden, Iceland, France, and Norway. Finland and Denmark had slightly lower levels but were still at or above the EU average (Eurostat, 2021). Life expectancy across the EU as a whole and in nearly all other countries has been steadily increasing for decades. Declines in life expectancy are rare, but that is indeed what happened in many countries in Europe during the pandemic in 2020. One study of upper-middle and high-income countries showed that life expectancy declined in 31 of 37 countries in 2020 (Islam, et al., 2021). The only countries of those included in the study where life expectancy did not decline were New Zealand, Taiwan, Iceland, South Korea, Denmark, Finland, and Norway. The largest falls were in Russia and the United States.
The high excess mortality in Sweden in 2020 has had an impact on life expectancy. In Iceland, Norway, Finland, Denmark and the Faroe Islands, life expectancy went up for both sexes in 2020. In Sweden, life expectancy fell by 0.7 years for males from 81.3 years to 80.6 and for females by 0.4 years from 84.7 to 84.3 years (Statistics Sweden, 2021). The steeper decline in life expectancy for males is consistent with the larger number of excess deaths among males (Kolk, Drefahl, Wallace, & Andersson, 2021).
Thus, compared to other Nordic countries, the adverse mortality impact of the pandemic has been greater in Sweden. However, when comparing Sweden to the rest of Europe, it is the Nordic countries, other than Sweden, which are exceptional (Eurostat, 2021). The trend among countries in Europe is a fall in life expectancy in 2020. The largest declines were in countries in Southern and Eastern Europe. Italy and Spain were among the countries with the highest excess mortality during the first wave. The only countries in which life expectancy increased in 2020 were Iceland, Denmark, Finland and Norway. Sweden falls in the middle of the European ranking in terms of the size of the decline in life expectancy. In nearly all countries, the fall in life expectancy was greater for males than females.

Map 2.2. Change in life expectancy by country in Europe, 2019–2020.
Conclusions
This chapter examined three aspects of mortality to assess the impact of the Covid-19 pandemic in the Nordic countries – deaths directly attributable to Covid-19, excess mortality, and change in life expectancy. Sweden, and to a lesser extent, Denmark had high rates of Covid-19 deaths during periods of the pandemic. In the other Nordic countries, the impact of Covid-19 mortality on overall mortality was minimal. For most of the pandemic, per capita Covid-19 mortality in the Nordic countries has been less than the EU average, except for Sweden during the spring of 2020 and winter 2020-2021. The Nordic Region registered excess mortality in 2020, the first year of the pandemic. This excess was most pronounced in Sweden. Excess mortality decreased in 2021, largely due to the absence of any excess mortality in Sweden. The excess was marginal in Finland, Iceland and Norway in both years but increased in Denmark in 2021. Regarding life expectancy, Sweden seems to be the outlier among the Nordic countries with a decline in life expectancy in 2020, while Iceland, Norway, Finland, and Denmark are outliers among the European countries in having increases in life expectancy. More recent data are needed to fully access the impacts of the pandemic on health and mortality in the Nordic countries and territories.
The pandemic is far from over. It is too early to tell which Nordic and other countries had the best long-term strategies to prevent high levels of mortality and illness. Some of the impacts such as mortality from Covid were felt immediately, while others such as long-Covid, other health impacts, and psychological or economic impacts on health may take longer to be felt. As noted at the beginning of the chapter, the populations in the Nordic countries had good health indicators prior to the start of the pandemic, which contributed to less severe impacts than other European countries. Nordic welfare policies certainly contributed to having healthier populations. Several assessments are underway but further studies with more data are needed to determine the effects of different mitigation strategies in the Nordic countries on overall wellbeing during the pandemic and beyond.
References
Andersson, G., Drefahl, S., Mussino, E., Modig, K., & Meyer, A. C. (2021). Patterns in COVID–19 Mortality and Morbidity in Sweden during the Pandemic Year March 2020—February 2021. Stockholm University Demography Unit. Stockholm: Stockholm Research Reports in Demography. Retrieved from https://su.figshare.com/articles/preprint/Patterns_in_COVID–19_Mortality_and_Morbidity_in_Sweden_during_the_Pandemic_Year_March_2020-February_2021/16953607
Calderón-Larrañaga, A., Vetrano, D. L., Rizzuto, D., Bellander, T., Fratiglioni, L., & Dekhtyar, S. (2020, October 27). High excess mortality in areas with young and socially vulnerable populations during the COVID–19 outbreak in Stockholm Region, Sweden. BMJ Global Health. doi:http://dx.doi.org/10.1136/bmjgh-2020-003595
Diderichsen, F. (2021, February 26). How did Sweden Fail the Pandemic? International Journal of Health Services, 1-6. doi:DOI: 10.1177/0020731421994848
Eurostat. (2021, September 30). EUROPEAN UNION LABOUR FORCE SURVEY (EU LFS). Retrieved from Eurostat: https://ec.europa.eu/eurostatmicrodata/european-union-labour-force-survey
Florida, R., & Mellander, C. (2021, July 23). The geography of COVID–19 in Sweden. The Annals of Regional Science. Retrieved from https://doi.org/10.1007/s00168-021-01071-0
Giattino, C., Ritchie, H., Roser, M., Ortiz-Ospina, E., & Hasell, J. (2021, October 25). Excess mortality during the Coronavirus pandemic (COVID–19). Retrieved from Our World in Data: https://ourworldindata.org/excess-mortality-covid
Islam, N., Jdanov, D., Shkolnikov, V., Khunti, K., Kawachi, I., White, M., . . . Lacey, B. (2021, October 6). Effects of Covid–19 pandemic on life expectancy and premature mortality in 2020: time series analysis in 37 countries. BMJ. doi:10.1136/bmj-2021-066768
Kolk, M., Drefahl, S., Wallace, M., & Andersson, G. (2021). Kolk, M., Drefahl, S., Wallace, M., & Andersson, G. (2021). Excess mortality and COVID–19 in Sweden in 2020: A demographic account. Stockholm Research Reports in Demography. Retrieved from https://su.figshare.com/articles/preprint/Excess_mortality_and_COVID–19_in_Sweden_in_2020_A_demographic_account/14679789
Kontis, V., Bennett, J. E., Rashid, T., Parks, R. M., Pearson-Stuttard, J., Guillot, M., & Ezzati , M. (2020, December). Magnitude, demographics and dynamics of the effect of the first wave of the COVID–19 pandemic on all-cause mortality in 21 industrialized countries. Nature Medicine, 1919-1928. Retrieved from https://www.nature.com/articles/s41591-020-1112-0
Modig, K., Ahlbom, A., & Ebeling, M. (2020). Excess mortality from COVID–19: weekly excess death rates by age and sex for Sweden and its most affected region. The European Journal of Public Health, 31(1), 17-22. doi:https://doi.org/10.1016/j.lanepe.2021.100072
Modig, K., Lambe, M., Ahlbom, A., & Ebeling, M. (2021, March 17). Excess mortality for men and women above age 70 according to level of care during the first wave of COVID–19 pandemic in Sweden: A population-based study. The Lancet Regional Health - Europe. doi:https://doi.org/10.1016/j.lanepe.2021.100072
OECD . (2020). What is the impact of the COVID–19 pandemic on immigrants and their children? OECD Policy Responses to Coronavirus (COVID–19). Paris: OECD.
OECD. (2019). Health at a Glance 2019: OECD Indicators. Paris: OECD. Retrieved from https://doi.org/10.1787/4dd50c09-en
Our World in Data. (2022, February 1). Coronavirus Pandemic (COVID–19). Retrieved from Our World in Data: https://ourworldindata.org/coronavirus
Rizzi, S., Søgaard, J., & Vaupel, J. W. (2021). High excess deaths in Sweden during the first wave of COVID–19: Policy deficiencies or ‘dry tinder’? Scandinavian Journal of Public Health. doi:https://doi.org/10.1177/14034948211027818
Sigurjónsdóttir, H. R., Sigvardsson, D., & Oliveira e Costa, S. (2021). Who is left behind? The impact of place on the possibility to follow Covid–19 restrictions. Nord. doi:http://dx.doi.org/10.6027/nord2021-032
Statistics Denmark. (2021, October 27). Statistics Denmark. Retrieved from Covid–19 – fast indicators: https://www.dst.dk/en/statistik/Covid–19-hurtige-indikatorer
Statistics Faroe Islands. (2021, October 27). Statbank. Retrieved from Statistics Faroe Islands: https://statbank.hagstova.fo/pxweb/en/H2/
Statistics Finland. (2021, November 25). Deaths by week according to sex, age and region (Rapid estimate). Retrieved from Statistics Finland: https://www.stat.fi/uutinen/statistics-finland-will-release-exceptional-rapid-estimate-statistics-on-the-number-of-deaths
Statistics Greenland. (2021, October 27). StatBank. Retrieved from Statistics Greenland: https://bank.stat.gl/pxweb/en/Greenland/
Statistics Iceland. (2021, September 3). Experimental statistics - Deaths. Retrieved from Statistics Iceland: Statistics Iceland. (2021, September 3). Statistics Iceland. Retrieved from Experimental statistics - Deaths: https://www.statice.is/publications/experimental-statistics/deaths-ex/
Statistics Norway. (2021, October 27). StatBank Norway. Retrieved from Statistics Norway: https://www.ssb.no/en/statbank/
Statistics Sweden. (2021, November 25). Statistical database. Retrieved from Statistics Sweden: http://www.statistikdatabasen.scb.se/pxweb/en/ssd/
3. Marriage, divorce, and birth trends
Authors: Nora Sánchez Gassen, Johanna Carolina Jokinen and Alex Cuadrado
Data and maps: Johanna Carolina Jokinen and Nora Sánchez Gassen

Throughout the Covid-19 pandemic, researchers and policy makers have predominantly focused on understanding and mitigating the impacts of the new virus on health and mortality. This is understandable, given that death rates soared during the first waves of the pandemic. Nonetheless, there is a growing recognition that the pandemic and mitigation measures also had a profound effect on the wellbeing of couples and families. Fear of infection, social distancing requirements, teleworking and other measures made it difficult to meet people, start new romantic relationships and marry. Mitigation measures have also influenced existing relationships and fertility choices (Aassve, Cavalli, Mencarini, Plach & Livi Bacci, 2020).
This chapter explores family formation, dissolution, and fertility trends in the Nordic Region during the pandemic, with occasional comparisons of the Nordic experience with the rest of Europe. As changes in fertility have implications for population dynamics, the chapter will also examine how fertility changes have affected natural population change. It concludes that the Nordic Region stands out in a European context with increasing numbers of births and natural population growth even during the pandemic.
A bad time for romance? Dating and marriage during the pandemic
When the Covid-19 pandemic reached the Nordic Region in early 2020, all of the Nordic governments adopted measures to curb the spread of the virus. Denmark, Finland, Norway, and Iceland adopted more restrictive measures, such as closing schools and universities, restricting cultural events and sporting activities, limiting the opening hours of bars and restaurants, and issuing recommendations for social distancing and teleworking. Sweden adopted a somewhat less restrictive approach, relying at least initially mostly on less restrictive recommendations. Nonetheless, also in Sweden, social distancing and teleworking were recommended, with people spending more time at home, both to work remotely and during leisure time (Hansen, Sørensen & Anderssen, 2021).
The pandemic and the different protective measures abruptly and profoundly limited opportunities for human contact. They also influenced people’s opportunities to date and develop romantic relationships (Stettersten et al., 2020). Many places where people usually meet such as schools, universities, workplaces, bars, and restaurants were closed or subject to social distancing requirements. Private parties and other social gatherings were also often put on hold. People therefore increasingly turned to dating apps to connect with others. According to a year-end report from the dating app Tinder, 2020 was the busiest year in its history (Tinder, 2021). People spent more time on Tinder, sent more and longer text messages and used video chats more frequently (Wiederhold, 2021). Emerging research suggests that the use of dating apps has helped to reduce feelings of loneliness, especially among young people and singles. Nonetheless, some groups also became frustrated with the difficulty of forging intimate connections via these tools (Portolan & McAlister, 2021).
While research on relationship formation during the pandemic is only just emerging, existing statistics already show a clear effect of the pandemic on marriage. Figure 3.1 (left panels) shows the monthly number of marriages in the Nordic countries, Greenland and Åland, and compares the years 2019, 2020 and 2021.[1]For Iceland and the Faroe Islands, marriage and divorce numbers by month are not available. Annual statistics from the NSIs for 2019 and 2020 show that the total number of marriages declined in both cases. The number of divorces declined in Iceland but remained stable on the Faroe Islands. Marriage and divorce numbers by month for 2021 were also not yet available from Norway at the time of writing.
In 2019, the number of weddings peaked during the summer months and was at a low level during the winter across the Nordic Region. In 2020 and 2021, marriage trends followed a similar pattern, with most weddings occurring in July and August. Nonetheless, in total, fewer couples tied the knot after the start of the pandemic. Falls in marriage numbers were greater in some countries (e.g., Sweden and Norway) than in others (e.g., Finland and Greenland). One potential reason for these differences may be infection rates, which were, for instance, higher in Sweden than in Finland during the first waves of the pandemic (see Chapter 2), as a result of which couples in Sweden may have been more likely to postpone wedding plans due to coronavirus fears. [2]Figure 1 also shows a short-lived marriage boom in February 2020 in all four of the Nordic countries included here. It is possible that some couples preponed planned weddings or decided to marry at short notice when initial news about the threat of a pandemic was gaining traction in the media.
In several countries, such as Denmark, Norway and Sweden, decreases in the number of marriages were more pronounced during the first half of 2020 and 2021 than during later parts of these years. In Denmark, and to a lesser extent in Finland and Norway, there was even a short marriage boom in October 2020. This may have been a reaction to Covid-19 infection rates which had been low during the summer and early autumn of both years. More couples may have felt encouraged to plan and eventually host their weddings after such a period with more limited virus transmission. Nonetheless, even these short marriage booms could not offset the overall decline in marriage numbers during the pandemic.
Footnotes
- ^ For Iceland and the Faroe Islands, marriage and divorce numbers by month are not available. Annual statistics from the NSIs for 2019 and 2020 show that the total number of marriages declined in both cases. The number of divorces declined in Iceland but remained stable on the Faroe Islands. Marriage and divorce numbers by month for 2021 were also not yet available from Norway at the time of writing.
- ^ Figure 1 also shows a short-lived marriage boom in February 2020 in all four of the Nordic countries included here. It is possible that some couples preponed planned weddings or decided to marry at short notice when initial news about the threat of a pandemic was gaining traction in the media.

Figure 3.1. Marriages and divorces in the Nordic Region, 2019-2021.
Source: NSIs.
Sticking together despite added stress? Couples during the Covid-19 pandemic
The Covid-19 pandemic not only reduced opportunities to date and marry, but also transformed the day-to-day lives of established couples. After teleworking and social distancing recommendations were introduced, many couples suddenly spent an unusual amount of time at home with little external support or distraction. [1]The opposite situation applied to couples and families living in separate households in different Nordic countries. For them, border closures made it difficult or impossible to meet during parts of the pandemic. This may have strengthened the bond of some couples but also increased the risk of tension and conflict (Prime, Wade & Browne, 2020). Financial strain also increased for many couples due to job loss or furlough schemes with unclear perspectives for the future (see Chapter 5). For couples with young children, these challenges were compounded by the closures of schools and childcare facilities.[2]In Sweden, where kindergartens and primary schools were never closed, parents may have been less affected by increasing childcare burdens, although many afterschool activities and meetings with families and friends were also put on hold there. This meant that parents had to spend substantially more time caring for their children and supporting their remote learning, in addition to fulfilling their own work obligations. These multiple demands were particularly challenging for single-parent families (OECD, 2020; Klette, Sigurðardóttir & Martin, 2021). For children with special care needs, access to services was also often reduced or cancelled, adding to family stress (OECD, 2020). First research suggests that a disproportionate share of the additional care burden was shouldered by women (Sevilla & Smith, 2020; Power, 2020). This even seems to have been the case in the Nordic countries which are often considered front runners in gender equality (Hjálmsdóttir & Bjarnadóttir, 2021; Dahlqvist, 2021).
On the flip side, surveys reveal that some couples and families have coped well during the pandemic, and even appreciated the slower pace of life and the increasing amount of time spent at home. Such positive experiences were mainly reported by socio-economically better-placed couples with no pre-existing vulnerabilities. Families that were already struggling before the Covid-19 pandemic, such as low-income families, single-parent families and those living in overcrowded housing, experienced the pandemic as more stressful (Sjögren et al., 2021; OECD, 2020).
Overall, the Covid-19 pandemic put many families in a highly unusual and demanding situation, with couples often having to balance family, work obligations and/or home schooling with little support or respite while also having to deal with social isolation and financial or health worries. These cumulative factors heightened stress levels, anxiety and depressive symptoms among some adults and children and increased the risk of harsh parenting and domestic violence (OECD, 2020). The diverse stressors also increased risks of conflict in couples, separation, and divorce (Prime, Wade & Browne, 2020).
In the Nordic countries, divorce processes usually take between six months and one year to complete. If the couple does not have children and the divorce is amicable, it can even be granted with immediate effect in Sweden and Denmark. As shown in Figure 3.1 (right panels), there has been no upswing in the number of divorces in the Nordic Region so far, neither during the early months of the pandemic, nor after a six-month or one-year delay. The only exception is Denmark, where the number of divorces was visibly higher throughout 2020 and parts of 2021 than it had been in 2019. However, there may be other factors than the pandemic at play in this specific case. According to Fallesen (2021), the jurisdiction for divorce was transferred from the Danish State Administration to the Danish Agency of Family Law at the start of 2019. This move caused substantial delays in the processing of divorce cases, which depressed the number of finalized divorces in 2019 while increasing them in 2020 when the backlog was resolved. Taking these administrative issues into account, Fallesen (2021) finds no indication that people’s intention to divorce has increased during the Covid-19 pandemic.
Even though divorce numbers have so far not increased notably in the Nordic countries, it is too early to judge the long-term impact of the pandemic on relationships and marital stability. Relationship breakdown, separation and divorce are processes that can take extended periods of time (Fallesen, 2021). During the pandemic, some spouses whose marriage has come under pressure may have decided to postpone separation and/or divorce due to practical or economic considerations. For one, the pandemic has been a period of economic insecurity. For many people, the prospect of leaving a spouse and starting a new life may have been too daunting in this context. Housing prices also increased substantially during the pandemic, which may have put practical limitations on spouses’ opportunities to establish separate households (see Chapter 9). It was probably also more difficult to obtain legal advice and divorce counselling during the pandemic. As a result, some couples may have decided to stick together, and divorces might only occur after a delay, if at all. In addition, it is important to note that Figure 3.1 only shows the number of finalised divorces. It does not capture the number of married and cohabiting couples who separated during the pandemic. Divorce statistics hence mask some aspects of relationship instability.
Baby boom or baby bust? Changes in the number of births during the pandemic
During the first months of the pandemic, questions were also raised about how the pandemic would affect couples’ fertility choices. One expectation was that the different restrictions, including lockdowns and social distancing requirements, might lead to a baby boom as couples would spend more time together at home with fewer distractions (see Döring, 2020). Others predicted, on the contrary, that the pandemic would lead to a baby bust. Economic uncertainty and unemployment might lead couples to postpone or forego fertility plans. Worries about a possible infection of mother and baby during or after pregnancy and relationship strain were also thought to play a role (United Nations, 2021a). In addition, access to assisted reproductive technology was more difficult to obtain in some countries, leading to fewer pregnancies among couples with fertility challenges (Aassve et al., 2020).
Footnotes
- ^ The opposite situation applied to couples and families living in separate households in different Nordic countries. For them, border closures made it difficult or impossible to meet during parts of the pandemic.
- ^ In Sweden, where kindergartens and primary schools were never closed, parents may have been less affected by increasing childcare burdens, although many afterschool activities and meetings with families and friends were also put on hold there.

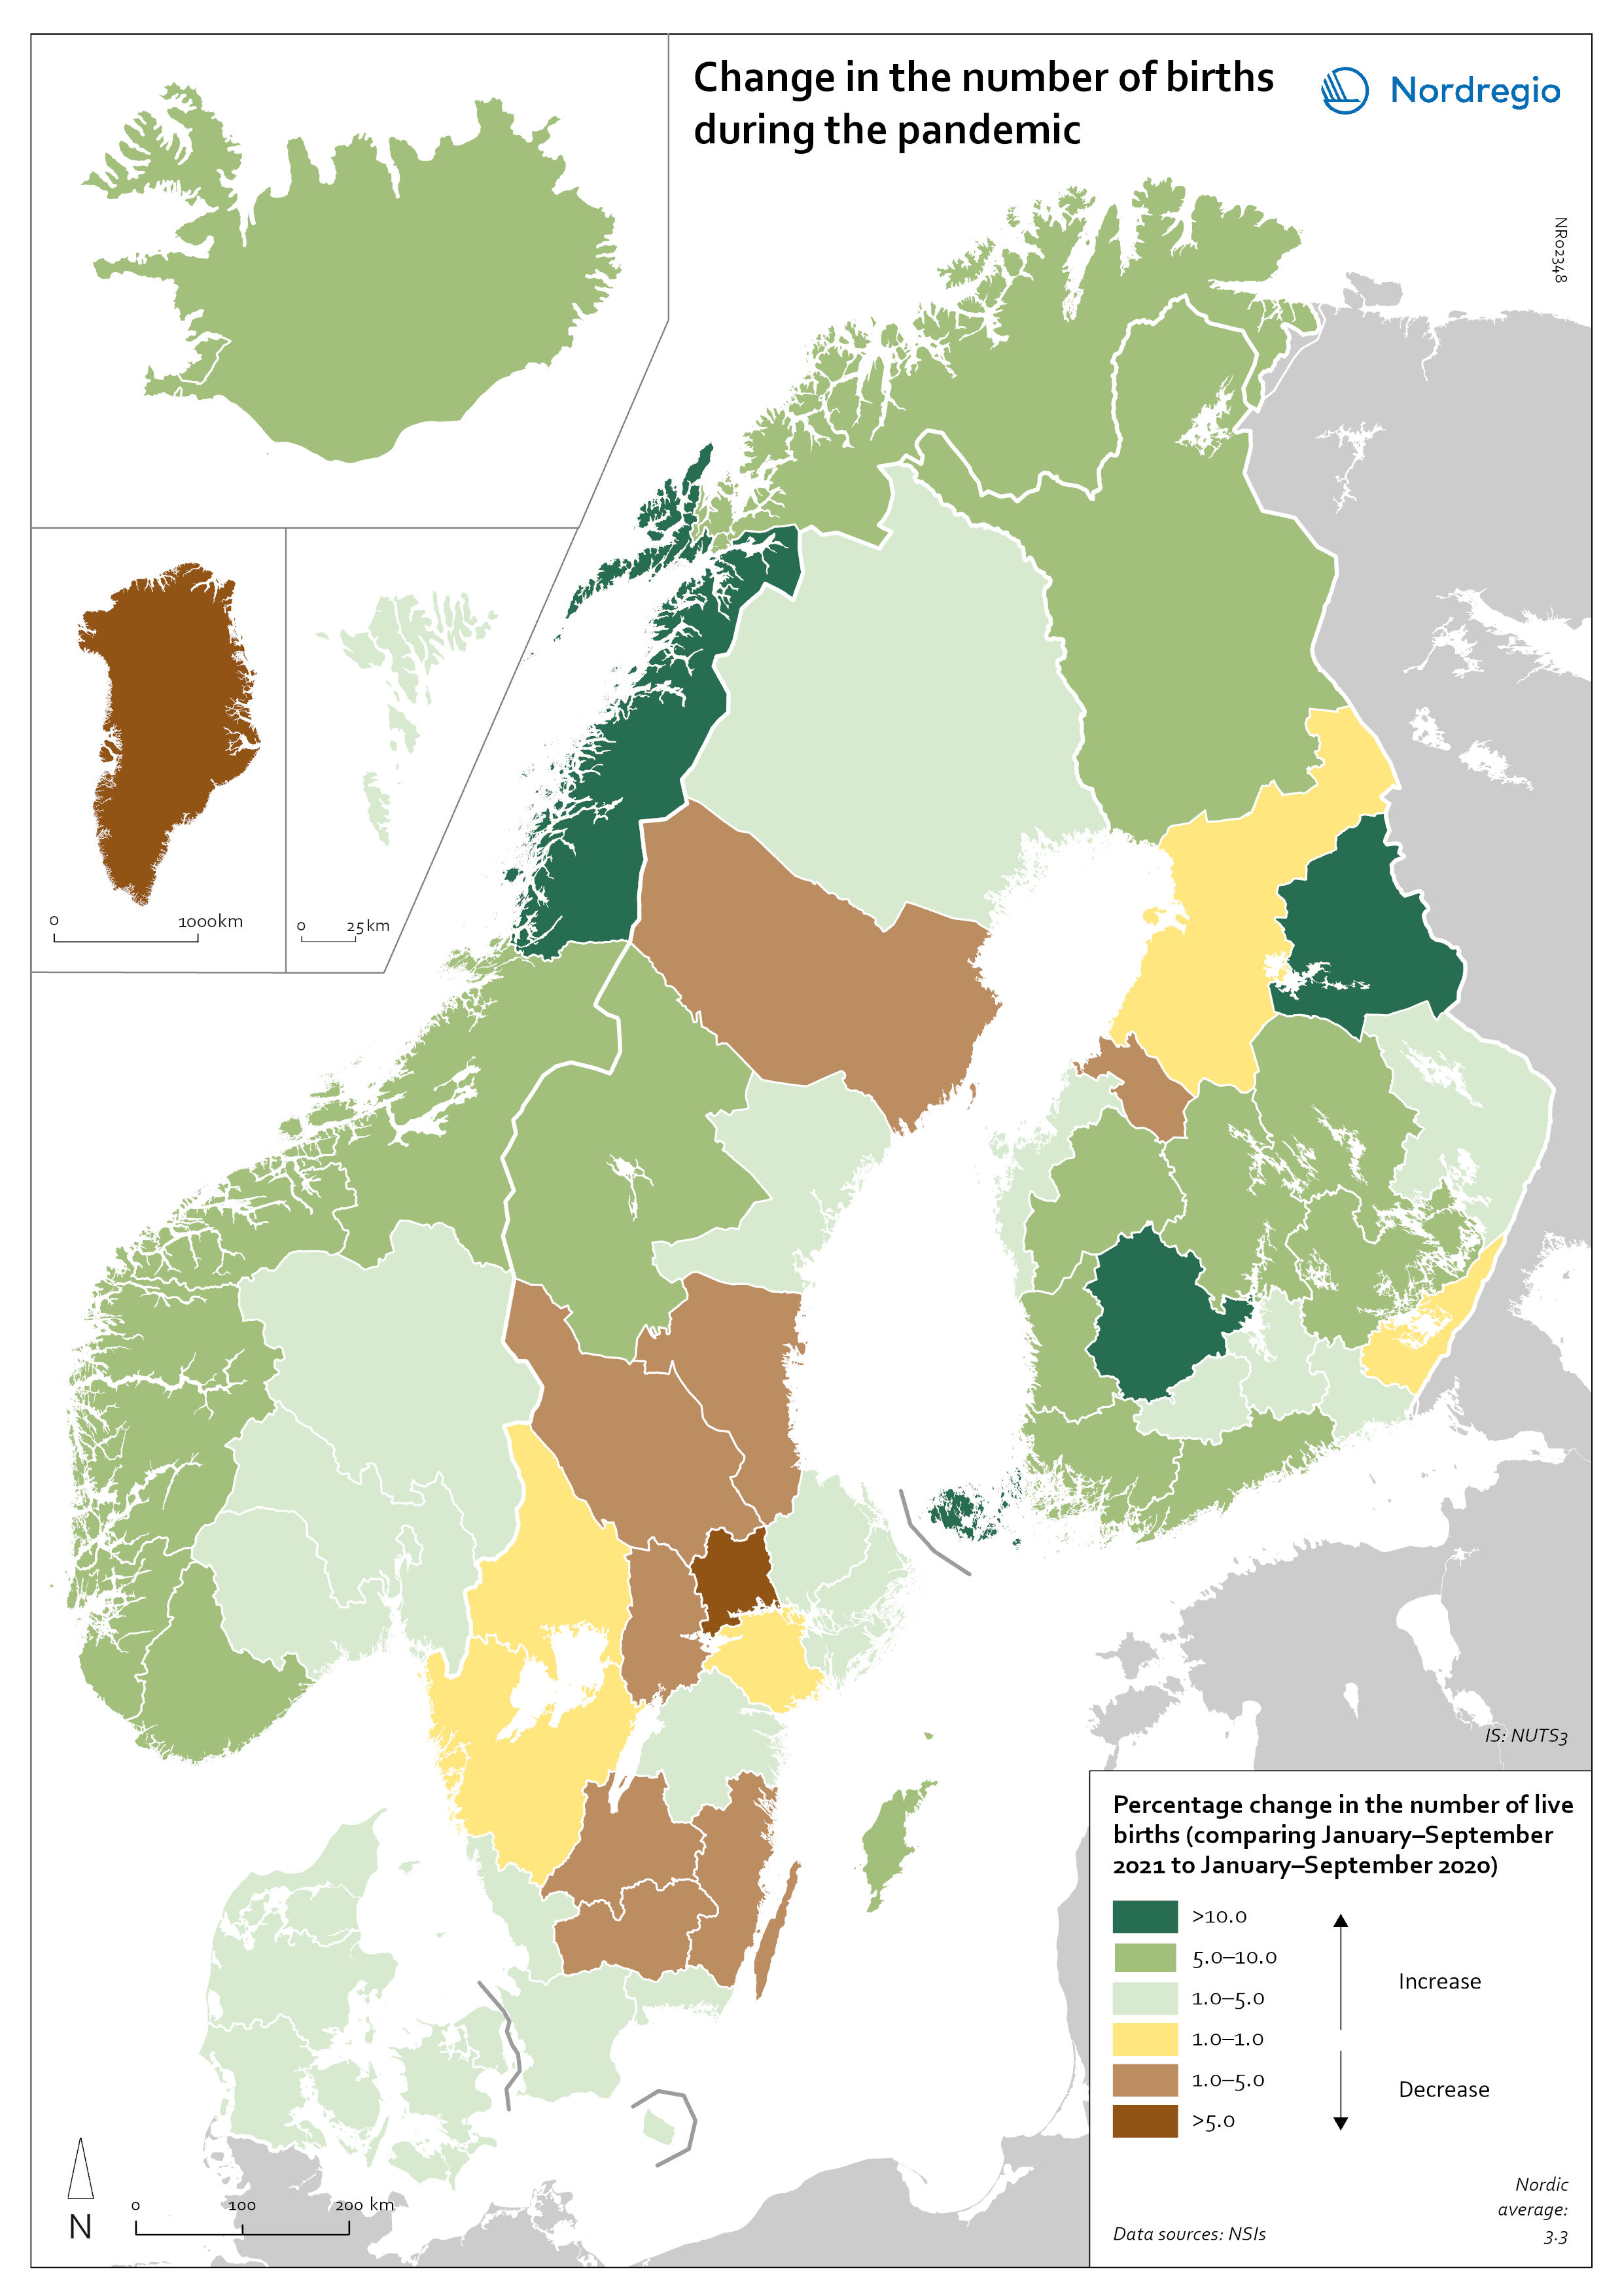
Map 3.1. Percentage change in the number of live births, comparing January-September 2021 to the same period in 2020.
Map 3.1 shows the number of births during the first nine months of 2021 (January to September) compared to the number of births during the same months in 2020. The babies born during the first nine months of 2021 were conceived between the spring and winter of 2020 when the first waves of the pandemic affected Europe. Babies born during the first nine months of 2020 were conceived in 2019 (i.e., before the pandemic). Map 3.1 therefore compares the number of births conceived before and during the pandemic.
At the time of writing, it seems as if both baby boom and baby bust predictions have been correct, with developments playing out differently across countries (see also Sobotka et al., 2021). In many Southern and Eastern European countries, such as Spain, Italy or Romania, the number of births declined by more than 3% during the first nine months of 2021. In Portugal and Poland, but also Greenland, drops in the number of births were particularly sharp with more than 5% fewer babies born in 2021. In several of these “baby bust” countries, these decreases in fertility came on top of already low fertility rates. Spain, Italy, Portugal and Poland, for instance, all already had a total fertility rate (TFR) of less than 1.5 children per woman before the crisis (Figure 3.2). These values are substantially below the so-called ‘replacement ratio’ of 2.1 children per woman, which is necessary to maintain population size. In these countries, existing demographic challenges have thus been aggravated during the pandemic (Luppi, Arpino & Rosina, 2020).
Figure 3.2. Total fertility rate (TFR) in European countries, 2019.
Source: Eurostat.
In a second group of countries, the number of births remained relatively stable during the pandemic (decreases or increases up to 1%). Several Central European countries such as Hungary, Czechia or Croatia fall into this category, but also Sweden, where the number of births was 0.7% higher during the first nine months of 2021 compared to the previous year. In these countries, the experience of the pandemic apparently did not compel couples to substantially change their fertility plans.
Finally, in a third group of countries the number of births was higher during the first nine months of 2021 than during the same period in 2020 (changes of at least +1%). This includes Belgium, Austria and Germany, but also Denmark. In Norway, Iceland, Finland and the Netherlands, as well as Åland, increases in birth numbers were particularly pronounced (+5% or more).[1]Note that in the autonomous regions, the annual number of births is comparatively low due to the small population sizes. Even small changes in the number of births therefore translate into large proportional changes. In Norway, Iceland and Finland this upturn in the number of births has come after a decade-long decline in fertility rates, thus reversing the trend, at least temporarily (Karlsdóttir, Heleniak & Kull, 2020). In these countries, couples seem to have considered the pandemic context as a good opportunity to fulfil fertility intentions.
How can the differential impact of the pandemic on fertility trends in Europe be explained? One hypothesis that has gained traction is that couples continued to have babies during the pandemic in countries with strong social safety nets such as the Nordic countries, where couples trusted that the state would replace lost income during and after the pandemic (Brown & Lorek, 2021; United Nations, 2021b). In the Nordic Region, gender and social policies have promoted gender equality, female labour force participation, and men’s involvement in care work since the 1960s. All Nordic countries offer generous paid parental leave schemes, often with targeted “daddy months”, as well as affordable childcare services to help both parents combine work and family obligations (Karlsdóttir, Heleniak & Kull, 2020). When careers were put on hold for couples due to reduced work hours, layoffs or unemployment, some couples may have considered these career breaks as a useful occasion to have a(nother) child and simultaneously buffer family income with parental leave payments (Brown & Lorek, 2021). In countries whose economies were already strongly hit during the global financial crisis in 2007 and 2008 and where social safety nets and family policies are less generous, such as Spain or Italy, the threat of a new crisis may have led more young people to postpone or even abandon fertility plans (Luppi et al., 2021). A further reason for the baby boom in several Nordic countries may be that infection and mortality rates were lower during the first year of the pandemic than in other parts of Europe (with the exception of Sweden), and economic decline was not as steep, which may have contributed to maintaining feelings of social and financial security among couples (see Chapter 2 and Chapter 8).
While most Nordic countries and autonomous territories saw a rise in births during the pandemic, not all regions followed this trend to the same extent (Map 3.2). Rural regions stand out as having had both baby booms and baby busts during the pandemic. In Finland, for example, rural regions reported both large increases in births (Kainuu) but also declines (Central Ostrobothnia). In Sweden, only a few regions registered an increase in the number of babies conceived during the pandemic; among those were rural Gotland and Jämtland. Kronoberg and Dalarna, by contrast, reported a drop of more than 3% in the number of births.
Footnotes
- ^ Note that in the autonomous regions, the annual number of births is comparatively low due to the small population sizes. Even small changes in the number of births therefore translate into large proportional changes.
Map 3.2. Percentage change in the number of live births in Nordic regions, comparing January - September 2021 to the same period in 2020.
Natural population change in the Nordic Region
During the pandemic, the Nordic Region not only experienced an increase in the number of births. During the first waves of the pandemic, most Nordic countries and autonomous regions also experienced somewhat elevated mortality levels, especially Sweden (see Chapter 2). Both of these factors influenced natural population change, which is defined as the difference between the number of live births and deaths in a given period of time. Natural population change can be positive, in which case the number of births exceeds the number of deaths. It can also be negative when there is an excess of deaths over births. By definition, migration trends are not taken into account when considering natural population change.[1]For a map on total population change, including migration, see Chapter 4.
Overall, natural population change was positive across most of the Nordic Region during the pandemic. This is shown in Figure 3.3, which compares the crude rate of natural population change for a range of countries. The crude rate of natural population change is defined as natural change per one thousand persons. This ratio controls for the population size of the various countries and regions. Figure 3.3 shows that the number of births exceeded the number of deaths in the Nordic countries during the period January to September 2020, when the first wave of the pandemic took place, and during the same period in 2021 when later waves affected the Nordic countries. Rates of natural population change were in some cases even higher during the pandemic than between January and September 2019 (i.e., pre-pandemic). The only exceptions are Åland, where natural population change turned negative in 2020, and Finland, which experienced negative population change during all three time periods. However, the baby boom during the first nine months of 2021 meant that natural population decline was not as pronounced as in previous years.
In a European comparison, the Nordic countries occupy an exceptional position. Most other countries reported natural population decline during the first nine months of 2019, 2020 and 2021. In many countries such as Latvia, Poland and Romania, natural population decline became especially pronounced during 2021, both because of increased mortality and declines in fertility.
Footnotes
- ^ For a map on total population change, including migration, see Chapter 4.
Figure 3.3. Crude rate of natural population change across European countries (per 1,000 persons), January to September 2019, 2020 and 2021.
Source: NSIs.
While all Nordic countries except Finland were characterised by positive natural population change during 2021, this growth was often particularly pronounced in and around cities and towns, with their relatively youthful populations (Map 3.3). Urban centres and their surrounding areas such as Stockholm and Malmö in Sweden, Oslo and Trondheim in Norway, Espoo and Helsinki in Finland or Aarhus and Copenhagen in Denmark all reported among the highest rates of natural population growth during the first nine months of 2021. Rural regions with their often-older population age structures were more likely to experience natural population decline, a pattern that had already existed prior to the pandemic. Especially in Finland, many rural municipalities reported high natural population decline during the first nine months of 2021, despite increases in the number of births, as shown in Map 3.2. In the other Nordic countries, only a few municipalities experienced similarly high levels of natural population decline.

Map 3.3. Natural population change in the Nordic Region (January to September 2021).
Conclusions
The Covid-19 pandemic and related mitigation measures have profoundly influenced the daily lives of couples and families. Teleworking, school closures, social distance requirements and other measures meant that families spent more time together at home with fewer distractions, activities and support than usual. Financial and health worries heightened stress levels, in particular among families with pre-existing vulnerabilities.
Despite these complex challenges, data and research presented in this chapter suggest that the pandemic has so far had a comparatively modest impact on family formation and dissolution trends in the Nordic Region. Despite expectations that the pandemic could increase risks of conflict in couples and divorce, there has so far been no notable increase in the number of divorces in the Nordic countries or Greenland and Åland. And while couples in several other European countries decided to postpone or forego fertility plans, the number of births has remained stable or even increased across almost the entire Nordic Region. This has been interpreted as a sign of couples’ trust in the welfare systems and in the ability of the Nordic economies to master the current crisis situation. Increases in the number of births helped to maintain natural population growth. While natural population decline accelerated during the pandemic in many other European countries, this has not been the case in the Nordic Region. In all of the countries except Finland, the number of births was higher than the number of deaths during the pandemic, leading to natural population growth.
Nonetheless, it would be too optimistic to conclude that all is well in the Nordic welfare states. Emerging research suggests that the pandemic may have increased stress levels, anxiety and depression symptoms among couples and families. Those who were in a vulnerable position before the pandemic, such as single-parent or low-income families, are likely to have been hit the hardest. These families and their children may need additional support going forward to avoid long-term disadvantages in terms of health, social and material wellbeing. Initial research from the Nordic countries and beyond also indicates that women have often taken over a larger share of additional care responsibilities during the pandemic, with implications for their health, careers, and income. Further research is needed to understand the long-term consequences of the pandemic on gender equality in the Nordic Region. Nordic co-operation can play an important role in comparing experiences and develop best practice in addressing the social effects of the pandemic.
References
Aassve, A., Cavalli, N., Mencarini, L., Plach, S. & Livi Bacci, M. (2020). The COVID-19 pandemic and human fertility. Science, 369(6502), 370-371.
Brown, Elizabeth A. & Lorek, N. (2021). The pandemic delivered a surprise to Nordic countries: a baby boom. National Geographic. Published December 27, 2021. Retrieved from https://www.nationalgeographic.com/history/article/the-pandemic-delivered-a-surprise-to-nordic-countries-a-baby-boom
Dahlqvist, A. (2021). Jämställdhetseffekter av covid-19. Kunskap och initiativ i Norden. Göteborg: NIKK. Retrieved from https://www.gu.se/sites/default/files/2021-06/Jamstalldhetseffekter-av-covid-19-Kunskap-och-initiativ-TG.pdf
Döring, N. (2020). How is the COVID-19 pandemic affecting our sexualities? An overview of the current media narratives and research hypotheses. Archives of Sexual Behaviour, 40, 2765-2778.
Fallesen, P. (2021): Decline in rate of divorce and separation filings in Denmark in 2020 compared with previous years. Socius. January 2021. doi:10.1177/23780231211009991.
Hansen, M., Sørensen, S. & Andersen, T. (2021). Analyse af udvikling og respons i nordiske arbejdsmarkeder som følge af COVID-19-pandemien. Aarhus: Teknologisk Institut.
Hjálmsdóttir, A. & Bjarnadóttir, V. (2021). ‘I have turned into a foreman here at home’: Families and work–life balance in times of COVID-19 in a gender equality paradise”. Gender, work & organization, 28(1), 268-283.
Karlsdóttir, A., Heleniak, T. & Kull, M. (2020). Births, children and young people. In J. Grundfelder, G. Norlén, L. Randall and N. Sánchez Gassen (Eds.), State of the Nordic Region 2020. Copenhagen: Nordic Council of Ministers.
Klette, K., Sigurðardóttir, A. & Martin, H. (2021). ‘Nordic values’ and schooling during COVID-19: how to balance comprehensive education and sustainable pandemic regulations. Education in the North, 28(3), 1-4.
Luppi, F., Arpino, B. & Rosina, A. (2020). The impact of COVID-19 on fertility plans in Italy, Germany, France, Spain, and the United Kingdom. Demographic Research, 43(47), 1399-1412.
OECD (2020). Combatting COVID-19's effect on children, OECD Policy Responses to Coronavirus (COVID-19). Paris: OECD Publishing.
Portolan, L. & McAlister, J. (2021). Jagged love: Narratives of romance on dating apps during COVID-19. Sexuality & Culture. doi:10.1007/s12119-021-09896-9.
Power, K. (2020). The COVID-19 pandemic has increased the care burden of women and families. Sustainability: Science, Practice and Policy, 16(1), 67-73.
Prime, H., Wade, M. & Browne, D. (2020). Risk and resilience in family well-being during the COVID-19 pandemic. American Psychologist. doi:10.1037/amp0000660.
Sevilla, A. & Smith, S. (2020): Baby steps: the gender division of childcare during the COVID-19 pandemic. Oxford Review of Economic Policy, 36(Supplement_1, 2020), S169–S186.
Sjögren, A., Engdahl, M., Hall, C., Holmlund, H., Lundin, M., Mühlrad, H. & Öckert, B. (2021). Barn och unga under coronapandemin. Lärdomar från forskning om uppväxtmiljö, skolgång, utbildning och arbetsmarknadsinträde, IFAU rapport 2021:2. Uppsala: IFAU.
Sobotka, T., Jasilioniene, A., Alustiza Galarza, A., Zeman, K., Németh, L. & Jdanov, D. (2021). Baby bust in the wake of the COVID-19 pandemic? First results from the new STFF data series. Retrieved from https://osf.io/preprints/socarxiv/mvy62/download
Stettersten, R., Bernardi, L., Härkönen, J., Antonucci, T., Dykstra, P., Heckhausen, J., … Thomson, E. (17 co-authors, 2020). Understanding the effects of COVID-19 through a life course lens. Current Perspectives on Aging and the Life Cycle, 45(100360).
Tinder (2021). The future of dating is fluid. Retrieved from https://www.tinderpressroom.com/futureofdating
United Nations (2021a). A review of research related to the impact of the COVID-19 pandemic on fertility. Background note. Retrieved from https://www.un.org/development/desa/pd/sites/www.un.org.development.desa.pd/files/undesa_pd_2021_egm_inf.7_background_note.pdf
United Nations (2021b). United Nations expert group meeting on the impact of the COVID-19 pandemic on fertility. New York, 10 and 11 May 2021 (virtual meeting). Retrieved from https://www.un.org/development/desa/pd/sites/www.un.org.development.desa.pd/files/files/documents/2021/Jul/final_egm_report_covid19_impact_fertility_08_07_2021.pdf
Wiederhold, B. (2021). How COVID has changed online dating – and what lies ahead. Cyberpsychology, 24(7), 435-436.
4. Migration
Author: Timothy Heleniak and Johanna Carolina Jokinen
Maps and data: Johanna Carolina Jokinen and Timothy Heleniak

To prevent the spread of Covid-19, starting in early 2020 and continuing to the present, the Nordic, EU and other countries instituted measures to restrict, prohibit or discourage mobility. As described in the introduction, these included recommendations against travel outside one country, restrictions against entry, mandatory quarantines upon entry, suggested or mandatory testing for Covid-19, restrictions on movement between regions within countries, and requirements to show proof of vaccination status. Many of these restrictions on movement ran counter to Nordic or EU norms guaranteeing free movement. These mobility barriers were constantly changing, difficult to follow, and implemented with varying degrees of enforcement. While it remains to be seen how effective these anti-mobility measures have been in preventing the spread of the virus, it does seem that they have had a significant impact on mobility. This includes people travelling and commuting and those making permanent moves across international borders or within the Nordic countries.
Prior to the onset of the pandemic, several trends characterised migration and mobility in the Nordic Region. First, compared to other high-income countries, the populations of the Nordic countries are relatively mobile, as noted in the previous State of the Nordic Region (Heleniak, 2020). In the Nordic countries, between 13% and 16% of the population change residence in any given year. Second, immigration has accounted for two-thirds of the population increase in the Nordic Region since 1990. As a result, the share of the populations which are foreign-born has reached historic highs. Third, there has been a long-term trend of urbanisation, away from remote and rural regions towards the larger urban settlements in all of the Nordic countries and regions. A fourth trend of the Nordic populations is multi-locality, spending considerable amounts of time in different homes, as there is a long tradition of second-home ownership (Slätmo, Ormstrup Vestergård, & Lidmo, 2020).
Chapter 6 in this volume analyses the impact of the pandemic on labour mobility and travel. This chapter provides an overview of how the pandemic and migration restrictions have affected international and internal migration patterns in the Nordic countries since the start of 2020 and the contribution of migration to population change. Migration, as defined here, encompasses permanent changes in residence. Many of the mobility restrictions put in place had a quite immediate impact on travel, commuting and short-term mobility. Permanent changes in residence take longer to plan and execute, but the mobility restrictions also indirectly impacted migration.
International migration
Annual data on international migration
Travel and commuting were immediately affected by the restrictions put in place early in the pandemic to curb the spread of Covid-19 (Giacometti & Wøien Meijer, 2021). Many of these initial restrictions were comparatively severe as considerable uncertainty existed on how the virus was spread. Migration was also affected by the restrictions as there were declines in both immigration to and emigration from the Nordic countries. There is a longer lead time for a permanent change in residence, as it often involves a job search, the sale or purchase of a home, a physical move, and, if across an international border, satisfying of legal requirements. Some permanent moves were already underway when restrictions started in spring 2020. Though mobility restrictions did not cover the whole year, their impact on migration was felt in 2020.
From 2019 to 2020, immigration declined by 15–30% to Iceland, Norway, Sweden and Denmark, while there was no decline in Finland (Figure 4.1). There were declines in immigration to Greenland and the Faroe Islands and an increase to Åland (Statistics Faroe Islands, 2021; Statistics Greenland, 2021; Statistics and Research Åland (ÅSUB), 2021). There were slight increases in emigration from Iceland and Sweden, no change in Norway, and decreases from Finland and Denmark (Figure 4.2). There was a 25% decline in emigration from Greenland and no change from theFaroe Islands and Åland. When data becomes available for 2021, the numbers are expected to show a further decline in migration due to uncertainty and continued restrictions.
Figure 4.1. Immigration into the Nordic countries, 1990 to 2020.
Source: NSIs.
Note: Data from Finland include Åland.
Figure 4.2. Emigration from the Nordic countries, 1990 to 2020.
Source: NSIs.
Note: Data from Finland include Åland.
Periodic data on international migration
Periodic migration data is available to measure the impact of the mobility restrictions on permanent changes in residence, both international and internal. Monthly data are available for the Faroe Islands, Finland, Greenland and Sweden (Statistics Faroe Islands, 2021; Statistics Finland, 2021; Statistics Greenland, 2021; Statistics Sweden, 2021). Quarterly data is available for Denmark, Norway and Iceland (Statistics Denmark, 2021; StatBank Norway, 2021; Statistics Iceland, 2021). There is a seasonality to migration which makes it difficult to disentangle the impacts of migration restrictions. There tends to be a peak in migration during the summer months. There does seem to have been a drop in both immigration and emigration from April to June 2020, followed by an upswing later in the summer for some countries due to the easing of restrictions or the resumption of delayed moves. However, these upswings were minor and did not compensate for the smaller number of moves during the earlier period. The decisions regarding migration and border closures taken earlier in the pandemic were made with incomplete information on how the virus spread, preferring to err on the side of caution through strict measures. Immigration to the Nordic countries seems to have been affected more by the pandemic than emigration, with larger declines in immigration, perhaps because the Nordic countries generally have net immigration. Based on the monthly data for Sweden for 2021, immigration will be about half of the average for the previous five years, and emigration will be about 90%. Based on quarterly data for 2021, both immigration and emigration in Denmark will be about 20% lower than the average and Iceland will have about 10% less immigration and emigration.
Migration by citizenship and country
One trend in the Nordic countries in recent years has been net emigration of citizens and net immigration of non-citizens (Heleniak, 2018), the flows of non-citizens into the countries being much larger than the outflows of citizens. This trend was reversed or weakened in 2020, presumably because many people thought that they would be better off in their country of citizenship during the period of restrictions and shutdowns. Nearly every country in the world allowed its citizens to return during the pandemic. Collectively, in the five Nordic countries, net emigration was 6,993 citizens in 2019, which changed to net immigration of 2,347 in 2020. Net immigration of non-citizens remained positive but fell considerably between 2019 and 2020 from 130,184 to 73,539.
The closure of national borders has had an impact on migrants and asylum seekers. One consequence has been that work-at-home and physical distancing orders have made interviews or screening of migrants either impossible or difficult (Rasche, 2020). This has had an especially large impact on third-country nationals who need residence permits to stay in Nordic countries (Sommarribas & Nienaber, 2021). The restrictions on movement left some migrants stranded without a legal right to live in the country where they were residing (Newland, 2020). In other cases, migrants chose to return to their countries of origin after losing their jobs abroad. The pandemic has been described as a disaster of immobility rather than forced migration. With the border closures favouring some sending countries over others, the patterns of migration by country changed in 2020.
Immigration into Iceland declined by 1,777 in 2020. Most of this decline consisted of lower immigration from the Czech Republic, Lithuania, Poland and Serbia, traditional sources of labour for Iceland (Statistics Iceland, 2021). Norway’s decline in immigration of 14,078 in 2020 consisted of declines in immigration from Poland, India, Uganda, the Philippines and Lithuania, again mostly countries that export labour (StatBank Norway, 2021). Immigration into Sweden declined by 33,287 in 2020, with the largest numerical declines coming from Afghanistan, India, Syria, Eritrea, Iran, Iraq, Somalia, China, Pakistan, Bangladesh, Poland and Romania, a combination of countries from which refugees flee, labour is exported and students are sourced (Statistics Sweden, 2021). The level of immigration to Finland was the same in 2020 as the previous year, with small increases from Sweden, Germany and Spain and small declines from Serbia, Turkey and India (Statistics Finland, 2021). Immigration into Denmark declined by 13,578 in 2020, with the largest declines from the USA, India, Romania, China, Ukraine, Argentina, Lithuania and Poland, a combination of countries from which students and labour are sourced. Immigration into the Faroe Islands only declined slightly in 2020, mostly consisting of declines from Lithuania, Poland and Romania, countries that export labour (Statistics Faroe Islands, 2021). Immigration into Greenland declined by 400 in 2020, nearly all of the fall due to declines in immigration from Denmark, its major migration partner (Statistics Greenland, 2021). Åland was a rare exception where immigration increased by 110 in 2020, mostly due to increased immigration from Sweden (Statistics and Research Åland (ÅSUB), 2021). Thus, the picture that emerges from the early part of the pandemic in 2020 is decreased immigration into the Nordic countries and regions. The largest declines were from eastern European countries that export labour. There were also declines from countries that send students, and Sweden registered a decline from countries that have traditionally been sources of refugees. Because of the longer lead time for international migration, when data for 2021 becomes available, a more complete portrait of the patterns of immigration to the Nordic Region will emerge.
Emigration from Iceland increased by 944 persons in 2020 (Statistics Iceland, 2021). The main destinations to which emigration increased were Croatia, Lithuania, Latvia, Poland, Portugal and Romania, all countries which had sent large numbers of labour migrants to Iceland in previous years. Emigration from Norway was essentially unchanged from 2019 (StatBank Norway, 2021). Emigration from Sweden increased by 1,219 in 2020 (Statistics Sweden, 2021). There were increases in emigration of those with Romanian, Chinese, Polish, Lithuanian, Syrian or Somalian citizenship. In 2020, emigration from Finland declined by 2,179 (Statistics Finland, 2021). The largest declines were to the neighbouring countries of Sweden, Estonia, as well as to Russia, the United States and the United Kingdom. Emigration from Denmark declined by 15,177 in 2020 (Statistics Denmark, 2021). The destination countries with the largest declines in emigration from Denmark were the USA, Poland, Romania, Australia and Spain. In 2020, emigration from Greenland declined by 656, all related to declining emigration to Denmark (Statistics Greenland, 2021). Emigration from the Faroe Islands stayed roughly the same in 2020 as the previous year (Statistics Faroe Islands, 2021), as did emigration from Åland (Statistics and Research Åland (ÅSUB), 2021).
Regional patterns of international migration
Map 4.1 shows the annual average international net migration from 2010 to 2019 and in 2020. At regional level, there are only minor changes between the maps. At municipal level, the maps show more changing patterns. In Denmark, Norway and Sweden, several municipalities – both in the capital, intermediate, and rural regions –had lower levels of international net migration in 2020. In Iceland and Finland, the picture is more balanced, with some municipalities showing a decrease, others an increase. In the Faroe Islands and Greenland, several municipalities/regions had an increase in international net migration.


Map 4.1a. Net international migration rate 2010–2019.
Map 4.1b. Net international migration rate 2020.
Internal migration
Internal migration over time
This section turns to internal migration, permanent moves made within countries. As noted above, the populations of the Nordic countries tend to be more mobile than those elsewhere in Europe. The data upon which to analyse the impacts of the pandemic on internal movements is rather fragmented. Based upon annual data, there were increases in internal migration as opposed to the declines seen for immigration and emigration. From 2019 to 2020, the number of people moving internally within Denmark increased by 4% to the highest total in the past four decades (Statistics Denmark, 2021). In Iceland, over the same period, the number of people moving internally increased by 16% to the highest level since 1986 (Statistics Iceland, 2021). In Sweden, the number of internal moves increased by 4% in 2020, to the highest level since at least 2000 (Statistics Sweden, 2021). In the Faroe Islands, there was an 8% increase in internal migration (Statistics Faroe Islands, 2021). In Finland, there was a 2% increase in internal moves (Statistics Finland, 2021). Norway also had an increase in internal moves in 2020 of 6% to its highest level in the past sixty years (StatBank Norway, 2021). Greenland seems to be the only area where there was a decline in internal movements in 2020, of 14% (Statistics Greenland, 2021). Based on these preliminary data, it appears that the mobile Nordic populations responded to the pandemic and shutdowns by increasing their internal migration. More data, time, and research will be needed to understand the patterns of migration and motivations behind these increases.
In the Nordic countries and elsewhere, without the requirement to show up at the office every day, or only periodically, many chose to live further from the office, either at a second home or to move further away (Kolko, Emily, & Bui, 2021). Most of the Nordic countries had relatively high shares of the labour force working from home, even before the pandemic (see Chapter 7). In 2020, there were increases in the number of people who moved away from Stockholm, Oslo, Helsinki and Copenhagen, but there were increases in previous years as well. There is some speculation that the movement away from city centres in the Nordic capitals might not be a temporary phenomenon (Botsjö & Backlund, 2021).


Map 4.2a. Net internal migration rate 2010–2019.
Map 4.2b. Net internal migration rate 2020.
Regional patterns of internal migration
Map 4.2 compares annual average internal net migration between the period 2010 to 2019 and 2020. The maps show several interesting patterns, suggesting that there may be an increasing trend towards urban-to-rural countermigration in all the five Nordic countries because of the pandemic. In other words, there are several rural municipalities – both in sparsely populated areas and areas close to major cities – that have experienced considerable increases in internal net migration. In Finland, for instance, there are several municipalities in Lapland that attracted return migrants to a considerable degree in 2020 (e.g., Kolari, Salla, and Savukoski). Swedish municipalities with increasing internal net migration include municipalities in both remote rural regions (e.g., Åre) and municipalities in the vicinity of major cities (e.g., Trosa, Upplands-Bro, Lekeberg, and Österåker). In Iceland, there are several remote municipalities that have experienced a rapid transformation from a strong outflow to an inflow of internal migration (e.g., Ásahreppur, Tálknafjarðarhreppurand, and Fljótsdalshreppur). In Denmark and Norway, there are also several rural municipalities with increasing internal net migration, even if the patterns are somewhat more restrained compared to the other Nordic countries. Interestingly, several municipalities in capital regions are experiencing a steep decrease in internal migration (e.g., Helsinki, Espoo, Copenhagen and Stockholm). At regional level, such decreases are noted in the capital regions of Copenhagen, Reykjavík and Stockholm. At the same time, the rural regions of Jämtland, Kalmar, Sjælland, Nordjylland, Norðurland vestra, Norðurland eystra and Kainuu recorded increases in internal net migration. While some of the evolving patterns of counterurbanisation were noted before 2020 for the 30–40 age group (Jokinen & Cuadrado, 2020), these trends seem to have been strengthened by the pandemic. In addition to return migration, there may be a larger share of young adults who decide to stay in rural regions. These trends are based on data on permanent places of residence. Given the large number of people with second homes in the Nordic Region, it is possible that many people are spending increased amounts of time in those homes, but these flows are not captured in the data (Slätmo, Ormstrup Vestergård, & Lidmo, 2020).
Migration as a component of population change
National level trends
The population of the Nordic Region has been growing slowly in recent decades, with one-third of growth coming from natural increase and two-thirds from net immigration. While the population continued to grow in 2020, it was the smallest population increase in 16 years (Table 4.1). The same pattern held with net immigration accounting for most of the population growth. While there continued to be a natural increase (more births than deaths), the excess of births over deaths was the smallest in two decades. The number of births declined slightly, by 0.8% from 2019 to 2020 but has been declining since peaking in 2010, mostly because of there being fewer women of childbearing age. There was a 4.8% increase in the number of deaths in 2020, which caused the natural increase to be so low, though it remains higher than in many European countries where there is a decrease (see Chapter 3). While there has been a slow increase in the number of deaths in recent years due to an ageing population, much of the increase in 2020 was due to the pandemic (see Chapter 2). While more people immigrated to the Nordic Region than emigrated, the impact of mobility restrictions was already apparent in 2020. Net immigration was the smallest since 2005, shortly after the major EU enlargement. Between 2019 and 2020, immigration fell by 21%, emigration by 9%.
| Population (Jan 1) | Population change, 2020 (absolute) | Population change, 2020 (absolute) | ||||||
| 2020 | 2021 | Total | Natural increase | Net migration | Total | Natural increase | Net migration | |
| Denmark | 5,822,763 | 5,840,045 | 17,282 | 6,292 | 10,920 | 0.3 | 0.1 | 0.2 |
| Finland* | 5,525,292 | 5,533,793 | 8,501 | -9,025 | 17,814 | 0.2 | -0.2 | 0.3 |
| Iceland | 364,134 | 368,792 | 4,658 | 2,211 | 2,240 | 1.3 | 0.6 | 0.6 |
| Norway | 5,367,580 | 5,391,369 | 23,789 | 12,352 | 11,331 | 0.4 | 0.2 | 0.2 |
| Sweden | 10,327,589 | 10,379,295 | 51,706 | 14,953 | 33,581 | 0.5 | 0.1 | 0.3 |
| Faroe Islands | 52,154 | 52,934 | 780 | 313 | 505 | 1.5 | 0.6 | 1.0 |
| Greenland | 56,081 | 56,421 | 340 | 314 | -42 | 0.6 | 0.6 | -0.1 |
| Åland | 29,884 | 30,129 | 245 | -30 | 215 | 0.8 | -0.1 | 0.7 |
| Total | 27,515,593 | 27,622,649 | 107,056 | 27,410 | 76,349 | 0.4 | 0.1 | 0.3 |
Table 4.1. Population change by component in the Nordic Region, 2020 (January 1 to December 31).
Source: NSIs of the Nordic countries.
* Data from Finland includes Åland.
Regional and municipal level trends
Regional and municipal patterns of population change by component in 2010-2019 and 2020 are shown in Map 4.3. Regions are divided into six classes of population change. Those in shades of blue or green are where the population has increased, and those in shades of red or yellow are where the population has declined. At the regional level (see small inset map), population increase was evident due to either net migration or a combination of net migration and natural increase in all regions of Denmark, Norway and Sweden between 2010 and 2019. While this trend was maintained in Denmark, some regions in Sweden and Norway saw their populations decline in 2020 due to either negative natural change (Dalarna, Innlandet and Norrbotten), negative net migration (Troms og Finnmark) or a combination of both (Nordland and Västernorrland). Many regions in southern and eastern Finland also had population declines, mainly because the country had more deaths than births, a trend that pre-dated the pandemic (Karlsdóttir, Heleniak, & Kull, 2020). In Iceland, some slight changes to the drivers of population growth in are evident in several regions in 2020, as well as a shift to population increase in Norðurland vestra.
At the municipal level, a more varied pattern emerges, with municipalities having quite different trends than the regions of which they form part. Many municipalities in western Denmark are declining because of negative natural change and outmigration. Many smaller municipalities in Norway and Sweden saw population decline from both negative natural increase and out-migration despite their regions increasing their populations. Many smaller municipalities in Finland outside the three big cities of Helsinki, Turku, and Tampere also saw population decline from both components.


Map 4.3a. Population change by component 2010-2019.
Map 4.3b. Population change by component 2020.
Conclusions
The pandemic is not over, and it will take some time for the migration impacts to play out in full. Due to national and EU border controls, international migration to and from the Nordic countries has decreased and seems likely to stay low for some time. Work-at-home recommendations, which seemed temporary early in the pandemic, now appear to be becoming the norm or at least accepted by many employees and employers, for those occupations where it is possible to work from home. For many in the Nordic Region, working from home can mean working some considerable distance from the office, even including in a different country. This has the potential to alter the long-term urbanisation patterns in the region. With the high levels of second-home ownership in the Nordic countries compared to elsewhere in Europe, the rethinking of where people work and where they live may result in even more people living at multiple locations (Müller, 2021).
References
Botsjö, M., & Backlund, J. (2021, May 3). Flykten från storstäderna under pandemin – global förändring eller kortvarig trend? Dagens Nyheter. Retrieved from https://www.dn.se/ekonomi/flykten-fran-storstaderna-under-pandemin-global-forandring-eller-kortvarig-trend/
Giacometti, A., & Wøien Meijer, M. (2021). Closed borders and divided communities: status report and lessons from Covid-19 in cross-border areas. Stockholm: Nordregio. doi:http://doi.org/10.6027/R2021:6.1403-2503
Heleniak, T. (2018). From Migrants to Workers: International migration trends in the Nordic countries. Stockholm: Nordregio. doi:DOI: 10.30689/WP2018:1.1403-2511
Heleniak, T. (2020). MIGRATION AND MOBILITY – more diverse, more urban. In State of the Nordic Region 2020 (pp. 40-50). Copenhagen: Nordic Council of Ministers.
Jokinen, J. C., & Cuadrado, A. (2020). 2. Demographic trends. In A. Lundgren, L. Randall, & G. Norlén, STATE OF THE NORDIC REGION 2020. Wellbeing, health and digitalisation edition (pp. 13-24). Copenhagen: Nordic Council of Ministers. Retrieved from http://norden.diva-portal.org/smash/get/diva2:1482486/FULLTEXT01.pdf
Karlsdóttir, A., Heleniak, T., & Kull, M. (2020). Births, Children and Young People. In State of the Nordic Region 2020. Copenhagen: Nordic Council of Ministers.
Kolko, J., Emily, B., & Bui, Q. (2021, April 19). How the Pandemic Did, and Didn’t, Change Where Americans Move. The New York Times. Retrieved from https://www.nytimes.com/interactive/2021/04/19/upshot/how-the-pandemic-did-and-didnt-change-moves.html?action=click&module=Spotlight&pgtype=Homepage
Müller, D. K. (2021). 20 years of Nordic second-home tourism research: a review and future research agenda. Scandinavian Journal of Hospitality and Tourism, 21(1), 91-101. doi:https://doi.org/10.1080/15022250.2020.1823244
Newland, K. (2020). Will International Migration Governance Survive the COVID-19 Pandemic? Migration Policy Institute.
Rasche, L. (2020). Four implications of the Covid-19 pandemic for the EU’s asylum and migration policy. Berlin: Hertie School. Jacques Delors Centre.
Slätmo, E., Ormstrup Vestergård, L., & Lidmo, J. (2020). Compact cities trigger high use of second homes in the Nordic Region. Stockholm: Nordregio Policy Brief 2020:2. Retrieved from http://norden.diva-portal.org/smash/record.jsf?pid=diva2%3A1414841&dswid=9309
Sommarribas, A., & Nienaber, B. (2021). Migration and mobility of third-country national labour workers to and inside Europe during the Covid-19 pandemic – a legal analysis. Comparative Migration Studies, 9-22. doi:https://doi.org/10.1186/s40878-021-00229-1
StatBank Norway. (2021, March 10). StatBank Norway. Retrieved from StatBank Norway: https://www.ssb.no/en/statbank
Statistics and Research Åland (ÅSUB). (2021, November 1). Databases. Retrieved from Statistics and Research Åland (ÅSUB): https://www.asub.ax/en/databases
Statistics Denmark. (2021, November 1). Statbank. Retrieved from Statistics Denmark: https://www.statbank.dk/statbank5a/default.asp?w=1536
Statistics Faroe Islands. (2021, November 1). Statbank. Retrieved from Statistics Faroe Islands: https://statbank.hagstova.fo/pxweb/en/H2/
Statistics Finland. (2021, November 1). StatFin. Retrieved from Statistics Finland: https://pxnet2.stat.fi/PXWeb/pxweb/en/StatFin/
Statistics Greenland. (2021, November 1). Statistics Greenland. Retrieved from Statbank: https://bank.stat.gl/pxweb/en/Greenland/
Statistics Iceland. (2021, September 3). Statistics Iceland. Retrieved from Experimental statistics - Deaths: https://www.statice.is/publications/experimental-statistics/deaths-ex/
Statistics Sweden. (2021, October 29). Statistical database. Retrieved from Statistics Sweden: https://www.statistikdatabasen.scb.se/pxweb/en/ssd/

LABOUR MARKET
What current labour market trends do we see in the Nordic Region? Are there differences between the countries? How has labour market mobility changed during the pandemic? Will we work less at the office now that we know how effective working from home can be? The Labour Market section takes you through these issues and more.
5. Labour market impacts of
Covid-19
Authors: Johanna Carolina Jokinen and Gustaf Norlén
Data and maps: Gustaf Norlén, Anna Vasilevskaya, Johanna Carolina Jokinen and Teodor Wolk

The Nordic welfare model is characterised by comprehensive public services financed mainly by tax revenues and redistribution of market incomes. The public sector and the generous social services and transfers it provides are thus enabled by active labour market policies that promote a high employment rate and rapid labour market re-entry for unemployed people (Greve et al., 2020; Lundgren and Randall, 2020). As previous research has shown, there tends to be a positive correlation between generous welfare benefits and high labour force participation, which seem to fuel each other (Barth and Moene, 2012). The Nordic model is known to be resilient as it easily adjusts and efficiently responds to crises and the needs of a changing society, for instance, “through industrial restructuring, innovation, and reconfiguring of institutions and policies” (Alsos and Dølvik, 2021: 18). This capacity to overcome hard times, however, may have deteriorated due to the recent increase in inequality (Alsos and Dølvik, 2021; Lundgren et al., 2020).
The Covid-19 pandemic has impacted the labour market in two ways. First, employees were not able to go to their workplaces because of lockdowns. In April 2020, for instance, the share of the world’s employees living in high-income countries with mandatory or recommended workplace closures reached 70% (ILO, 2020). Second, many sectors had to reduce their activities due to a drastic change in demand and interruptions to supply chains and logistics. Some sectors have also been affected by other problems during the pandemic, including shortages of important metals and semiconductor materials and a rapid readjustment of certain industries, such as distilleries that started to produce hand sanitiser and hotels that became quarantine centres (Dincer and Gocer, 2021; The New York Times, 2021; TIME, 2020). Due to these factors, unemployment rose rapidly at the beginning of the pandemic. In fact, the pandemic has been described as the most severe global crisis since the Second World War with “deep, far-reaching and unprecedented” employment impacts (ILO, 2020: 3; see also Nieuwenhuis and Yerkes, 2021). In many Nordic and other European countries, measures were put in place to mitigate the labour market impacts of the pandemic in the form of job retention and furlough schemes. Notwithstanding these measures, the unemployment rate went up in many countries and regions.
In comparison to more traditional economic crises, such as the 2008 financial crisis, the labour market effects of the Covid-19 pandemic have been far more selective and highly unequal between and within countries (Adams-Prassl et al., 2020; Fana et al., 2020; Nieuwenhuis and Yerkes, 2021; OECD, 2020). As estimated by the OECD (2020), vulnerable groups in the labour market have been the most affected, including young people, women, people with low levels of educational attainment, immigrants and atypical workers (see also Nieuwenhuis and Yerkes, 2021). Atypical work is defined as an employment arrangement that does not follow the standard model of indefinite full-time employment (Eurofond, 2022; European Institute for Gender Equality, 2022; Schoukens and Barrio, 2017). Many individuals in these groups work in sectors that were badly affected by the pandemic, and young people and immigrants often work on temporary contracts that were not renewed when the pandemic broke out (Sánchez Gassen and Penje, 2021). Due to preschool and school closures, many households have also experienced unequal distribution of paid and unpaid work replicated along gender lines since women have been taking care of home-schooling to a greater extent than men (Lind and Gunnarsson, 2021).
In this chapter, we start by analysing effects of the Covid-19 pandemic on employment and unemployment in the Nordic countries. We also look at how governments of the Nordic countries used furlough schemes to mitigate the labour market impacts of the pandemic, followed by an analysis of which sectors and groups were the most affected. We conclude by summarising our findings and by comparing the Covid-19 labour market recovery to previous economic crises.
Covid-19 impacts on employment and unemployment rates
In general terms, the labour markets and working life in the Nordic Region are heavily affected by global megatrends, such as the processes of population ageing, urbanisation, digitalisation, labour migration, and environmental change (Alsos and Dølvik, 2021). Before the Covid-19 pandemic, employment rates in the Nordic countries were considerably higher than the EU average (Grunfelder, 2020). There were also relatively low unemployment rates in the Nordic Region compared to the EU average, with the exception of Finland and Sweden (Greve et al., 2020). The employment rate measures the number of employed persons as a proportion of the total working-age population (15-64 years), whereas the unemployment rate refers to those of working age who are actively seeking employment as a proportion of the total labour force (i.e., the total number of employed and unemployed people; Karlsdóttir et al., 2018; see also the box below: Measuring the labour market impacts of Covid-19). The number of people searching for work at any given moment tends to fluctuate and, as such, the unemployment rate is often used as a short-term indicator of labour market health. Alternatively, the employment rate is more stable over time and may give a slightly different picture of the labour market status from a longer-term perspective. The employment rates in the Nordic Region have been particularly high for women and older age groups in comparison to most EU countries (Grunfelder et al., 2020; see also Halvorsen, 2021). When it comes to labour market integration, the difference between unemployment rates for native born and non-EU27 immigrants in the Nordic countries were at EU27-level (6.3%) or lower in 2019, except for Finland (7.4%) and Sweden (14.0%).
Map 5.1 shows the employment rate for all Nordic municipalities and regions in 2020. The highest employment rates were found in the Faroe Islands and in many smaller municipalities in Norway and Sweden, whereas the lowest employment rates were in Greenland and several municipalities in Finland. At regional level, the Faroe Islands, the regions of Halland, Jämtland, Jönköping, Norrbotten and Stockholm in Sweden, and the region of Møre og Romsdal in Norway had an employment rate above 80%. Employment rates below 70% were recorded in Greenland and the regions of Etelä-Karjala, Kainuu, Kymenlaakso and Pohjois-Karjala in Finland. Compared to employment rates in previous years, it is clear that the employment rate has been falling in Iceland and in several medium-sized municipalities in Sweden, while only slight changes can be observed elsewhere (cf. Grunfelder et al., 2020; Norlén, 2018).

Map 5.1. Employment rate in 2020.
Figure 5.1. Unemployment rate (15-64 years old).
Source: Eurostat (LFS).
Note: 3-month rolling average. GL, AX: Register data. FO: Annual data.
In comparison to the employment rate, the unemployment rate showed more distinct Covid-19 impacts. As shown by quarterly data in Figure 5.1, unemployment rates in the Nordic countries rose significantly after the onset of the pandemic. The Faroe Islands, Greenland, Denmark and Norway have been the least affected in the Nordic Region. In Norway in 2020 and 2021, the unemployment rate was high relative to the Norwegian context, while still being low compared to the other Nordic countries. Increases in unemployment rates since the onset of the pandemic have been most pronounced in Åland and Iceland. It is worth noting, however, that only register data is available for Åland, and register data from the other Nordic countries, shows sharper increases in unemployment rates than the Labour Force Survey. Another effect of the pandemic is that the unemployment rate in Sweden has been increasingly higher than the EU27 average since the beginning of 2020, whereas it was lower than the EU27 average until mid-2019. In addition, the unemployment rate in Iceland was higher than the EU27 average at the beginning of 2021. In Finland, the unemployment rate was falling until early 2020, when it started to rise again above the EU27 average.
The unemployment rate in Sweden has seen the sharpest rise in the Nordic Region apart from Iceland and Åland. While the increase was relatively steep even in Finland, it is noteworthy that the unemployment rate never reached the high level it peaked at in 2015-2016, which was connected to the enduring weak economic situation and long-term effects of the financial crisis of 2008 (Kauhanen, 2017). The Icelandic economy is relatively undiversified and relies heavily on the tourism industry, which suspended a large part of its activities during the pandemic. This factor made the country’s labour market particularly vulnerable to external shocks (Cook and Jóhannesdóttir, 2021). In Denmark, the government launched Covid-19 passports based on comprehensive testing and vaccination as early as April 2021, which enabled the re-opening of certain businesses. The results of this initiative may be reflected in the country’s unemployment rate, which began to fall in early 2021 (Andersen et al., 2021). In general, many Danish economic activities were not particularly vulnerable to the effects of the pandemic, such as farming and green energy sectors (Bougroug et al., 2021). In Finland, Iceland and Norway, a similar bounce back towards lower unemployment rates did not occur until a bit later in 2021, and there was a steep fall in Sweden during the third and fourth quarters of 2021 (SCB, 2022). At least some of the lost job opportunities may return relatively quickly after the pandemic since many of the affected sectors are not in structural decline (e.g., tourism, the service sector). Instead, some of these sectors have been experiencing labour shortages during 2021 as many previous employees in these sectors have retrained and found more stable jobs in other sectors or in their home countries (e.g., in Poland or the Baltic states) as a direct consequence of the pandemic (Arbetsförmedlingen, 2022; Fjeldstad, 2021).
Employment and unemployment rates are indicators commonly used to measure the status of labour markets. The employment rate measures the proportion of the working age population (15-64 years old) who are employed, and the unemployment rate measures the proportion of the labour force (i.e., the total number of employed and unemployed people) who are not employed but are actively seeking jobs and available to work. The employment rate also covers employed people who work part-time or are temporarily off work. People who are employed or unemployed are considered economically active. Alternatively, members of the working age population who are neither employed nor looking for a job, are considered economically inactive, for instance, students and stay-at-home parents (Karlsdóttir et al., 2018; Grunfelder et al., 2020).
The Covid-19 crisis has had impact on both hidden unemployment and underemployment. Hidden unemployment refers to people outside the workforce who would like a job and are available for work within two weeks but have not been actively seeking work during the last four weeks. Underemployment refers to people who are employed but for less hours than they would ideally like. In Finland, for instance, the number of underemployed rose sharply in 2020, with many workers suffering from reduced working hours, lack of clients, or temporary layoffs (Leskinen, 2020; Taskinen, 2020; Taskinen, 2021). It is, therefore, important to also take into account data on furloughed (laid off temporarily) staff when quantifying the effects of the Covid-19 pandemic on the labour market (Juranek et al., 2021).
There are two sources for labour market statistics: the Labour Force Survey (LFS) and register data. The LFS is also the official source for labour market statistics, used, for example, as a measurement in national strategies. Although the LFS is one of the largest and most established surveys, the survey methodology still leads to limitations, for example, it is not possible to break down the data to a fine geographical level (below NUTS3). Register data, as the name suggests, is based on national registers using categories such as income and unemployment benefits. Since register data is based on individual data, it is possible to present it at a detailed geographical level. However, register data also has limitations. Differences in definitions make between-country comparisons difficult. Further, the unemployment numbers typically only include those who collect unemployment benefits, which does not include all unemployed people.
It has been argued that the LFS did not accurately measure all jobs that were lost during Covid-19 due to difficulties conducting surveys during the pandemic (e.g., OECD, 2020). According to Sánchez-Gassen and Penje (2021), this argument is not relevant in the Nordic Region as survey response rates were more stable during the pandemic compared to other European countries. Another factor to consider is that, according to the LFS, one is considered unemployed if they are actively seeking work during a given reference week (or have found a job with a start date within 3 months). Therefore, those who became unemployed during the pandemic but did not apply for jobs (due to infection risks or other reasons) were classified as 'inactive' instead of 'unemployed'.
In the European context, the unemployment rate was highest in Southern Europe in 2020, including Montenegro (17.9%), North Macedonia (16.4%), Greece (16.3%), Spain (15.5%), Turkey (13.2%) and Italy (9.2%). In these countries, the labour markets are also vulnerable because a large proportion of employees have temporary contracts within sectors that were severely affected by the pandemic, such as tourism (see also Fana et al., 2020). It is noteworthy that the unemployment rates in Sweden (8.3%) and Finland (7.8%) were also higher than the EU27 average (7.3%) in 2020. The other Nordic countries had unemployment rates below the EU27 average; Denmark (5.6%), Iceland (5.5%), Norway (4.4%), the Faroe Islands (1.8%) and Greenland (5.3%).
The impacts of the pandemic on the labour market should be understood in the context of the pre-existing situations in the different countries. Map 5.2 creates a typology of European regions by combining information on pre-pandemic unemployment rates with unemployment rates in 2020, based on the annual Labour Force Survey (LFS) that is measured in November. On one axis, the typology considers the extent of the change in the unemployment rate between 2019 and 2020. On the other axis, it considers whether the unemployment rate in 2020 was above or below the EU average of 7.3%. Regions are divided into four types based on whether the unemployment rate decreased or increased and how it relates to the EU average.
Regions falling into the first type, shown in red on the map, had an increase in the unemployment rate in 2020 as well as an above-average unemployment rate in general in 2020. These regions were most affected by the pandemic. They are mainly found in northern and central parts of Finland, southern and eastern Sweden, the capital area of Iceland, Latvia, Lithuania, Spain and central parts of France. Regions falling into the second type, shown in orange on the map, had an increase in the unemployment rate in 2020 but a below-average unemployment rate in general in 2020. These regions had low pre-pandemic unemployment rates and so were not as badly affected as the red regions, despite the rising unemployment rates. They are located in Denmark, Iceland, Norway, Åland, southern and western Finland, Sweden (Gotland, Jönköping, and Norrbotten), Estonia, Ireland, northern Portugal and central and eastern parts of Europe.
Regions falling into the third type, shown in blue on the map, had a decrease in the unemployment rate in 2020 as well as a below-average unemployment rate in general in 2020. Thus, these regions were the least affected by the pandemic. They include the Faroe Islands, Jämtland, Västerbotten, Trøndelag, Etelä-Pohjanmaa, and several regions in France, Italy and Poland. Regions falling into the fourth type, shown in purple on the map, had a decrease in the unemployment rate in 2020 but an above-average unemployment rate in general in 2020. The effect of the pandemic on the unemployment rate does not appear to have been as strong in these regions, perhaps due to the fact that unemployment rates were already relatively high before the pandemic. These regions include Dalarna, Kainuu, and several regions in France, Greece, Italy, North Macedonia and Serbia.

Map 5.2. Unemployment typology shows the unemployment rate in comparison to the EU average in 2020 and the change in the rate between 2019 and 2020.
Short-term layoffs as a means to mitigate labour market impacts
The effects of the Covid-19 pandemic on the labour markets have been unequal between the different countries and regions because of their differing economic structures, specialisation areas, labour market policies and mitigation measures. In the United States and the United Kingdom, for instance, more people became unemployed at the onset of the pandemic in comparison to countries that have established job retention schemes that provide income compensation to individuals and/or companies in the event of reduced working hours (Adams-Prassl et al., 2020; see also Economic Research, 2022). In the United States, however, there has also been a faster recovery compared to the Nordic countries in terms of the unemployment rate (Economic Research, 2022). Almost all of the Nordic countries introduced furlough schemes, albeit with quite different forms and scope. Some of the countries had a system for short-term layoffs in place before the pandemic, which made it possible for employers to retain their staff and for employees to keep their jobs during temporary economic challenges. In Finland, for instance, employers had a straightforward system for temporary layoffs, which was simplified even further after a state emergency was declared by the government. Consequently, the layoff schemes were expanded to cover even fixed-term employees, and the time limits on notice and negotiation of terms were shortened (Eduskunta, 2020; Kyyrä et al., 2021). In Norway, the existing furlough programme was made more accessible and generous as a result of the pandemic. In Sweden, a law regarding short-term employment has existed since 2014. During the pandemic, this law was extended to target companies that had economic difficulties due to the pandemic (Richter, 2021). In Denmark, a completely new short-time work compensation programme was introduced at the beginning of the pandemic (Juranek et al., 2021). Table 5.1 describes the main characteristics of the furlough schemes in Denmark, Finland, Norway and Sweden. There were also other measures to mitigate the effect on the labour market, including the relaxation of qualifications to unemployment benefits, sick leave and temporary allowances to take care of children (Greve et al., 2020).
| Introduction date | Accessibility | Implication for companies | Implication for employees | Salary cap | Total cost | |
| Denmark | 9 March 2020 | Companies that otherwise would have laid off 30% or more of the workforce | Government refunds 75% of the salaries that are paid to the retained workers | Are not allowed to work but keep their job and salaries | Maximum compensation of DKK 30,000 per month for a full-time employee | DKK 19 billion |
| Finland | Existed pre-pandemic and was made more accessible and generous | Companies that have financial or production-related reasons. Includes part-time furloughed employees. | Stops wage payments temporarily | Are not allowed to work, keep a valid employment contract with the employer, and are entitled to the same benefits as unemployed workers. | Compensation rate declines with the amount of previous full-time wage | n/a |
| Norway | Existed pre-pandemic and was made more accessible and generous on 20 March 2020 | Employees that have reduced working hours by at least 40%. | Stops wage payments temporarily | Are not allowed to work full-time, but the government reimburses the lost income. | 100% compensation up to NOK 31,000 per month for full-time employees. From day 21, 80% compensation for the part of income below NOK 25,000. | NOK 37 billion |
| Sweden | A law existed pre-pandemic and was made more accessible and generous on 16 March 2020 | Companies that faced temporary financial or production challenges due to the Covid-19 pandemic and that need to reduce their employees’ working hours up to a maximum of 80% (60% until May 1, 2020). | Provided financial support in the form of a short-time work allowance that reduces costs for an employee by around 70%. | Reduced working hours but retained more than 80% of original wage. | Maximum compensation of SEK 44,000 per month. | SEK 48.2 Billion |
Table 5.1. Characteristics of furlough schemes in Denmark, Finland, Norway and Sweden.
Source: Juranek et al., 2021.
According to Figure 5.2, the highest peak in the share of furloughed workers was in the period from April to May 2020 in Denmark, Finland, Norway and Sweden. In total, 9.3% of the Nordic workforce was furloughed in April 2020 and 9.1% in May 2020, after which the numbers started to fall in all of the countries. The highest share of furloughed employees was in Norway in March and April 2020 (10.8% in April 2020), but the numbers then fell quickly. In May 2020, the highest share of furloughed employees was in Sweden, and in June 2020, the highest share was in Denmark. There were other, nevertheless considerably lower, peaks in Denmark from January to February 2021, in Finland in December 2020 and in Norway in March 2021.
Figure 5.2. Monthly data on the proportion of employed population on furlough as percentage of total employment in the Nordic countries from January 2020 to September 2021.
Source: DK: Erhvervsstyrelsen FI: Statistics Finland; NO: NAV; SE: Tillväxtverket.
Map 5.3 shows the proportion of employe persons on furlough at municipal and regional levels in May 2020. According to the map, the highest proportion was in municipalities with a high proportion of people working in manufacturing, tourism and transport. These include the municipality of Sykkylven in Norway, which is home to several large furniture factories, the municipalities of Gnosjö and Oxelösund in Sweden, which both have multiple industries and a high proportion of employees working in manufacturing, and the municipality of Taipalsaari in Finland, which is close to a large paper mill. Municipalities with significant tourism and a high proportion of furloughed employees include Aurland, Hemsedal, Hol, and Trysil in Norway and Kittilä in Finland. The highly affected municipalities of Tårnby in Denmark and Härryda in Sweden are close to large airports, and in the municipality of Lemland in Finland, many people may work in the cruise industry. At regional level, the largest proportion of laid-off employees per 1,000 employed was in Oslo. All the other regions of Norway, all regions of Finland, and the regions of Halland, Jönköping, Kronoberg, Stockholm, Södermanland and Västra Götaland in Sweden and Hovedstaden in Denmark also had relatively high shares. The lowest proportions were found in the regions of Nordjylland and Sjælland in Denmark.
When comparing the proportion of furloughed employees between the Nordic countries, the considerable differences between the national furlough schemes, as shown in Table 5.1, need to be taken into account. For instance, in Finland and Norway, it was possible for employees to be part-time or fully furloughed, while in Denmark, only full-time furlough occurred, and in Sweden only part-time furlough occurred. In order to make furlough data more comparable between the Nordic countries, full-time equivalents were calculated for the furloughed employees in a study analysing the impacts of the pandemic on the labour market in the Nordic countries. When statistics for both unemployment and furlough schemes were taken into account, the study concluded that the negative impacts were most severe in Norway and Denmark, followed by Finland and Sweden, which performed slightly better (Juranek et al., 2021).

Map 5.3. The number of people laid off temporarily as a proportion of total employment, May 2020.
Unequal socio-economic and sectoral labour market effects
Compared to “traditional” economic crises that affect consumption and employment broadly, the corona crisis has had a highly selective impact on the labour market. Consequently, in the aftermath of the Covid-19 crisis, the biggest challenge for the Nordic countries may be to combat the greater inequalities caused by “skewed social and sectoral effects” of the pandemic (Alsos and Dølvik, 2021: 77).
Service industries, such as tourism, hospitality, travel, airlines, retail, culture, and leisure sectors, as well as the logistics and transport industry, have found closed borders, entry restrictions and quarantine rules particularly challenging. In addition, many occupations that have low work-from-home potential have been among the sectors to suffer most during the pandemic, e.g., hospitality, retail, personal services and transport (Ilsøe and Larsen, 2020; see also Byrne et al., 2020; Adrjan and Lydon, 2020). Table 5.2 shows the percentage changes in employment in various sectors at the national level between 2019 and 2020. In Denmark, Finland, Norway and Sweden, the accommodation and food services were clearly the sectors worst hit. In Iceland, real estate, transport and the arts were among those most affected.
| Percentage change in employment between 2019 and 2020 | ||||||||
| Nace code | Economic sector | DK | FI | IS | NO | SE | FO | GL* |
| A | Agriculture, forestry and fishing | -2,0 | -5,7 | -3,7 | 3,2 | 0,8 | 0,3 | -4,3 |
| BC | Mining and quarrying and Manufacturing | -1,7 | 0,0 | -1,0 | -0,6 | -2,0 | 0,0 | 5,6 |
| DE | Energy and water supply | 5,0 | 25,0 | 7,4 | 3,9 | 3,8 | 0,1 | -1,6 |
| F | Construction | 2,5 | -2,6 | -1,5 | 1,2 | 0,2 | 0,7 | 0,7 |
| G | Wholesale and retail trade | -0,4 | -5,9 | -5,1 | -0,3 | -1,5 | 0,3 | -2,2 |
| H | Transport | -5,5 | -6,3 | -18,9 | -4,2 | -5,5 | -0,7 | -3,6 |
| I | Accommodation and food service activities | -13,8 | -19,6 | -8,8 | -16,1 | -12,7 | -1,5 | -11,5 |
| J | Information and Communication | 0,4 | 5,7 | 12,0 | 2,4 | 0,4 | -0,1 | -5,9 |
| K | Financial and insurance | 0,7 | 5,2 | 4,5 | 2,8 | 2,2 | -0,1 | 11,2 |
| L | Real estate activities | 0,3 | 9,9 | -30,8 | -0,3 | 0,4 | 0,0 | 3,7 |
| MN | Professional, scientific and technical activities and administration | -1,0 | 3,0 | -8,0 | -5,2 | -2,8 | -0,1 | -4,2 |
| O | Public administration, defence and compulsory social security | 2,2 | 7,1 | 5,1 | 2,9 | 3,3 | 0,5 | 2,6 * |
| P | Education | -0,1 | 1,1 | -1,3 | 1,8 | -1,4 | 0,4 | n/a |
| Q | Human health and social work activities | 2,7 | -2,6 | 6,8 | 2,0 | -0,7 | 0,8 | n/a |
| RSTU | Arts etc. | -3,8 | -4,4 | -14,2 | -1,5 | -4,5 | 0,0 | -9,3 |
Table 5.2. Percentage change in employment by economic sector in the Nordic countries between 2019 and 2020.
Source: NSIs. Note: DK, NO, SE (register data), FI and IS (LFS).
* In GL, data on public sector (NACE code O) includes NACE P and Q.
Tourism, retail and culture employ many atypical workers on short-term or zero-hour contracts as well as freelancers and solo self-employed people, which makes it even more difficult to estimate the true impact of the pandemic (Ilsøe and Larsen, 2020). Not only did unemployment rise at the start of the pandemic, but job opportunities and job searches fell, particularly in those occupations most affected by the pandemic (Adrjan and Lydon, 2020; Forsythe et al., 2020). Some initiatives were taken to balance the sectoral effects of the pandemic. In Sweden, for instance, 300 furloughed flight attendants were offered a three-day tailor-made introductory course that allowed them to work as healthcare assistants and relieve regular healthcare workers (SVT Nyheter, 2021).
The pandemic has also had a disproportionate impact on employees already in precarious positions before it started (Nieuwenhuis and Yerkes, 2021). Those with little in the way of educational qualifications working in low-wage occupations in personal service and retail have been affected more than people with a higher education, who often work in sectors capable of more readily adapting to remote working. As many young adults and immigrants work in these sectors and have limited formal education, these groups were hit harder than older age groups and the native-born population (Ilsøe and Larsen, 2020; Hansen et al., 2021).
Figure 5.3 shows the unemployment rate by educational attainment level in 2019 and 2020. In all the Nordic countries, the increase in unemployment was most pronounced for people with lower secondary or below (ISCED 0–2) as their highest level of educational attainment. In particular, in Sweden and Finland, people with a low level of educational attainment seem to be in a precarious position, both when it comes to the unemployment rate in general as well as the impact of Covid-19 on the unemployment rate. For the EU27 average the pattern is different, with the unemployment rate increasing slightly more for people with upper secondary (ISCED 3–4) and tertiary education (ISCED 5–8) as their highest level of educational attainment.
Figure 5.3. Unemployment rate by level of educational attainment in the Nordic countries in 2019 and 2020.
Source: Eurostat.
Unemployment rates were higher among non-EU immigrants than for the native-born population and for immigrants from another EU country in both 2019 and 2020 (see Figure 5.4). While this was true in all countries, the gap was more pronounced in Sweden and Finland and less pronounced in Denmark, Iceland, and Norway. Sweden also experienced the highest increase in the unemployment rate for non-EU migrants between 2019 and 2020. In other words, people from non-EU backgrounds were more likely to become unemployed in the first year of the pandemic than those born in the EU or in the country in question. This was not the case in the other Nordic countries. In fact, in Iceland, Finland, and Norway, unemployment actually increased more among immigrants from EU27 countries than among non-EU migrants.
Figure 5.4. Unemployment rate by country of origin in the Nordic countries in 2019 and 2020.
Source: Eurostat.
Figure 5.5 presents the unemployment rate by age and gender in 2019 and 2020. The extent to which male and female employees aged 15-64 years old have been affected by the pandemic varies slightly between the Nordic countries. In Sweden (and in the EU27 on average), men were slightly harder hit by unemployment than women, while women were more affected in Denmark, Iceland and Finland. However, the gender differences seem to be quite marginal in the Nordic countries. Interestingly, the gender differences are more pronounced for young people aged 15-24 years old. In this age group, unemployment for men rose more than for women in Denmark, Finland, Norway and Sweden, whereas unemployment for men fell in Iceland. In Finland, for instance, many young women switched their status from employed to full-time student during 2020, while more young men than women ended up as unemployed or economically inactive (Sutela, 2021).
Figure 5.5. Unemployment rate by age and gender in the Nordic countries in 2019 and 2020.
Source: Eurostat.
Conclusions
Before the onset of the Covid-19 pandemic, the highest unemployment rates in the Nordic Region were in Finland and Sweden, particularly for immigrants born outside the EU27 countries, people with low levels of educational attainment, and young people aged 15-24. When examining changes in unemployment rates, it seems that Finland and Sweden have also been the countries most affected, followed by Iceland. However, when looking at the more long-term indicator of the employment rate, the changes are relatively small in the Nordic countries, with the exception of Iceland and perhaps Sweden and Finland. Particularly at the beginning of the pandemic and in the manufacturing, tourism and transport sectors, generous short-term furlough schemes played a crucial role in mitigating the effects of the pandemic on the labour market. The accommodation and food-service sectors were particularly affected in the Nordic countries, followed by transport and the arts. Especially in Sweden and Finland, the pandemic seems to have further exacerbated the precarious labour market position of the aforementioned vulnerable groups. While there are only small gender differences in Covid-19-driven changes in unemployment in the Nordic countries, the unemployment rate has gone up for young men more than for young women in Denmark, Finland, Norway and Sweden.
Compared to the economic crisis in 2008, both previous research and the latest statistics indicate that the labour market recovery is likely to be faster after the Covid-19 pandemic. However, it is recommended that attention is paid to particular risk factors in the Nordic Region. First, shortages of labour are emerging as an issue in some sectors and some regions. While some of this is due to the pandemic, several shortages started before the pandemic, for instance, in relation to the green and digital transitions. Second, the fact that the vulnerable groups such as young people, immigrants and people with low levels of educational attainment have been particularly affected by the impacts of the pandemic on the labour market – especially in Sweden and Finland – may further exacerbate inequality and socio-economic insecurity in the Nordic Region. If not addressed in a proper and timely manner, these risks may combine pose a threat to the Nordic welfare model in the near future.
References
Adams-Prassl, A., Boneva, T., Golin, M., and Rauh, C. (2020). Inequality in the impact of the coronavirus shock: Evidence from real time surveys. Journal of Public Economics, 189, 104245. https://doi.org/10.1016/j.jpubeco.2020.104245
Adrjan, P., and Lydon, R. (2020). Covid-19 and the global labour market: Impact on job postings. Economic Letter, 3.
Alsos, K., and Dølvik, J. E. (2021). The future of work in the Nordic countries: Opportunities and challenges for the Nordic working life models (TN2021:520). Nordic Council of Ministers, Copenhagen.
Andersen, T. M., Svarer, M., Iversen, A., Mølbak, K., and Lundgren, J. (2021). Videnspapir. Betydning af Covid-19 for samfundsøkonomien. Finansministeriet. Available at: https://fm.dk/media/25237/videnspapir-betydning-af-covid-19-for-samfundsoekonomien_a.pdf (accessed 3 February 2022)
Arbetsförmedlingen. (2022). Brist på arbetskraft trots hög arbetslöshet. Available at: https://arbetsformedlingen.se/om-oss/press/pressmeddelanden?id=25EB74E1D5318F03 (accessed 9 January 2022)
Barth, E., and Moene, K. O. (2012). Employment as a Price or a Prize of Equality: A Descriptive Analysis. Nordic Journal of Working Life Studies, 2(2), 5–33. https://doi.org/10.19154/njwls.v2i2.2355
Bougroug, A., Kragh Kjos, Ø, and Sletten, P. (2021). Økonomisk utvikling gjennom Covid-19: En sammenligning av utviklingen i Norge, Sverige og Danmark. Statistics Norway (Rapporter 2021/14). Available at: https://www.ssb.no/en/nasjonalregnskap-og-konjunkturer/artikler-og-publikasjoner/_attachment/450956?_ts=178ca845f00 (accessed 3 February 2022)
Byrne, S., Coates, D., Keenan, E., and McIndoe-Calder, T. (2020). The Initial Labour Market Impact of COVID-19. Economic Letter, 4.
Cook, D., and Jóhannsdóttir, L. (2021). Impacts, Systemic Risk and National Response Measures Concerning COVID-19—The Island Case Studies of Iceland and Greenland. Sustainability, 13(8470), 1-17. https://doi.org/10.3390/su13158470
Dincer, D., and Gocer, O. (2021). Quarantine Hotels: The Adaptation of Hotels for Quarantine Use in Australia. Buildings, 11(617), 1-17. https://doi.org/10.3390/buildings11120617
Economic Research. (2022). Unemployment Rate (UNRATE). Available at: https://fred.stlouisfed.org/series/UNRATE (accessed 9 January 2022)
Eduskunta. (2020). Regeringens proposition RP 26/2020 rd. Available at: https://finlex.fi/sv/esitykset/he/2020/20200026.pdf (accessed 14 February 2022)
Eurofond. (2022). Available at: https://www.eurofound.europa.eu/observatories/eurwork/industrial-relations-dictionary/atypical-work (accessed 8 January 2022)
European Institute for Gender Equality. (2022). Available at: https://eige.europa.eu/thesaurus/terms/1044 (accessed 8 January 2022)
Fana, M., Torrejón Pérez, S., and Fernández-Macías, E. (2020). Employment impact of Covid‑19 crisis: from short term effects to long terms prospects. Journal of Industrial and Business Economics, 47, 391–410. https://doi.org/10.1007/s40812-020-00168-5
Fjeldstad, Ø. (2021). Leder: Når en gladnyhet blir et problem. Available at: https://velferd.no/synspunkt/2021/nar-en-gladnyhet-blir-et-problem (accessed 14 February 2022)
Forsythe, E., Kahn, L. B., Lange, F., and Wiczer, D. (2020). Labor demand in the time of COVID-19: Evidence from vacancy postings and UI claims. Journal of Public Economics, 189, 104238. https://doi.org/10.1016/j.jpubeco.2020.104238
Greve, B., Blomquis, P., Hvinden, B., and van Gerven, M. (2020). Nordic welfare states—still standing or changed by the COVID-19 crisis? Social Policy and Administration, 55(2), 295-311. https://doi.org/10.1111/spol.12675
Grunfelder, J., Norlén, G., Randall, L., and Sánchez Gassen, N. (2020). State of the Nordic Region 2020. Nordic Council of Ministers, Copenhagen.
Hansen, M. E., Yding Sørensen, S., and Andersen. T. (2021). Analyse af udvikling og respons i nordiske arbejdsmarkeder som følge af COVID-19-pandemien. Teknologisk Institut, Aarhus.
Halvorsen, B. E. (2021). High and rising senior employment in the Nordic countries. European Journal of Workplace Innovation, 6(1-2), 130-146. https://doi.org/10.46364/ejwi.v6i2.817
ILO (2020). ILO Monitor: COVID-19 and the world of work. Second edition – Updated estimates and analysis. Available at: https://www.ilo.org/wcmsp5/groups/public/---dgreports/---dcomm/documents/briefingnote/wcms_740877.pdf (accessed 14 February 2022)
Ilsøe, A., and Larsen, T. P. (2020). The coronavirus crisis reveals blind spots in Nordic labour market data – A sociological perspective. Acta Sociologica, 63(4), 447–449. https://doi.org/10.1177/0001699320961817
Juranek, S., Paetzold, J., Winner, H., and Zoutman, F. (2021). Labor market effects of COVID-19 in Sweden and its neighbors: Evidence from administrative data. KYKLOS, International Review for Social Sciences, 74(4), 512-526. https://doi.org/10.1111/kykl.12282
Karlsdóttir, A., Randall, L., and Norlén, G. (2018). Towards inclusive Nordic labour markets. In J. Grunfelder, L. Rispling, and G. Norlén (Eds.), State of the Nordic Region 2018 (pp. 74–86). Nordic Council of Ministers, Copenhagen.
Kauhanen, M. (2017). Työllisyys ja työttömyys – Miten suomalaiset työmarkkinat ovat muuttuneet? In H. Taimio (Ed.), Tuotannon Tekijät: Palkansaajien Suomi 100 vuotta (pp. 152-189). Palkansaajien tutkimuslaitos, Helsinki.
Kyyrä, T., Pirttilä, J., and Ravaska, T. (2021). The Corona Crisis and Household Income: The Case of a Generous Welfare State (VATT Mimeo 61, pp. 1-22). VATT Institute for Economic Research, Helsinki. https://urn.fi/URN:ISBN:978-952-274-271-1
Leskinen, T. (2020). Piilotyöttömyys ja alityöllisyys ennätyslukemiin, työllisyys vähentynyt osa-aikatyössä. Available at: https://www.stat.fi/tietotrendit/blogit/2020/piilotyottomyys-ja-alityollisyys-ennatyslukemiin-tyollisyys-vahentynyt-osa-aikatyossa/ (accessed 14 February 2022)
Lind, Y., and Gunnarsson, Å. (2021). Gender Equality, Taxation, and the COVID-19 Recovery: A Study of Sweden and Denmark. Tax Notes International, 101(5), 581-590. https://ssrn.com/abstract=3795117
Lundgren, A., and Randall, L. (2020). Concluding discussion. In A. Lundgren, L. Randall, and G. Norlén (Eds.), State of the Nordic Region 2020: Wellbeing, health and digitalisation edition (pp. 66–70). Nordic Council of Ministers, Copenhagen.
Lundgren, A., Randall, L., and Norlén, G. (2020). State of the Nordic Region 2020: Wellbeing, health and digitalisation edition. Nordic Council of Ministers, Copenhagen.
Nieuwenhuis, R., and Yerkes, M. A. (2021). Workers’ well-being in the context of the first year of the COVID-19 pandemic. Community, Work and Family, 24(2), 226-235. 10.1080/13668803.2021.1880049
Norlén, G. (2018). Employment: Labour force participation and productivity of Nordic labour markets. In J. Grunfelder, L. Rispling, and G. Norlén (Eds.), State of the Nordic Region 2018 (pp. 62-72). Nordic Council of Ministers, Copenhagen.
OECD. (2020). OECD employment outlook 2020: Worker security and the COVID-19 crisis. OECD Publishing; Paris. https://doi.org/10.1787/1686c758-en
Richter, A. (2021). Lagen om stöd vid korttidsarbete före och efter pandemin: The changes regarding the swedish furlough system due to the pandemic (Examensarbete i civilrätt, särskilt arbetsrätt). Uppsala universitet. Available at: https://uu.diva-portal.org/smash/get/diva2:1577100/FULLTEXT01.pdf (accessed 14 February 2022)
Sánchez Gassen, N., and Penje, O. (2021). Chapter 1: Effects of the COVID-19 pandemic on the labour market integration of immigrants in the Nordic countries. In N. Sánchez Gassen, O. Penje, B. Bratsberg, O. Raaum, K. Roed, P. Skedinger, and O. Åslund (Eds.), Integrating Immigrants into the Nordic Labour Markets: The impact of the COVID-19 pandemic (pp. 8-43). Nordic Council of Ministers, Copenhagen.
SCB. (2022). Arbetskraftsundersökningarna (AKU), fjärde kvartalet 2021: Arbetslösheten minskar bland både inrikes och utrikes födda. Available at: https://www.scb.se/hitta-statistik/statistik-efter-amne/arbetsmarknad/arbetskraftsundersokningar/arbetskraftsundersokningarna-aku/pong/statistiknyhet/arbetskraftsundersokningarna-aku-fjarde-kvartalet-2021/ (accessed 15 February 2022)
Schoukens, P., and Barrio, A. (2017). The changing concept of work: When does typical work become atypical? European Labour Law Journal, 8(4) 306–332. https://doi.org/10.1177/2031952517743871
Sutela, H. (2021). Koronan satoa: nuoret naiset opiskelevat, miehet enemmän työttöminä. Available at: https://www.stat.fi/tietotrendit/blogit/2021/koronan-satoa-nuoret-naiset-opiskelevat-miehet-enemman-tyottomina/ (accessed 14 February 2022)
SVT Nyheter. (2021). SAS-personal stöttade vården under pandemin. Available at: https://www.svt.se/nyheter/inrikes/sas-personal-stottade-varden-under-pandemin (accessed 26 October 2021)
Taskinen, P. (2020). COVID-19-oireet ilmeisiä työmarkkinoilla, vaikka virallinen työttömyysaste ei vielä nousekaan. Available at: https://stat.fi/tietotrendit/blogit/2020/covid-19-oireet-ilmeisia-tyomarkkinoilla-vaikka-virallinen-tyottomyysaste-ei-viela-nousekaan/ (accessed 14 February 2022)
Taskinen, P. (2021). Työn puute on lisääntynyt niin Suomessa kuin muuallakin. Available at: https://www.stat.fi/tietotrendit/artikkelit/2021/tyon-puute-on-lisaantynyt-niin-suomessa-kuin-muuallakin/ (accessed 14 February 2022)
The New York Times. (2021). How the World Ran Out of Everything. Global shortages of many goods reflect the disruption of the pandemic combined with decades of companies limiting their inventories. Available at: https://www.nytimes.com/2021/06/01/business/coronavirus-global-shortages.html (accessed 14 February 2022)
TIME. (2020). ’A Chance To Do Our Part.’ How This Family-Owned Distillery Switched From Whiskey to Hand Sanitizer Amid the COVID-19 Crisis. Available at: https://time.com/5817460/coronavirus-distillery-hand-sanitizer/ (accessed 14 February 2022)
6. Labour market mobility between the Nordic countries
Authors: Anna Lundgren and Mari Wøien Meijer
Maps and graphs: Gustaf Norlén and Anna Vasilevskaya

The Covid-19 pandemic has had serious implications for labour markets and labour market mobility. The imposition of border restrictions has had a severe impact on cross-border mobility as well. The comprehensive Nordic Future of Work project, which ended in 2021, concludes that the effects of Covid-19 can be seen in many different areas, and in the long term, the effects may be both positive and negative for Nordic labour markets (Alsos & Dølvik, 2021). The economic effects of Covid-19 and its general impact on Nordic labour markets are described in greater detail in Chapter 5.
Despite the many similarities between the Nordic countries' strategies to deal with economic crises, it is still too early to ascertain the pace of recovery and the long-term effects of the Covid-19 pandemic. Important elements on the path of recovery include prioritising full employment, the organisation of the labour market systems building on tripartite collaboration with social partners and economic cyclical policy measures to reduce negative economic effects, as well as compensatory measures to industries, firms, and labour (Alsos & Dølvik, 2021; Hilson, 2008). Even though all parts of the economy have been affected by the pandemic, sectors like transport, tourism and hospitality have been particularly hard hit. Generally, restrictions during the pandemic have focused on reducing interaction and advocating social distancing, further amplifying the negative effects in these sectors. For a period, cross-border travel and tourism diminished substantially or, in some cases, ceased completely (see Chapter 10).
Since the establishment of the Common Nordic Labour Market in the 1950s, it is estimated that more than one million people have relocated between the countries (Korkiasaari & Söderling, 2003). Roughly 40,000 people move from one Nordic country to another every year (Nordic Statistics database, 2020). The crude migration intensity in Nordic populations is the highest in Europe, and between 13% and 16% of the Nordic population change residency within or between Nordic countries annually (Heleniak, 2020). However, the long history of Nordic mobility levels was reversed in 2020–2021, when the Covid-19 pandemic led most of the Nordic countries to implement strict travel and border restrictions (Wøien Meijer & Giacometti, 2021), and we have yet to see what the long-term, post-pandemic repercussions will be of these restrictions on Nordic labour market mobility.
In this chapter, we investigate labour market mobility between the Nordic countries and include both commuting and migration, in other words, those people who commute to a job in a different Nordic country or move to take up a job in a different Nordic country. While migration patterns are described in greater detail in Chapter 4, we will focus on labour market mobility and the impact of the Covid-19 pandemic on intra-Nordic labour market mobility.
Labour market mobility can be either occupational or geographical. It refers to the movement of workers between occupations or employers or between geographic locations within a country (International Labour Organization, 2017; International Organization for Migration, 2019).
Whereas mobility is a generic term covering all different forms of movements of people, migration refers to change of residence, and commuting refers to a daily, weekly, or regular travel to work or studies in another municipality, region, or country.
A common definition of a migrant is a person that changes place of residence either by moving to another country (international migration) or within a country (internal migration) irrespective of the causes (International Organization for Migration, 2019; European Commission n.d.). Migration can be permanent or temporary. International migration statistics usually refer to permanent migration. Temporary migration (also called short-term migration) is used to describe the movement of individuals who change their country of residence to work in another country for 3–12 months (European Commission, n.d.).
Migrant workers are people with jobs in a country of which they are not citizens. The term labour migrants is used interchangeably with migrant workers and refers to people who migrate with the specific purpose of finding work (European Commission, n.d.; ILO, 2017). In international literature, the term foreign migrant workers usually refer to people admitted into the receiving state for what is usually a restricted length of stay and for a specific type of employment (e.g., seasonal workers) (OECD, 2003; "ILO 2017").
In an EU context, the term cross-border workers refer to a person who works as an employee or self-employed person in one EU Member State but is a resident of another (neighbouring) EU Member State (European Commission, n.d.). This is the group that commutes on a daily, weekly or regular basis across borders to another country.
Intra-Nordic labour market mobility is thus composed of both people commuting and moving to jobs in another Nordic country.
Covid-19 effects on labour market commuting in the Nordic Region
The Covid-19 pandemic entailed a new reality of 'working from home'. For people in certain occupations, for example, in transport, sales, tourism, hospitality or industry, working from home was not always an option. Some employees in these sectors work across borders and were, therefore, greatly affected by restrictions, which made cross-border commuting increasingly cumbersome.
In this section, we delve into the effects Covid-19 restrictions had on labour market mobility between Q1 2020 and Q4 2021.

Map 6.1. Percentage change for work mobility in Nordic regions and municipalities compared to a pre-pandemic baseline.
Map 6.1 compares Nordic mobility patterns in each quarter of 2020 and 2021 with a pre-pandemic baseline. Based on Google data, the panels illustrate the impact of national restrictions and how those restrictions hampered work mobility. As the restrictions were both national and regional in nature, some regions and municipalities were more affected than others.
Figure 6.1. Percentage changes in work mobility per country 2020–2021.
Source: Google mobility data.
Based on the same Google data as in Map 6.1, Figure 6.1 shows the change in mobility from Q1 of 2020 until Q4 of 2021. The graph shows that the Nordic countries share a similar pattern. However, at the beginning of the pandemic, the decrease in work mobility was less pronounced in Sweden than in the other countries. The percentage of change in work mobility demonstrates the role of regulations restricting mobility regionally, nationally and across national borders. On average over the 2-year period, the decrease in mobility was -23%, with Norway at -24%, Finland -24%, Sweden -23% and Denmark -22%. The restrictions imposed by national governments in the respective countries were based on national and international infection rates, as well as the ability of the individual countries to cope with the hospitalisation of those severely affected by Covid-19.
One of the national governments' approaches to the pandemic was to differentiate between regions based on regional infection rates. This often resulted in regions with larger cities such as Gothenburg (Västra Götaland), Stockholm (Stockholm), and Karlstad (Värmland), being classified "red",[1]EU ’traffic light system’ for restriction of free movement during the COVID-19 pandemic (European Commission, 2020). which led to more stringent restrictions due to the higher infection rates in these cities. This ultimately also impacted areas within these regions with lower infection rates, including border areas. This was the case, for example, in the border areas of Värmland and Västra Götaland in Sweden (see, e.g., Dagens Nyheter, 2021). Although this national approach did consider inter-regional differences, the municipal level remained largely absent from the conversation (see, e.g., Aftenposten, 2020).
The darker areas in Map 6.1 show that work mobility decreased the most in Q2 2020 and in Q3 2021. The panels also show that mobility decreased later in Sweden than in the other Nordic countries. However, the decrease in Q3 in both 2020 and 2021 may partly be explained by the holiday months, when work mobility tends to decrease anyway. In Q4 2021, when many of the restrictions were lifted, the work mobility increased in many municipalities, although the pattern is mixed. In a few municipalities the situation is almost back to the pre-pandemic baseline while in most municipalities, there is still less mobility in the labour market compared to the pre-pandemic situation.
The differences may also be due to the relative role of different sectors in different regions and municipalities. This may also explain the large fall in work mobility in the capital regions, where many people working in knowledge-intensive private and public sectors were able to work remotely. The biggest reductions in work mobility over the period are found in municipalities within the greater metropolitan areas, such as Danderyd and Lomma in Sweden, and Nittedal in Norway.
Cross-border areas with high labour mobility, such as Øresund between Denmark and Sweden, Svinesund on the Swedish-Norwegian border and Tornedalen between Sweden and Finland, experienced unique impediments to their standard mobility patterns. The severity of travel restrictions, different national legislation governing furlough schemes and working conditions, policies regarding social distancing, and the status of cross-border commuters changed during the pandemic. However, in some places, for example in Sweden and Denmark, commuters were allowed to cross the border throughout the pandemic. Nevertheless, the number of documents required, lack of information and differences between test regimes deterred many from travelling to work (Creutz et al., 2021; Wøien Meijer, 2022). Frustration with the general uncertainty that followed border restrictions was also reflected in the surveys conducted by the Freedom of Movement Secretariat in June 2020 and December 2020 (Nordiskt Samarbete, 2020a; 2020b).
Footnotes
- ^ undefined
Effects of Covid-19 on cross-border passenger traffic
The statistics for passenger traffic using various modes of transport reveal a significant decline in cross-border mobility. Both air traffic and ferry traffic saw a dramatic decline in numbers of passengers, and there was also full international air border closure from late in Q1 2020 until late in Q2 2020 (Gordon et al., 2021). The dramatic drop in air traffic was also observable in the Nordic international airports. Figures from April 2021 show a slow recovery to pre-pandemic numbers of passengers between international airports in the Nordic Region (Figure 6.2).
Figure 6.2. Number of passengers between international airports in the Nordic Region.
Source: Eurostat.
Figure 6.2 compares the total number of passengers and the distribution of Nordic passengers among main Nordic airports in April 2019, 2020, and 2021. The size of the circles indicates the total number of passengers. The effects of the pandemic on international mobility became apparent in April 2020. The figure shows the sharp decline from 2019 to 2020 as well as the slow recovery in 2021.
Islands dependent on ferry connections, such as Åland and Bornholm, are unique and interesting cases. In Åland, the ferry link is the main transport option to and from Finland and Sweden. It is also a major employer. Between 2019 and 2020, the number of incoming passengers from Sweden to Åland plummeted from 1.7 million to 0.5 million passengers (Ålands statistik- och utredningsbyrå, 2022). For some months, only freight (no passengers) was allowed on the ferries to and from Sweden (Ålands statistik- och utredningsbyrå, 2021). The Danish island Bornholm found itself cut off from the rest of Denmark for a short period when travellers could no longer travel through Swedish territory (Creutz et al., 2021). Bornholm is part of the Danish Capital Region.
In cross-border regions such as Øresund, passenger traffic fell dramatically, both in trains and vehicles (see Figures 6.3 and 6.4; Nordregio calculations based on Statistics Denmark and Øresundsbron). The effects of summer holiday patterns show up in a slight increase in coaches, cars, and motorcycles during these months, while freight transport remained stable or even rose.
Figure 6.3. Øresund train passengers 2019-2021.
Source: Statistics Denmark.
Figure 6.4. Total number of vehicles crossing the Øresund bridge 2019-2021.
Source: Øresundsbron.
Note: Trucks include vans from 6 m.
According to research literature, cross-border areas can benefit from larger labour markets that boost economic growth, act as a buffer to counteract cyclical differences between the national economies, guarantee the supply of labour and prevent unemployment (Ho & Shirono, 2015). Cultural, linguistic and institutional similarities between the Nordic countries, for example education systems, welfare, and labour-market systems, also help facilitate cross-border mobility (Shuttleworth, Östh & Niedomysl, 2019). Migration patterns are often described in terms of push and pull factors, such as those related to cyclical and structural rationales, for example job opportunities and differences in wage levels.
Despite these positive aspects of Nordic mobility, data collated by Info Norden shows evidence of severe barriers to cross-border mobility. The Nordic Freedom of Movement Council has been studying and encouraging the removal of such barriers since 2014. During the pandemic, the council intensified its effort to remove barriers related to Covid-19 (Creutz et al., 2021; Wøien Meijer, 2022). In the literature, barriers to cross-border mobility are described as both formal and informal (Bjuggren & Eklund, 2012). Whereas formal barriers include legislation and policy-related barriers such as taxation, labour law and social policies, informal barriers can include language, norms, values, and culture that can also be harder to remove or change (Øresundsinstituttet, 2021). The importance of symbolic actions and investments support cross-border mobility, such as the Øresund Bridge, should not be overlooked.
The Øresund and greater Copenhagen area has a population of around 4 million. Since the Øresund Bridge opened in 2000, it has been easier to work on the other side of the sound. The common labour market was also the result of active political determination in Denmark and Sweden to join forces. The border restrictions due to Covid-19 were perhaps the strictest and most all-encompassing measures taken since the end of the World War II. They primarily affected private individuals and families in terms of social contact, as commuters were still, by and large, able to travel to cross the borders. However, the recommendation was to work from home. Stories of differing approaches to the restrictions also emerged, as Swedish and Danish employees were treated differently depending on where they lived, and tax issues caused significant stress. The longer commuting time, different test regimes and rules regarding documentation were also difficult for commuters.
Norway and Sweden share the longest border in Europe, and it is, incidentally, the border that has had some of the most enduring and stringent restrictions in Europe during the pandemic. Busy border crossings such as Svinesund, Ørje–Årjäng and Morokulien saw a dramatic decline in vehicle traffic. The labour market in these areas is also very much a cross-border one. The initial uncertainties that arose with the closing of the border led some companies to offer their Swedish employees hotel rooms while the company figured out the extent of the regulations. Others were prevented from travelling to work altogether, and as their jobs were in Norway, the regulations led to uncertainty about their eligibility for furlough schemes. A special solution for EEA citizens eventually overcame this problem, and they were reimbursed retroactively. Exemptions were made for Swedish residents who were working in critical jobs (e.g., nurses) relatively early on. Contrarily, Norwegians working in Sweden were able to travel to Sweden throughout the pandemic; however, Norwegian national regulations applied to anyone leaving Norway, meaning Norwegian cross-border commuters had to quarantine upon their return to Norway after a working day or week in Sweden. This policy disabled some Norwegian cross-border commuters from seeing family and friends or picking up their children from kindergarten. The differences in infection suppression measures and regulations between Sweden and Norway also had psychological effects. Stories of bullying in the workplace might have contributed to damaging trust between people and towards governments.
Tornedalen takes its name from the Torne River, the physical border between Sweden and Finland in the north. People in this area have worked, traded, and lived together for centuries: the river was an enabler, not an obstacle, to cross-border living. Sweden and Finland adopted different strategies for curbing the infection rates following the pandemic, some of which were quite visual in nature. These included the border fence erected in the middle of Victoria Square in the twin-cities of Haparanda and Tornio: an area that shared certain public services was suddenly divided. People who normally would walk across the square to the nearest photo shop to have their photo taken had to drive 260 km roundtrip to Luleå to complete their errand. The tone between people became harsher, and stories emerged of cars being vandalised, and children being prevented from attending school due to missing ID cards. The tourism sector in Lapland, Finland, is a magnet for workers from Sweden, but it was also hard hit by the pandemic.
Cross-border areas benefit from the border aspect of their regions. Whether peripheral or central, the border has, served as a symbol for opportunity. The invisibility of the border also supported the vision of an increasingly integrated Nordic Region towards which the countries have been working ever since the agreement on a common Nordic labour market in 1954 and the introduction of the Nordic Passport Union in 1952.
Source: Wøien Meijer (2022); Giacometti & Wøien Meijer (2021); Creutz et al., (2021)
Labour market commuting in the Nordics
Map 6.2 illustrates the average share of employees who participated in cross-border commuting between 2015 and 2018 in Nordic regions (NUTS 2). Between 2015 and 2018, an average of approximately 49,000 people held a job in a Nordic country in which they were not residents. This indicates that, on average, 0.5% of the Nordic working-age population commuted to a job in another Nordic country. This is below the EU27 average of 1%, with the highest numbers found in Slovakia (5.1%), Luxembourg (2.8%) and Estonia (2.6%; Eurostat, 2016). Some of these people cross borders daily. Others work in another country by means of remote working combined with occasional commuting across borders (Brun et al., 2021).

Map 6.2. Cross-border commuting as a share of total employment 2015–2018 average.
Within the Nordic Region, the largest cross-border commuter flows are in the southernmost parts of Sweden, regions in the middle of Sweden and in Åland, where more than 1% of the working population commutes to another Nordic country. However, there may be individual municipalities where cross-border commuting is substantially higher. For example, the employment rate in Årjäng Municipality, Sweden, increases by 15 percentage points when cross-border commuting is taken into account (State of the Nordic Region, 2016). These municipalities are not reflected on NUTS 2 level when averages are calculated. In terms of absolute numbers in 2015, the highest numbers of commuters were from Sweden: Sydsverige (16,543), Västsverige (7,899) and Norra Mellansverige (6,890). The highest number of commuters from a non-Swedish region were from Denmark’s Hovedstaden (2,583).
Unfortunately, due to legislative barriers regarding the exchange of statistical data on cross-border commuting between the Nordic countries, more recent data is not available.
Labour market migration in the Nordic Region
Labour market mobility between the Nordic countries relates to both commuting and migration. This section looks at labour market migration between the countries.
In 2020, a total of 458,000 Nordic citizens, or 1.7% of a population of approximately 27.2 million, lived in a different Nordic country from the one in which they were born. These population figures have remained relatively stable since 1990, except for a slight increase in Denmark and Norway. In Sweden, however, the share of the population born in other Nordic countries has dropped by three percentage points. This may be due to the large number of people migrating to Sweden from Finland in the 1960s and 1970s.
When examining migration patterns within the Nordic Region, we find that proximity, shared language, and territorial history seem to play a role. For example, in the Faroe Islands and Greenland, most of the working-age population who were born in a different Nordic country were born in Denmark. This is also the case in Iceland. In Finland and Norway, the largest group comes from Sweden, and in Sweden, the majority were born in Finland. In Denmark, the working-age population born within the Nordic Region but outside of Denmark is more evenly distributed, with comparable numbers born in Sweden, Greenland and Norway (see Figure 6.5).
Figure 6.5. Foreign-born, working-age population (15-64 years old) by country of birth 2021.
Source: Nordic Statistics.
Note: For Iceland and Greenland, the data is from 1 January 2020.
Nordic labour market migration has different significance between the different countries and territories (see Figure 6.6). While the share of the working-age population born in another Nordic country has steadily decreased in Greenland since 1990, the share in Åland and the Faroe Islands has shown the opposite pattern over the last 2 decades.
Figure 6.6. Nordic foreign-born, working-age population (15-64 years old) in the Nordic countries 1990-2021.
Source: Nordic Statistics.
Map 6.3 shows the largest Nordic-born minority group at the municipal level among the working-age population (15-64 years old). The intensity of the colour shows the share of the total foreign-born Nordic population, with darker tints indicating a larger percentage than lighter tints. The map illustrates differences at the regional and municipal levels within the countries. For example, while the largest minority in Norway are born in Sweden, those born in Denmark constitute the largest Nordic minority in the southern Norwegian region of Agder. The largest Nordic-born minority in Denmark are those born in Sweden in absolute numbers and in the capital region of Hovedstaden, while the largest Nordic minority in all other Danish regions is from Greenland. In Sweden, the largest Nordic-born minority overall are from Finland, but there are also regional differences here: in the regions of Skåne, Halland and Kronoberg, the largest Nordic minority group come from Denmark, and in Värmland and Jämtland-Härjedalen, the largest is Norwegian born.
In the cross-border municipalities, this pattern is even more accentuated and made evident in areas such as Haparanda in Sweden (the twin city of Tornio in Finland) where 26.5% of the population is Finnish born. Åland has the highest share of other Nordic nationals, where, for example, 47% of the population in the municipality of Kökar is born in a different Nordic country (including Finnish born). Excluding the municipalities of Åland, Haparanda is the municipality in which Nordic-born minorities make up the highest percentage of the total working-age population.

Map 6.3. Largest Nordic minority group as share of working-age population 2021.
Conclusions
Covid-19 border restrictions significantly impacted Nordic labour market mobility as people were encouraged to work from home if possible and take precautions when travelling. From the beginning of 2020 to the end of 2021, labour market mobility decreased by 23% on average. Though work mobility decreased in all Nordic regions and municipalities, this change happened at different degrees and during the different phases of the pandemic. Some municipalities and regions were more severely affected than others, and particularly affected were cross-border areas and islands where different Nordic approaches to handle infection rates and frustration with emerging border obstacles grew. The largest change in labour market mobility during this two-year period is found in municipalities in metropolitan areas while, those least influenced by reduced labour market mobility are found in the rural areas, which indicates that some jobs are more easily conducted remotely than others. The reduced mobility in the Nordic region is also seen in the figures of passenger transport (i.e., road, air, and train) which have diminished as well during the pandemic.
Labour market mobility is composed of both labour market commuting (i.e., travel to a job) and labour market migration (i.e., relocating for a job). Data on commuting patterns between the Nordic countries is scarce, but figures from 2015-2018 indicate that 0.5% of the Nordic population commute to a job in another Nordic country. These figures are low compared to international commuting numbers, even though individual regions and municipalities present higher figures
When it comes to labour market migration (i.e., moving for a job), people in the Nordic Region seem more prone to move to a different region or to a different Nordic country compared to people in other international regions (Heleniak, 2020). However, this data does not distinguish between moving within or outside the country of origin.
When moving to a different Nordic country we find a general pattern: The majority of Nordic working-age migrants in Sweden and Åland come from Finland; the largest Nordic minority group in Finland and Norway are from Sweden; people born in Greenland are the most common Nordic minority group in most Danish regions, but in absolute numbers, they are outnumbered by those coming from Sweden; and the biggest group of Nordic migrants in Iceland, Greenland, and the Faroe Islands come from Denmark. However, at a regional and municipal level, we find a more diverse pattern reflecting proximity, linguistic similarities, culture, and historical bonds. The data also shows that labour market migration from other Nordic countries plays a more significant role in the labour markets in Greenland, the Faroe Islands, and Åland than in the Nordic countries.
The restrictions imposed during the Covid-19 pandemic have severely affected labour market mobility in the Nordic Region. In cross-border regions, people additionally experienced barriers to school attendance, everyday errands, and the use of shared public services. Restrictions also complicated major life events, for example, attending weddings and funerals across national borders. Border fences among the Nordic countries became visible for the first time since World War II.
Both employers and employees faced issues related to the function of the labour market, for example, legislative and regulatory issues regarding tax rules, social security, and work environment. These cross-border concerns during the pandemic reveal weaknesses to labour market mobility. Several megatrends are expected to impact Nordic labour markets in the coming years, such as ageing populations, digitalisation, and challenges with achieving the green transition (Dølvik & Steen, 2018). These megatrends, as well as the labour market mobility issues, needs to be resolved.
The future of Nordic labour market depends on market conditions and responses to structural changes in the labour market. However, it also depends on Nordic governments’ ability to address barriers to labour market mobility and their ability to sustain and increase the attraction of working in another Nordic region or municipality. Neglecting these issues may deter individuals from taking new jobs that require migrating or commuting across national borders (see, e.g., NRK 2021). Whether or not Nordic countries are able to respond to existing and impending cross-border challenges will have consequences on achieving the Nordic vision to be the most integrated region in the world by 2030.
References
Aftenposten (2020) UD vil ikke gå inn for særordning for kriserammede Strömstad. NTB-TT. November 12th, 2020. Retrieved from: https://www.aftenposten.no/verden/i/oAAJ9g/ud-vil-ikke-gaa-inn-for-saerordning-for-kriserammede-stromstad (Accessed: September 29th, 2021)
Alsos, K. & Dølvik, J.E. (2021) (Eds). The future of work in the Nordic countries: Opportunities and challenges for the Nordic working life models. Nordic Council of Ministers.
Bjuggren, P., & Eklund, J. (2012). Barriärer för utveckling: Transaktionskostnader i Öresundregionen. Handelskammaren.
Brun, N., Ekmark, S., Munch Haagensen, K., & Harðarson, Ó. (2021). Nordic Council of Ministers. Retrieved from Nordic Cross-border Statistics: The results of the Nordic Mobility project 2016-2020.
Creutz, K., Berglund, S., Betül Karacan, T., Giacometti, A., Haugevik, K., Nyberg Sørensen, N., Wøien Meijer, M., & Lares, A. (2021). Nordic Cooperation amid Pandemic Travel Restrictions FIIA. FIIA – Finnish Institute of International Affairs. https://www.fiia.fi/en/publication/nordic-cooperation-amid-pandemic-travel-restrictions
Dagens Nyheter (2021) 106 smittade i Värmland efter tantrafestival – Norge skärper inreseregler. August 13th, 2021. Retrieved from: https://www.dn.se/sverige/106-smittade-i-varmland-efter-tantrafestival-norge-skarper-inreseregler/ (Accessed: November 23rd, 2021)
Dølvik, J.E & Steen, J.R (2018). The Nordic future of work. Drivers, institutions and politics. Nordic Council of Ministers.
European Commission (n.d.). Migration and Home Affairs. Retrieved from EMN Glossary Search: https://ec.europa.eu/home-affairs/what-we-do/networks/european_migration_network/glossary_search/cross-border-worker_en
European Commission (2020) Coronavirus pandemic. A common approach to measures restricting free movement in the EU. Available: https://ec.europa.eu/info/sites/default/files/factsheet_-_coronavirus_-_a_coordinated_approach_to_measures_restricting_free_movement_in_the_eu.pdf
Eurostat (2016), Statistics on commuting patterns at regional level. https://ec.europa.eu/eurostat/statistics-explained/index.php?title=Statistics_on_commuting_patterns_at_regional_level&oldid=303997
Eurostat (2019,2020,2021) https://ec.europa.eu/eurostattransport/data/database
Korkiasaari, J., & Söderling, I. (2003). Finnish Emigration and Immigration after World War II. Siirtolaisinstituutti.
Heleniak, T. (2020). Migration and mobility: more diverse, more urban. In J. Grunfelder, G. Norlén, L. Randall, & N. Sánchez Gassen. Nordic Council of Ministers
Hilson, Mary M. (2008). The Nordic model. Scandinavia since 1945. London: Reaktion Books Ltd
Ho, G. & Shirono, K. (2015), The Nordic Labour Market and Migration, IMF, https://www.imf.org/en/Publications/WP/Issues/2016/12/31/The-Nordic-Labor-Market-and-Migration-43441
International Labour Organization. (2017). Retrieved from Media-Friendly Glossary on Migration: Middle East Edition: https://www.ilo.org/beirut/projects/fairway/WCMS_552778/lang--en/index.htm
International Organization for Migration (2019), https://www.iom.int/about-migration
Nordic Statistics database. (2020). Retrieved from Who goes where in the Nordic region?: https://www.nordicstatistics.org/who-goes-where-in-the-nordic-region/
Nordiskt Samarbete (2020a) Covid-19 skapar frustration och förvirring bland boende i gränsregioner. Retrieved from: https://www.norden.org/sv/nyhet/covid-19-skapar-frustration-och-forvirring-bland-boende-i-gransregioner
Nordisk Samarbete (2020b) Gränsregioner drabbas – nio av tio upplever ökad oro av coronarestriktioner. Retrieved from: https://www.norden.org/sv/nyhet/gransregioner-drabbas-nio-av-tio-upplever-okad-oro-av-coronarestriktioner
NRK (2021) Svenskene svikter Norge – krise i restaurantbransjen. November 3rd, 2021. Retrieved from: https://www.nrk.no/innlandet/svenskene-svikter-norge-og-gir-krise-for-restaurant-og-servicenaeringen-1.15713466
OECD. (2003). OECD. Retrieved from Glossary of Statistical Terms: https://stats.oecd.org/glossary/detail.asp?ID=1047
State of the Nordic Region (2016) Theme 2: Labour Force. Chapter 5 Employment. Nordregio Report, ISSN 1403-2503; 2016:1
Statistics Denmark (2022) Rail transport of passengers by unit and type of transport. https://www.statbank.dk/BANE25
Statistics Finland (2022) Passenger Traffic between Finland and foreign countries by port and country, 2016M01-2021M12. Available: https://pxnet2.stat.fi/PXWeb/pxweb/en/StatFin/StatFin__lii__uvliik__kk/statfin_uvliik_pxt_12j3.px/
Wøien Meijer, M., & Giacometti, A. (2021) Nordic border communities in the time of COVID-19. Nordregio.
Wøien Meijer, M. (2022g) Covid-19 in Borderlands. Report for Region Värmland’s Norway-Sweden project, 2021. https://regionvarmland.se/4.66b7f1a17e71cd8b19118ae.html
Øresundsbron (2021) Traffic statistics 2021. Summary of Traffic statistics. https://www.oresundsbron.com/en/traffic-stats
Øresundsinstituttet (2021) Mentala gränshinder. Upplevelser av hinder och möjligheter vid arbete över gränsen mellan Finland och Sverige. Øresundsinstituttet Analys. https://www.oresundsinstituttet.org/wp-content/uploads/2021/09/Mentala-granshinder-SE.pdf?link_id=zgE7YpDbs6JB0
Ålands statistik och utredningsbyrå (2022), Statistik. https://pxweb.asub.ax/PXWeb/pxweb/sv/Statistik/Statistik__TU
Ålands statistik och utredningsbyrå (2022), Inresande till Åland 2021. Turisme. https://www.asub.ax/sv/statistik/inresande-aland-2021
7. Working from home
Authors: Linda Randall and Gustaf Norlén
Maps and data: Gustaf Norlén, Oskar Penje and Linda Randall

The workplace closures necessitated by the Covid-19 pandemic brought about a dramatic shift in working life for many workers, particularly in the knowledge economy. While this undoubtedly presented challenges, both employers and workers demonstrated considerable adaptability, maintaining productivity by moving activities online. The relative ease with which this shift occurred has raised interesting questions about the future, with several large companies and some parts of the public sector announcing plans to retain more flexible working conditions in the longer term (Lundström & Westerdahl, 2021). Surveys suggest that Nordic workers are also positive about this, particularly hybrid arrangements that would allow them to split their time between the workplace and working from home (Fackförbundet ST, 2021; Kraka-Deloitte, 2020; Onsager et al., 2021; YLE, 2020). Against this backdrop, Chapter 7 explores recent developments and the future prospects for working from home in the Nordic Region. It considers the prevalence of working from home prior to the Covid-19 pandemic and reviews the situation throughout 2020 and 2021. It then considers the potential for maintaining higher levels of working from home in the long term, with particular emphasis on the implications for different types of regions and municipalities.
Acceleration of an existing trend
Working from home, at least some of the time has been steadily increasing in all of the Nordic countries since at least 2002 (see Figure 7.1). The proportion of Nordic workers who reported working from home prior to the onset of the pandemic (2019) was also substantially higher than the European average in all of the Nordic countries, with the exception of Norway (see Figure 7.2). Part of this variation is due to labour market structures – the Nordic countries have relatively high proportions of workers in sectors in which working from home is common, for example, in the knowledge and IT-intensive sectors (Sostero et al., 2020). Even in these sectors, however, working from home has been more common in the Nordic countries than elsewhere in Europe. For example, in Sweden, over 50% of those employed in knowledge-intensive business services (e.g., computer scientists, engineers) reported "usually" or "sometimes" working from home in 2019. In the EU as a whole, this proportion was only 25%, and the figure was even lower in, for example, Austria (22%), Germany (17%), and Italy (4%); (Sostero et al., 2020). This suggests that there are factors other than sectoral ones that made working from home more common in the Nordic countries prior to the pandemic.
Figure 7.1. The proportion of the working-age population who report working from home "sometimes" or "usually", 2002–2019.
Source: Eurostat (European Labour Force Survey).
Figure 7.2. The proportion of the working-age population who report working from home "sometimes" or "usually", 2019–2020.
Source: Eurostat (European Labour Force Survey).
Note: In Sweden, the questions regarding working from home were changed in 2020. This has resulted in more comprehensive data for the country (see below) but also means that the Swedish figures for 2020 are not comparable to previous years, nor to other EU countries.
All European countries reported an increase in working from home in 2020 compared to 2019 (see Figure 7.2). The most marked increase was in the proportion of workers who reported "usually" working from home. Among the Nordic countries, the increase was most marked in Finland (14.5% 2019; 25.3% 2020), followed by Denmark (8.2% 2019; 17.2% 2020) and Iceland (5.9% 2019; 9.1% 2020). In Norway, the statistics do not show a marked increase between 2019 and 2020. According to Statistics Norway, this may reflect the fact that only those who had an employment contract indicating a home office responded positively to the question.
A more detailed understanding of the extent of working from home throughout the pandemic can be found by looking at data from Sweden, where the Labour Force Survey was extended to include more detailed questions about working from home from May 2020 (Figure 7.3). This data shows that working from home peaked in January 2021, at which point 42.7% of the Swedish workforce worked from home at least some of the time. By August 2021, the proportion had fallen to 32.9%. This could be a seasonal effect but is perhaps also a consequence of higher vaccination rates after the summer.
Interestingly, when the recommendation from the Swedish Health Authority to "work from home if you can" was lifted (29 September 2021), the proportion of workers who reported working from home did not decrease markedly. Instead, the proportion of people who responded "yes, but I usually work from home" increased quite substantially. This option was presumably intended to distinguish between those who worked from home prior to the pandemic and those for whom working from home represents a behavioural shift. It is possible that this option is now also capturing workers who did not work from home prior to the pandemic but who now consider working from home usual behaviour.
Figure 7.3. The proportion of the Swedish labour force who reported working from home.
Source: Labour Force Survey.
Perhaps the most notable takeaway from Figure 7.3 is that the majority of Swedish workers did not work from home between May 2020 and August 2021. Even at the most critical moments of the pandemic, more than half the workforce continued to go to their workplace. The variation in working from home can, for the most part, be explained by two factors – sector and occupation. For example, in Q1 2021, over 80% of those employed in the information and communication sector worked from home, while in the hotel/restaurant sector, this number was as low as 10%. Working from home was also uncommon in the healthcare sector (< %20) and transport sector (< 20%; Figure 7.4). Relatively many managers, professionals, and technicians worked from home, while plant and machine operators, tradespeople, and service and sales staff reported less frequent working from home during the pandemic. (Figure 7.5). Those employed by the state were more likely to be able to work from home than those employed by the private sector or in municipalities and regions (SCB, 2021).
Figure 7.4. The proportion of the Swedish workforce who reported working from home in Q1 2021 by sector.
Source: Labour Force Survey.
Figure 7.5. The proportion of the Swedish workforce who reported working from home in Q1 2021 by occupational group.
Source: Labour Force Survey.
Remote-work potential higher in urban municipalities
Unfortunately, data limitations make it impossible to compare the regional and local situation regarding working from home during the pandemic. Instead, we have used data on labour-market structures to calculate the theoretical potential for working from home in Nordic municipalities (henceforth referred to as remote-work potential), based on the methodology developed by Dingel and Neiman (2020; see Box Calculating remote-work potential).
The calculation of remote-work potential used to generate Map 7.1 is based on the methodology developed by Dingel and Neiman (2020). This method estimates the proportion of jobs that can theoretically be performed from home based on a simple YES/NO classification. The classification involves identifying characteristics that rule out the possibility of working from home based on responses to two surveys in the US Department of Labour's Occupational Information Network (O*Net): the Work Context Questionnaire and the Generalised Work Activities Questionnaire.
These conditions include: i) emails used less than once a month, (ii) dealing with violent people, (iii) work outdoors every day, (iv) exposed to disease or infection at least once a week, (v) exposed to burns, cuts, bites or stings at least once a week, (vi) majority of time spent walking or running, (vii) majority of time wearing protective or safety equipment, (viii) performing physical activities is very important, (ix) handling and moving objects, (x) controlling machines and processes, (xi) operating vehicles, mechanised devices or equipment, (xii) working directly for or with the public, (xiii) repairing and maintaining mechanical equipment, (xiv) repairing and maintaining electronic equipment, (xv) inspecting equipment, structures, or materials.
All jobs that do not include these characteristics are considered possible to do from home. The authors concede that this simplistic approach is likely to result in the inclusion of several jobs in which working from home, while possible, may be challenging. As such, the proportion of jobs that can be done from home in Map 7.1 is probably at the upper limits of what would be expected under ordinary circumstances (i.e., in a non-pandemic scenario).
Dingel and Neiman's (2020) US classifications were translated to the European International Standard Classification of Operations (ISCO-08) codes following the method used by Norlén and Randall (2020) in calculating the proportion of jobs at risk of automation in Nordic municipalities in State of the Nordic Region 2020. The result was that every 4-digit ISCO occupation was coded as either 1: possible to work from home or 0: not possible to work from home. It should be noted that, in the case of primary school teachers, we disagreed with Dingel and Neiman's categorisation and amended the score accordingly. Dingel and Neiman categorised primary school teachers as 1: possible to work from home but we classified primary school teachers as 0: not possible to work from home. We do not believe that primary school teachers are likely to work from home in a scenario where there is no public health threat.
The occupational data used for the Nordic countries is register data, which makes it possible to map at the municipal level. It should be noted that there are some differences in the way this data is collected which can affect the comparisons between the countries slightly.
In order to validate the methodology, we compared the figures on the theoretical capacity for remote work to the actual numbers of people working from home in the different regions in Sweden during the pandemic (Sweden being the only Nordic country to have collated data on working from home at the regional level). The results show a relatively strong correlation (see Figure 7.6), suggesting that the Dingel and Neiman method is likely to be a good predictor of the actual number of jobs in an economy that can be done from home.

Figure 7.6. Correlation of results for Swedish regions based on the methodology used (i.e., Labour Force Survey or results calculated using the Dingel and Neiman methodology).
Based on our calculations, approximately 37% of the Nordic workforce can (theoretically) work from home. This equates to approximately 9.5 million jobs. The highest proportion is in Denmark (38.9%), followed by Sweden (37.5%), Norway (36.5%), Finland (34.7%), Iceland (34.7%) and Åland (32.4%). At the municipal level, Map 7.1 shows that the highest proportion is in, or in the proximity of, the largest urban conurbations. The ten municipalities with the highest proportions are all in capital regions, with seven out of 10 in either Copenhagen (Hovedstaden) or Stockholm Region. In general, people in urban municipalities are more likely to be able to work from home (46.2%) than those in intermediate municipalities (32.3%) and rural municipalities (27.8%).
It seems to be the case that the higher proportion of jobs that can be done from home in urban areas relates to the differences in industrial profiles between urban and rural areas, in particular, a higher concentration of knowledge-intensive sectors in urban areas. These differences are also evident when comparing countries. For example, Denmark has a rather large number of municipalities with high proportions of jobs that can be done from home. This may be due to the fact that the majority of Danish municipalities have balanced industrial profiles[1]Balanced industrial profile is defined here as an industrial profile that is comparable to the Nordic average. , with a minor overrepresentation of trade and business (Norlén, 2018). A similar pattern is observed in the south of Sweden. Here, industrial profiles vary more between municipalities; however, those with balanced industrial profiles have higher remote-work potential.
In contrast, many rural municipalities in Finland are dominated by the agriculture, forestry, and fisheries sectors (Norlén, 2018), where the remote-work potential is considerably lower. In Norway, the overall industrial profile is more mixed, and this is reflected in home working, which also varies considerably between municipalities. It is difficult to comment on the situation in Iceland due to the lack of data at the municipal level. The lower proportion of jobs that can be done from home in Iceland overall (34.7%) compared to the Nordic average (36.5%) may be due to the overrepresentation of tourism and fisheries in many municipalities.
Footnotes
- ^ undefined

Map 7.1. Remote-work potential.
Alongside the sectoral, occupational and place-based differences observed so far, there are also other important differences to take into account. Working from home is less likely to be an option for people in low-income jobs (Dingel & Neiman, 2020). In Norway, for example, the average salary for jobs that can (theoretically) be done from home is 27% higher than for jobs in which working from home is not possible (NOK 54,000 compared to NOK 44,000).
The Swedish data regarding those who actually worked from home during the pandemic reveals other divisions. More than half of workers in occupations that require higher education (ISCO 1-3 managers, professionals, technicians and associate professionals) worked from home between May 2020 and August 2021. In contrast, in sectors that generally do not require higher education, such as the service, care, construction and manufacturing and transport sectors (ISCO 5, 7, and 8), under 10% worked from home. Young people (15–24 years) were the least likely to work from home, people aged 35-54 the most likely. This probably reflects the fact that many workers in this group have not completed higher education. While men and women reported working from home to a similar degree during the pandemic, some surveys have found that women were more likely to report increased stress as a result of blurred boundaries between home and work life (Eurofound, 2020).
Working from home, here to stay?
Evidence from surveys conducted since the onset of the pandemic suggests that Nordic workers have a positive attitude towards maintaining more flexible working arrangements in the future, regardless of how the public health situation plays out. In Sweden, for example, a large survey of workers found that, of those who have been working from home during the pandemic, 88% would like to continue to do so at least some of the time (Randstad, 2020). Similarly, a Danish survey found that 64% wished to continue to work from home at least one day per week (Kantar Gallup, 2021). In Finland, a survey by the Finnish media company YLE found that approximately half of the respondents wanted to continue working from home, full- or part-time (YLE, 2020). Norwegian research has found that around 70% of workers report wanting to continue working from home in a post-pandemic scenario, though only 19% wish to do so for more than two days per week (Onsager et al., 2021)
Mobility patterns observed in the largest Nordic cities suggest that at least some workers have continued to work from home more frequently than they did pre-pandemic, even during periods where the restrictions were lifted. Map 7.2 compares the average number of people who travelled to work on a weekday in January and February 2020 with the number of people who travelled to work on 11 November 2021 in the ten largest cities of Denmark, Finland[1]Note that only eight Finnish cities are included due to the lack of data for Espoo and Lahti. , Norway and Sweden. The date was selected as the reference date as it is considered to be a relatively typical Thursday. It also represents a point when few movement restrictions were in place in the Nordic countries (see introduction).
Footnotes
- ^ Note that only eight Finnish cities are included due to the lack of data for Espoo and Lahti.

Map 7.2. Changes number of people travelling to work in the Nordic municipalities with the biggest populations.
As can be seen from the map, all of the municipalities highlighted recorded a fall in work-related travel on 11 November compared to the pre-pandemic baseline. It was biggest in Stavanger (-36%), followed by Stockholm (-31%), Oulu (-30%), Bærum (adjacent to Oslo) (-29%), Frederiksberg (adjacent to Copenhagen) (-29%) and Helsinki (-29%). In general, the decrease was highest in the capitals and larger cities, but there were exceptions, for example, Jyväskylä (-26%), Örebro (-25%), Jönköping (-21%), and Randers (-20%). Several large municipalities also stood out because their patterns did not change so much, for example, Helsingborg (-3%) and Västerås (-7%) in Sweden; Viborg (-3%) and Odense (-8%) in Denmark.
These changes in mobility are just one aspect of the ongoing discussion about the potential long-term implications of increased working from home. There has also been considerable speculation about the potential for remote working to create opportunities for regions and municipalities outside of the bigger cities to attract and retain workers (Milder, 2020; OECD, 2021; Vass, 2020). A Gallup poll conducted in April 2021 in Denmark, for example, found that one in 15 respondents had contemplated moving further away from their workplace as a result of the possibility to work remotely (Kantar Gallup, 2021). This number was higher in the capital region (approximately 1 in 10), and, interestingly, it was young people who were most likely to contemplate moving further away from their place of work (Kantar Gallup, 2021). There has also been considerable discussion about how the opportunity to work from home may result in increased use of second homes.
Preconditions for remote work lacking in many municipalities
Regardless of what the future holds, it is difficult to understate the importance of digital connectivity as a precondition for working from home. This is particularly relevant for rural areas looking to attract new inhabitants or when considering the increased use of second homes as alternative workspaces. Map 7.3 shows the proportion of households that had access to fixed-line broadband with download speeds >100 mbps (superfast broadband) at the municipal level, with darker colours indicating better coverage. Overall, Denmark has the highest levels of connectivity, with 92% of municipalities providing superfast broadband to at least 85% of households. In over half (59%) of all Danish municipalities, almost all (>95%) of households have access to this connection speed. The lowest levels of connectivity are found in Finland. This is particularly evident in rural municipalities where, on average, less than half of households (48%) have access to superfast broadband. It should be noted however that Finland has excellent mobile broadband coverage. Ninety-three percent of households and 43% of summer houses have access to superfast broadband via a mobile connection (Traficom, 2021). Connectivity levels are also rather low in some parts of Iceland, for example, the Westfjords and several municipalities in the east.
Households in urban municipalities are still more likely to have access to superfast broadband than households in rural or intermediate municipalities, but the gap appears to be closing in most countries (see Figure 7.7). This is most evident in Norway, where the average household coverage for rural municipalities increased by 31% between 2018 and 2020. By comparison, average household coverage for urban municipalities in Norway increased by only 0.7%. In the archipelago (Åland Islands, Stockholm and Helsinki), general broadband connectivity is good; however, some islands with many second homes still have poor coverage.

Map 7.3. Household access to fixed broadband at minimum download speed 100 Mbps.
Figure 7.7. The proportion of households with access to fixed-line broadband >100 Mbps. Average by municipality type.
Source: National telecom agencies.
Equal access to superfast broadband is an important means for ensuring that the opportunities associated with more flexible working conditions are available throughout the Nordic Region. It is important to recognise, however, that broadband speed is not the only precondition. Early evidence from Finland suggests that other factors also come into play, with municipalities in proximity to an urban area, small and medium-sized cities, second-home municipalities and tourist hot spots tipped to be the most likely winners from this trend (MDI, 2021). Responses from policy makers will be important in promoting adaptation in these municipalities as well as in supporting other municipalities to develop strategies that will help them benefit from this trend.
Conclusions
Working from home, at least some of the time, was relatively common in the Nordic countries prior to the pandemic, compared to Europe as a whole. The social distancing measures necessitated by the pandemic greatly accelerated this trend, with a substantial proportion of the Nordic labour force working from home at different points. Many predict that this will have long-term implications, but these implications will be different depending on individual circumstances and geographical location. People in urban areas and those with high incomes and high levels of education are most likely to have the possibility of working from home, the majority of them being employed in information and communications related occupations. Though the policy and planning implications of such a shift are not yet clear, anecdotal evidence suggests that many workers will do more work from home in the future than they did before the onset of the pandemic. Responses from policy makers will be key in determining how exactly this plays out in the long term, in particular when it comes to managing the challenges and making the most of the opportunities in different types of regions and municipalities.
References
Dingel, J., & Neiman, B. (2020). How Many Jobs Can be Done at Home? (No. w26948; p. w26948). National Bureau of Economic Research. https://doi.org/10.3386/w26948
Eurofound. (2020). Living, working and COVID-19—First findings – April 2020. 11.
Fackförbundet ST. (2021). Jobba hemifrån – är distansarbete här för att stanna? https://st.org/jobba-hemifran-ar-distansarbete-har-att-stanna
Kantar Gallup. (2021). Corona og det byggede miljø: Spørgeskemaundersøgelse foretaget af Kantar Gallup i april 2021 for Videnscenter Bolius og Realdania (p. 32). Videnscenter Bolius & Realdania.
Kraka-Deloitte. (2020). Livet med corona—Nye muligheder for klimaet og økonomien? (Small Great Nation, p. 76). Kraka-Deloitte.
Lundström, A., & Westerdahl, A. (2021, February 12). Introducing Working From Anywhere. HR Blog. https://hrblog.spotify.com/2021/02/12/introducing-working-from-anywhere/
MDI (2021). Kaupunkipolitiikan koronalääkkeet. https://www.mdi.fi/content/uploads/kaupunkipolitiikan-tiekartta5-mdi-digi-210326.pdf
Milder, N. D. (2020). Remote work: An example of how to identify a downtown-related trend breeze that probably will outlast the COVID-19 crisis. Journal of Urban Regeneration & Renewal, 14(2), 135–154.
Norlén, G. (2018). Employment—Labour force participation and productivity of Nordic labour markets. State of the Nordic Region 2018. https://doi.org/10.6027/36c05896-en
Norlén and Randall (2020). The Nordic labour markets in 2040. In (eds) G. Grunfelder, G. Norlén, L. Randall & N. Sanchez Gassen, State of the Nordic Region 2020. Nordic Council of Ministers. https://pub.norden.org/nord2020-001/
OECD. (2021). Implications of Remote Working Adoption on Place Based Policies: A Focus on G7 Countries. OECD. https://doi.org/10.1787/b12f6b85-en
Onsager, K., Eika, A., Ruud, M. E., Monkerud, L., Orderud, G., & Tønnessen, M. (2021). Mindre byer og regionsentre—Roller og funksjoner i regioner og regional utvikling (NIBR rapport 2021:2; p. 215). Oslo Metropolitan University. https://www.regjeringen.no/contentassets/e569591cc29f414ea557fb161ca9e0e5/nibr-rapport-2021-2.pdf
Randstad. (2020). Nio av tio vill fortsätta arbeta hemifrån i framtiden. Randstad. https://www.randstad.se/om-oss/press/nio-av-tio-vill-fortsatta-arbeta-hemifran-i-framtiden/
SCB (2021). Ny statistik: Så många har jobbat hemifrån under pandemin. Press release 2021-09-28. https://www.scb.se/pressmeddelande/ny-statistik-sa-manga-har-jobbat-hemifran-under-pandemin/
Sostero, M., Milasi, S., Hurley, J., Fernandez-Macias, E., & Bisello, M. (2020). Teleworkability-and-the-COVID-19-Crisis-A-New-Digital-Divide.pdf. https://www.regionalstudies.org/wp-content/uploads/2020/08/Teleworkability-and-the-COVID-19-Crisis-A-New-Digital-Divide.pdf
Traficom (2021). Fungerande internetuppkopplingar en förutsättning för smidigt distansarbete – framtiden sätter press på utvecklingen av bredbandsnät. Published 05.05.2021. https://www.traficom.fi/sv/aktuellt/fungerande-internetuppkopplingar-en-forutsattning-smidigt-distansarbete-framtiden-satter
Vass, T. (2020). Multi-local living broadens our understanding of urbanisation. Kvartti - Helsinki Quarterly. https://www.kvartti.fi/en/articles/multi-local-living-broadens-our-understanding-urbanisation
YLE. (2020, April 5). Ylen kysely: Yli miljoona suomalaista siirtynyt etätöihin koronakriisin aikana – heistä noin puolet haluaa jatkaa etätöissä koronan jälkeenkin. Yle Uutiset. https://yle.fi/uutiset/3-11291865

ECONOMY
How are the Nordic economies doing post-Covid? What regions were hardest hit? How have our consumption patterns changed? Will the tourism sector recover or change profoundly? The Economy section looks at economic shock and recovery, consumption, GHG emissions, and tourism, comparing pre-Covid data with 2020 and 2021.
8. The impact of Covid-19 on the Nordic economies: shock and recovery
Authors: Carlos Tapia and Nikolaos Tragotsis
Data and maps: Oskar Penje, Johanna Carolina Jokinen and Gustaf Norlén

Alongside the health and social impacts, the Covid-19 pandemic has caused very significant harm to the global economy, albeit the damage has been asymmetric. The reasons for the impact being different in different countries and regions are complex. They relate to the specialisation and competitiveness of different regions, but also to their demographic and socioeconomic makeup, as well as to governance processes. The various approaches to the management of the pandemic and the stringency level of the measures applied have, in fact, conditioned the economic resilience of regions and industries during the pandemic (Bricco 2020). This chapter looks at the distribution of the economic impact of Covid-19 in the Nordic Region through a selection of key economic indicators.
Macroeconomic impacts in perspective
In 2020, the global economy contracted by -3.1% (IMF 2021a). Nonetheless, the economic trajectories of the various regions have been very different. While emerging markets shrank by -2.1%, advanced economies declined by twice that rate (-4.5%). The European Union was one of the regions more severely impacted by the Covid-19 crisis. Here, the GDP contraction in 2020 was -5.9% (-6.4% in the Euro area). The economic repercussions of the pandemic in the Nordic countries were less severe. On average, the Nordic economies contracted by -3.0% in 2020. Even though all countries in the Nordic Region experienced an economic deceleration, the impacts were very different in different areas (Map 8.1). Measured in real terms, in 2020 GDP volumes shrunk between -7.1% in Iceland and -0.7% in Norway. Somewhere in the middle were Denmark (-2.1%), Finland (-2.3%), and Sweden (-2.9%). In the autonomous territories, the GDP contraction ranged from a -2.8% decline in the Faroe Islands[1]At current prices to a modest 0.4% expansion in Greenland. According to the International Monetary Fund (IMF)[2]IMF DataMapper, accessed 5 February 2022., in 2021 the global GDP bounced back by 5.9%, also with marked differences between geographies. In the Nordic Region, the recovery of national GDP volumes in 2021 ranged from 3.3% in Finland to 4.8% in Sweden. The upturn in Norway was 3.9%, whereas the Danish and Icelandic GDPs bounced back by 4.1% and 4.3%, respectively[3]The 2021 data for the Nordic countries were retrieved from Eurostat. Unfortunately, at the time of writing (early February 2022), no official data are yet available for the autonomous territories..

Map 8.1. Contraction of national economies in Western Europe (2020).
According to the Quarterly National Accounts published by the OECD (2021a), the greatest economic shock during the Covid-19 pandemic in the Nordic Region took place in Q2 2020 (Figure 8.1, upper plot). This corresponded to the phase when the most stringent control measures were adopted by the health authorities in nearly all countries. During this quarter, the decline in the National GDP volumes in relation to the reference period (Q2 2019)[1]This reference period is arbitrary and was established to cover one whole year before the absolute low recorded in Q2 2020. ranged from -4.4% in Norway to -10.9% in Iceland. The average contraction in the EU-27 was even greater (-13.7%). All the Nordic economies bounced back in Q3 2020. However, the Nordic economies did not recover their pre-pandemic levels of economic activity until Q2 2021. The outliers are Norway, that bounced back more quickly than other countries (by Q3 2020) and Iceland, whose economy has not fully recovered from the decline caused by the pandemic.
Footnotes
- ^ This reference period is arbitrary and was established to cover one whole year before the absolute low recorded in Q2 2020.
Figure 8.1a. Comparison of quarterly GDP by geography and period (2019Q2-2021Q4).
Source: OECD, Quarterly National Accounts (QNA). Indicator: B1_GE. Measure: LNBQRSA.
Figure 8.1b. Comparison of quarterly GDP by geography and period (2008Q1-2010Q3).
Source: OECD, Quarterly National Accounts (QNA). Indicator: B1_GE. Measure: LNBQRSA.
It is difficult to grasp the relevance of the economic impact of the Covid-19 pandemic if it is not put in historical perspective. A comparison with the 2008 financial crisis provides interesting insights in this respect. Figure 8.1 compares the economic trajectories of the Nordic countries during the Covid-19 fallout (upper plot) with the ones observed during the 2008 financial crisis (lower plot). The figure pinpoints three substantial differences between the last two recessions: First, during the pre-crisis months before the Covid-19 outbreak, the economic performance of the Nordic countries did not show any sign of economic fatigue[1]The smaller Icelandic economy is cyclical, with declines during the first quarters of each year and expansions during the second ones.. By contrast, before the 2008 financial crisis, strong patterns of economic weakening could be perceived even before the collapse of Lehman Brothers in September 2008. Second, the economic shock caused by the Covid-19 pandemic was more abrupt than the 2008 financial crisis. The biggest Nordic GDP contraction compared to the pre-crisis reference period after the financial shock (Q1 2008) was -8.9% in Q1 2009 in Finland. This contrasts with the -10.5% drop in Iceland in Q2 2020. The range of GDP declines between the most and least affected countries has also been wider during the Covid-19 pandemic than during the 2008 financial crisis (6.1% versus 8.3%, respectively). Third, the post-shock periods have been notoriously different between the two events. Whereas it took several quarters to recover after the financial crisis (the curve was ‘L-shaped’), the recovery after the first waves of the Covid-19 pandemic was significantly quicker (the curve was notoriously ‘V-shaped’). However, at the time of writing (Feb 2022), new variants of the Covid-19 virus are still spreading across the globe in asynchronous waves, meaning that we cannot conclude that the economic repercussions of Covid-19 are fully behind us either.
Developments per GDP component
The global economic contraction of 2020 was produced by a combination of a massive initial supply shock and a large decline in demand. On the supply side, the lockdowns reduced effective production capacity in many industries. But the main economic distress caused by Covid-19 was on the demand side. Here, economic damage was channelled through reduced expenditure linked to mobility restrictions and precautionary household savings in uncertain times (Das et al., 2021). Impacts on demand can be analysed by looking at the behaviour of major components of GDP on the expenditure side, as defined in the System of National Accounts (Eurostat 2013). These include consumer spending, government spending, business investment and trade balance, and they are shown in Figure 8.2.
Reading Figure 8.2 from left to right, the first component in each country’s account is Gross capital formation. This component reflects the propensity of companies to invest in fixed assets, e.g. tangible capital goods such as machinery and infrastructure, as well as buildings and houses. Growth of this GDP component is typically associated with expansive business cycles. A net positive increase in gross capital formation is considered an indication of good economic prospects. Hence, it comes as no surprise that during 2020 this component shrank in most countries as companies reduced their investments. Measured in constant prices, Denmark was the only Nordic country to register a rise in gross capital formation in 2020 (4.5%). In the other major Nordic economies, this GDP component declined between -7.8% in Iceland and -1.6% in Finland (Figure 8.2).
Footnotes
- ^ The smaller Icelandic economy is cyclical, with declines during the first quarters of each year and expansions during the second ones.
Figure 8.2. Year-to-year variation in the main components of GDP in the major Nordic economies (2020).
Source: OECD, Quarterly National Accounts (QNA). Measure: VOB.
The intensity and evolution of government action can be grasped by looking at Final consumption expenditure of general government, which covers public spending on healthcare, education and other spending such as general administration, defence, etc. As shown in Figure 8.2, government expenditure increased in Finland (0.5%), Iceland (4.5%) and Norway (1.7%). Denmark (-1.7%) and Sweden (-0.6%) registered declines on this GDP component in relation to the previous year. This might be linked to the general weakening in government activity during the pandemic. Whereas extraordinary spending increased in all countries, ordinary spending stagnated or even fell in some places. Another aspect to consider is the different financial and fiscal implications of the economic mitigation measures adopted in the various countries (see section on Economic Mitigation Measures below).
The Households and non-profit institutions component consists of all forms of expenditure incurred by households on goods and services that are used to meet direct personal needs. With the exception of housing, which is included in the gross capital formation account, this GDP component can be assimilated into what is normally understood as “household consumption”. A quick look at the account for 2020 in Figure 8.2 shows that household spending was reduced substantially in all of the Nordic countries. This can be linked to the restrictions imposed by the health authorities to control the pandemic as well as to the spontaneous protective measures adopted by households. The decline of this GDP component ranged from -1.3% in Denmark to -6.9% in Norway. The following chapter provides more details on the impact of Covid-19 on spending habits throughout the Nordic Region.
Finally, the External balances of goods and services component summarises the relative trend for imports and exports in each market[1]The External balances of goods and services is a balancing item that combines imports and exports. When it is positive, the value of imports outweighs the value of exports and vice versa. . This GDP component depends on the economic specialisations of the economies and on the complexity of supply chains and inter-industry linkages. In most Nordic countries, both imports and exports suffered a substantial contraction in 2020. Measured in real terms, external balances deteriorated in Iceland (-96.5%), Finland (-29.9%) and Denmark (-25.9%), whereas they improved slightly in Sweden (4.6%). The outlier was Norway, where the external balance improved substantially (135.8%). The reason for this sharp increase was oil exports, which grew by NOK 53,610 million in 2020 compared to 2019[2]This represents a 11.9% increase in volume, at constant 2005 prices. Source: Statistics Norway, Final expenditure and gross domestic product, by contents, macroeconomic indicator and year (Table 09189)..
Economic winners and losers from the Covid-19 pandemic: a sectoral perspective
Worldwide, the economic shock caused by the Covid-19 pandemic took a significant toll on particular economic sectors while barely affecting others (Das et al., 2021). Economic growth in advanced economies was correlated in different ways depending on the length and strength of containment measures (Bricco 2020). Similarly, economic impacts also depend on how businesses adapted to the lower-contact environments, as well as to the support measures put in place by different governments (Das et al., 2021). In general, the service sector was more severely hit than other market segments (Meinen, Serafini, and Papagalli 2021).
As shown in Figure 8.3, the impact on the agriculture, fishing and forestry sectors differed depending on the country and type of primary production. Transport restrictions, especially concerning air freight, and closures of global markets, had a major impact on international trade. In general, effects were more adverse for agriculture commodities with complex stock management, like fresh fish and shellfish (Halloran, Wood, and Sellberg 2020; Jamil and Soares 2021). Most supply chains for fresh food products were disrupted, particularly fish and meat chains that were deeply affected by the closure of the food service sectors, such as hotels, restaurants, catering facilities and work canteens (Cook and Jóhannsdóttir 2021). Forestry was affected more by disruption on international markets (Koivisto 2020) and shortages of seasonal workers (Heikkilä 2020).
Footnotes
- ^ The External balances of goods and services is a balancing item that combines imports and exports. When it is positive, the value of imports outweighs the value of exports and vice versa.
- ^ This represents a 11.9% increase in volume, at constant 2005 prices. Source: Statistics Norway, Final expenditure and gross domestic product, by contents, macroeconomic indicator and year (Table 09189).

Figure 8.3. Relative changes in quarterly Gross Value Added (GVA) by sector and geography.
Source: OECD, Quarterly National Accounts (QNA). Indicator: B1G. Measure: LNBQRSA.
Similarly, the effect of the Covid-19 crisis on Nordic industry and manufacturing has been a direct consequence of the decline in external demand and the disruptions in international supply chains (Bricco 2020). Such disruptions were especially visible on international freight costs. Between July 2020 and October 2021, global shipping fees, in particular container freight rates, increased tenfold (UNCTAD 2021). In Finland, even if the impacts of the pandemic on bilateral exchanges with some key trade partners was considerable, manufacturing companies coped with the pandemic rather well (Hilmola et al., 2020). Likewise, compared to other Nordic countries, the aggregated impacts in Denmark were fairly modest in output terms (-7.1% in Q2 2020 and -6.7% in Q3 2020). The textile and computer industries slowed down in Q2 2020. A subsequent fall in the chemical and pharmaceutical industry, which is the largest single industrial sector in Denmark, led to a further decline in total industrial production in Q3 2020. In Norway, the contraction in manufacturing output was about -5.9% in Q2 2020, mostly at the expense of the transport industry and petroleum-related manufacturing. These sectors accounted for much of the decline as well as the subsequent recovery (Bougroug, Kragh Kjos, and Sletten 2021).
Figure 8.4. Industrial Production Index in selected Nordic economies and the EU-27.
Source: OECD, Production and Sales (MEI).
The Swedish industrial sector found itself in a more vulnerable position than its Nordic peers due to its higher dependence on exports (Bricco 2020). Here, a -18.5% fall in manufacturing output accounted for much of the decline in GDP in Q2 2020. In April 2020, the Industrial Production Index[1]The Industrial Production Index reflects the output of industrial establishments and covers sectors such as mining, manufacturing, electricity, gas and steam and air-conditioning (OECD 2021b). sank by -17 points compared to the previous month, which is broadly in line with the Euro Area average (Figure 8.4). The decline was mainly due to the lockdown in the transport industry, including the automotive industry, which was hit hard by reduced demand both at home and abroad (Bougroug et al., 2021). However, in Sweden, the recovery in Q3 2020 was much more rapid than in other Nordic economies, to the point that almost the entire fall from the previous quarter was already offset in Q3 2020.
Figure 8.3 also shows that, in terms of economic output, the contraction in Nordic economies was significantly larger in service sectors. Activities such as tourism and travel, airlines, culture and leisure, as well as logistics and transport, were challenged by closed borders, entry restrictions and quarantine rules (Eggert Hansen, Yding Sørensen, and Andersen 2021). These market segments were severely hit in 2020 and, to a large extent, have not yet recovered the pre- Covid-19 levels of economic activity in most countries. One of the most severely affected countries is Iceland. Here, the virtual halt of international air travel, together with the public health measures adopted by the government, had a pronounced negative impact on various types of domestic services. As a consequence, the tourism industry contracted abruptly at the end of Q1 2020 (Central Bank of Iceland 2021). One exception to this general state of affairs was Sweden, where damage to the service sector was minimised thanks to the less stringent containment measures. Activities like advocacy work, repair of computers and personal household goods, and other personal service activities performed significantly better in Sweden than in the other Nordic economies.
Footnotes
- ^ The Industrial Production Index reflects the output of industrial establishments and covers sectors such as mining, manufacturing, electricity, gas and steam and air-conditioning (OECD 2021b).
Figure 8.5. Monthly retail changes in selected Nordic countries and the EU-27.
Source: OECD, Production and Sales (MEI).
Retail was the only service activity to weather the Covid-19 storm relatively well in most countries (Figure 8.5). In Norway, retail sales picked up from the start of the pandemic in March. In December 2020, the industry had grown about 10%. Denmark and Finland experienced high growth in retail sales in 2020, but only from May. Sweden saw a steadier growth on the retail index after initially falling from February to May. These trends are partly explained by the greatly reduced cross-border trade, particularly between Norway and Sweden (Bougroug et al., 2021). In any case, retail trade indices in all of the countries reflected the economic uncertainties associated with the spread of the virus in the final months of 2020 and 2021.
Driven by increased demand linked to teleworking schemes (see Chapter 7), sectors like information and communication and real estate were not greatly affected by the Covid-19 crisis in any of the Nordic countries. Similarly, financial and insurance activities only suffered meaningful impact in Iceland, mostly due to the depreciation of the króna after February 2020. Still, the sector recovered swiftly following the appreciation of the national currency in the second half of the year (Central Bank of Iceland 2021).
Impact of Covid-19 on regional output
According to the OECD, the within-country heterogeneity of the impacts of the pandemic can be mostly explained by the interaction between the stringency of governments’ health measures, sectoral exposure and trade linkages (Meinen, Serafini, and Papagalli 2021). Considering that the contingency measures were essentially designed and implemented at the national level, the specialisation of regional and local economies and trade linkages stand out as the main forces driving the heterogeneous territorial impacts of the Covid-19 pandemic across the different Nordic regions. In particular, the uneven spatial distribution of vulnerable sectors, such as tourism, has helped make the territorial impacts of the pandemic greater in some areas than others (Allain-Dupré et al., 2020).
As shown in Map 8.2, aggregated production levels, measured in terms of Gross Value Added (GVA), contracted in nearly all of the Nordic regions. In general, the variability was comparatively smaller within each country than it was between countries, even when comparing regions with similar economic profiles from different countries. On average, the impact was greater on regions in Sweden and Finland than those in Denmark[1]At time of writing (February 2022), the regional accounts for Norway and Iceland are not yet available.. Still, some relevant territorial patterns emerge from the changes to regional GVA shown in Map 8.2.
The contraction was larger in regions with higher dependence on tourism services and hospitality (Åland and some municipalities in South Karelia, Finland, and Bornholm, Denmark), as well as on mass-market retail and logistics, particularly in the areas surrounding the capital regions (Södermanland and Västmanland in Sweden and Greater Copenhagen in Denmark). In Sweden and Finland, a remarkable regional divide can also be traced between territories specialised in transformation sectors with limited vulnerability to the impact of Covid-19, including forestry and specific types of processing (e.g. pulp, cement), like Northern Ostrobothnia, Kainuu and Pirkanmaa in Finland, and Gotland, Västerbotten and Örebro in Sweden. Aggregated output in these regions fell less than in regions with greater exposure to industrial manufacturing, like Kymenlaakso in Finland and Kronoberg in Sweden.
Similarly, the impact on the financial centres in Denmark (Greater Copenhagen) and Sweden (Stockholm) was less than regions with mid-sized cities and diversified urban economies, like Vestjylland (Århus) in Denmark and Upsala in Sweden. Interestingly, the shock to the Finnish economy was greater in the Helsinki metropolitan area (-3.6% Uusimaa) than it was for the Tampere region (-0.5% in Pirkanmaa). This may be due to the relatively higher concentration in Pirkanmaa of high-tech and information and communication technologies (ICT), which is one of the sectors that suffered the least during the pandemic. A similar interpretation holds for the Swedish urban areas of Gothenburg (-5.0% in Västra Götaland), and Malmö and Lund (-1.2% in Scania).
Footnotes
- ^ At time of writing (February 2022), the regional accounts for Norway and Iceland are not yet available.

Map 8.2. Change in regional GVA, 2019–2020.
Economic mitigation measures
The economic mitigation and financial support measures adopted by all of the Nordic countries were a great help in ameliorating the impact of the first wave of the Covid-19 pandemic and in improving the situation and speeding up the recovery in 2021 (Allain-Dupré et al. 2020). In the Nordic countries, such measures prevented job losses, severe damages on household finances, as well as permanent harmful effects on the production system, such as bankruptcies and closures (Bougroug et al., 2021). Budgetary intervention was facilitated by the fact that most countries in the Nordic Region went into the pandemic with relatively stronger financial systems compared to the previous crisis of 2008. This helped official agencies focus on supporting companies and households rather than the financial systems and their institutions (Cella 2020).
Emergency funding and additional spending in the health sector were prioritised to ensure hospitals and staff were properly equipped to tackle the pandemic. Policy measures of this type included allocating funds to testing and tracing, medical equipment and medicines, research and development and health sector recruitment strategies (IMF 2021c). Apart from the health sector, the Nordic governments also mobilised resources through various other fiscal policies aimed at lessening the economic impact of the pandemic. As summarised in Figure 8.6, the policies adopted were noticeably similar, with the most common being stimulus packages, labour market policies, tax deferral measures, and other financial instruments (IMF 2021b; OECD 2021c).
Deferral measures aimed to alleviate the financial liabilities of citizens and companies. These measures included deferrals for taxes, social and pension contributions, but also debts and fixed spending such as rents and utilities. In the Nordic countries, deferral measures targeted small and medium-sized enterprises (SMEs) in particular. Governments temporarily adapted tax systems (e.g., income, corporate, value-added taxes – VAT) to ease the burden on smaller businesses. Denmark also introduced a debt moratorium period for specific types of taxes (Danmarks Nationalbank 2021). The Swedish government supported SMEs exposed to the impact in vulnerable sectors (e.g., hotels, restaurants, etc.) by provisionally discounting rental costs (Sveriges Riksbank 2021). At the individual level, countries adopted tax deferrals and/or exemptions for citizens through a range of fiscal instruments.

Figure 8.6. Economic mitigation measures adopted in the Nordic countries.
Source: IMF Fiscal Monitor Database of Country Fiscal Measures in Response to the Covid-19 Pandemic. Version: July 2021; OECD Policy Responses to Coronavirus (Covid-19). Version: April, 2021; National Central Banks of the Nordics countries.
Financial instruments in the form of grants, subsidies, loans, guarantees or equity injections into companies were the most common type of fiscal policy across all of the Nordic countries. Various packages of different sizes were launched in all of them. Widely used measures included the issuance of interest-free loans to SMEs, loan guarantees to failing businesses, as well as direct aid to strategic companies. The latter took the form of bailout packages or capital injections for operators of critical transport infrastructures, like Avinor, as well as to flagship airlines, like Finnair and SAS. In Iceland, targeted transfers were channelled to companies operating in sectors such as sport, cultural organisations and tourism (Central Bank of Iceland 2021). Similarly, in Finland, restaurants received economic incentives to retain and hire employees (Bank of Finland 2021). At the individual level, countries also provided one-time grants to low-income individuals, expanded student loan schemes or made re-borrowing of pension contributions easier.
Labour-market measures were introduced to maintain the salary levels of employees and self-employed people. Virtually all countries adopted wage subsidies and compensation schemes. In Finland, pre-existing unemployment and welfare benefits (e.g., parental allowance, social assistance) were made more readily available to employees and entrepreneurs as the pandemic worsened (Jokinen 2020). Finland, alongside Norway and Sweden, also introduced temporary modifications to existing labour laws, allowing employers to reduce working hours for their staff (short-time work schemes). In all the Nordic countries, workers were compensated for the loss of income via wage subsidies or other programmes. See Chapter 5 for a more detailed description of the measures adopted in support of workers.
Labour-market measures were key to limiting the social impact of the pandemic. Thanks to these measures, average household income levels were maintained or even increased in all the Nordic countries in 2020 (Figure 8.7, upper). Stable income streams coupled with a reduction of household spending due to pandemic restrictions led to a significant increase in domestic savings (Bougroug et al., 2021). Social inequality indicators such as the Gini index calculated on equivalised disposable income did not show any major deviation in relation to the pre- Covid-19 trajectories in 2020 either (Figure 8.7, lower).
Figure 8.7a. Impact of Covid-19 on household income in the Nordic countries and the EU-27.
Source: OECD, Table: National Accounts at a Glance (NAAG).
Figure 8.7b. Impact of Covid-19 on income inequalities in the Nordic countries and the EU-27.
Source: Eurostat (Table ilc_di12).
Monetary measures adopted by all central banks sought to maintain low interest rates and safeguard the circulation of credit in the economy (IMF 2021b). In the non-Euro countries, this was mostly achieved by activating swap lines with the European Central Bank (ECB) and the US Federal Reserve, relaxing countercyclical buffers, providing collateralised loans to banks to stimulate corporate lending, easing loan conditions and liquidity ratios for commercial banks, and auctioning liquidity of US dollars (USD). In addition, the Central Bank of Norway advised private financial corporations to refrain from paying out dividends (Norges Bank 2021). As part of the Euro system, Finland aligned its domestic macro-financial policies with the ECB monetary policy, which eased fiscal constraints for the Member States through purchasing of government securities (Bank of Finland 2021).
The financial support measures and recovery packages adopted by the Nordic countries were of a very substantial size. The funds committed were significantly larger than those provided to tackle the financial crisis of 2008 and, relative to the GDP, were also substantially larger than those adopted in the EU. This was possible thanks to a financial system that was much better equipped to fight the Covid-19 recession than it was during the previous financial crisis, in particular its banking component (Giese and Haldane 2020). Denmark stands out as the Nordic country that invested most resources. The combined value of all Danish economic support measures amounted to 32.7% of GDP. Sweden followed at 16.1% of GDP. Norway invested an amount equivalent to 14.5% percent of its GDP, whereas Finland and Iceland invested 12.4% and 11.6%, respectively. By comparison, the economic support measures at the EU level represented around 10.5% of GDP (Figure 8.8).
Figure 8.8. Relief packages by the Nordic countries and the EU-27, 2020–2021.
Source: IMF, Database of Country Fiscal Measures in Response to the Covid-19 Pandemic and IMF staff estimates. Estimates as of September 27th, 2021.
However, lump sums are not the only parameter to consider when evaluating the relevance and repercussions of economic support measures. Such measures have different implications in terms of budgetary balances, long-term debt impacts and fiscal risks. Tax cuts (foregone revenues) and deferrals result in immediately higher and temporary budget deficits. Support to companies in financial trouble through loans or equity injections (liquidity support) does not impact public budget balances but may increase overall government debt in the long run. Loan guarantees do not directly affect deficits or debt but may affect liquidity and expose national finances to medium- to long-term fiscal risks (IMF 2020). Figure 8.8 provides an overview of the distribution of the measures across the Nordic countries and the EU, grouped by economic support category. In terms of materialised spending and foregone revenues, which have direct financial implications on both public deficit and long-term debt, the most generous countries were Iceland (10.1% of its GDP) and Norway (7.4% of its GDP). In terms of financial measures with potential long-term debt impacts but limited budgetary implications, Denmark clearly stands out. The Danish Government channelled an amount equivalent to 12.1% of its GDP towards liquidity support measures. Protected by the ECB fiscal umbrella, Finland was the country that adopted most measures with greater long-term liquidity risks (the equivalent of 6.9% of GDP invested in guarantees).
Figure 8.9a. Spending, thousand USD per capita in major Nordic economies.
Source: OECD, Table: National Accounts at a Glance (NAAG) and Eurostat (gov_10dd_edpt1), Statistics Iceland (THJ05181) and Statistics Norway (11559).
Figure 8.9b. Public debt, % of GDP in major Nordic economies.
Source: OECD, Table: National Accounts at a Glance (NAAG) and Eurostat (gov_10dd_edpt1), Statistics Iceland (THJ05181) and Statistics Norway (11559).
As a logical outcome of the extraordinary spending due to Covid-19 mitigation policies, the per-capita increases in public spending were substantial (Figure 8.9, upper).[1]The evolution of exchange rates between the local currencies and the USD also plays a role here. In 2020 the Swedish krona and the Danish krone appreciated against the USD by 3.0% and 2.1%, respectively. The euro also appreciated in relation to the USD by 2.0%. In turn, the Norwegian krone and Icelandic króna depreciated against the USD by -6.2% and -9.8%, respectively. There is, however, broad expert consensus that budget deficits remained under control in all of the Nordic countries (Greve et al. 2021; Argento, Kaarbøe, and Vakkuri 2020). Likewise, since many of the measures applied were either neutral from a debt perspective, or their effects will only become visible in the long term, the impact on total government debt, measured as a percentage of GDP, has so far been quite limited, considering that GDP contracted significantly in real terms in most of the countries (Figure 8.9, lower).
Business bankruptcies
The role of governments, the social partners and other stakeholders in designing and sustaining the different economic support measures described in the previous section has been emphasised as a key factor that prevented a large number of business failures throughout the Nordic Region (Eggert Hansen, Yding Sørensen, and Andersen 2021). Thanks to these measures, business liquidations filled in 2020 remained stable or even fell in most Nordic countries (Figure 8.10).
Footnotes
- ^ The evolution of exchange rates between the local currencies and the USD also plays a role here. In 2020 the Swedish krona and the Danish krone appreciated against the USD by 3.0% and 2.1%, respectively. The euro also appreciated in relation to the USD by 2.0%. In turn, the Norwegian krone and Icelandic króna depreciated against the USD by -6.2% and -9.8%, respectively.
Figure 8.10. Changes in the number of business bankruptcies in the Nordic countries (filled petitions).
Source: OECD, Timely Indicators of Entrepreneurship by Enterprise Characteristics, Indicator: Number of bankruptcies (Initiation of insolvency procedures).
As shown in Figure 8.10, disruptions in administrative procedures and economic mitigation measures affected new bankruptcy declarations. In all countries the number of insolvency procedures initiated in 2020 was substantially smaller than in 2019. Still, comparing figures for 2020 with the 2014-2019 average, only Finland (-0.5%) and Iceland (-5.6%) show a reduction in the number of filings. Economic mitigation measures seem to have been particularly successful in Iceland, a country with a large tourism sector that was severely hit by the pandemic. The support measures approved by the government, municipalities and credit institutions, together with the temporary lifting of travel restrictions in 2020 (Central Bank of Iceland 2021), appear to have helped prevent additional bankruptcies.
In 2021 the number of filings in Denmark, Iceland and Finland increased again to pre-pandemic levels. Only Sweden and Norway managed to reduce the number of insolvency procedures initiated in 2021. The rapid rollout of economic contingency measures targeting short-term liquidity throughout the Nordic Region may have, in fact, revived firms that were otherwise headed towards failure due to factors unrelated to the pandemic (Hodbod et al. 2020). In this way, contingency policies may have undermined the role that bankruptcies play in filtering out failing businesses (Barnes et al., 2021) and may instead have generated a form of ‘artificial stability’ (Helwege 2010). As recent numbers suggest, some of the bankruptcies may have simply been delayed or postponed to a later date. It is expected, therefore, that the number of bankruptcy filings in the Nordic countries will increase in the years to come (Kaiponen 2021), particularly if economic stimulus is removed abruptly to fight inflation.

Map 8.3. Concluded bankruptcies, relative change. 2020 compared to 2015-2019 average.
Map 8.3 shows the variation on the number of concluded bankruptcies in 2020 in comparison to the 2015-2010 average. A share of these might have been instigated before the statistical year. This information is complementary to the one presented in Figure 8.10. The distribution of closed business bankruptcies at sub-national levels does not show a clear territorial pattern. In Iceland and Denmark, businesses in the most urbanised areas, including the capital regions, seem to have been those that benefited most from the economic mitigation measures (-23.9% in Höfuðborgarsvæðið and -24.4% in Region Hovedstaden). By contrast, Oslo is the only Norwegian region where there were more business bankruptcies in 2020 compared to the 2015–2019 baseline (1.9% increase). Most Norwegian regions did, in fact, have fewer bankruptcies in 2020, particularly in the western regions. One plausible explanation for this could be that the number of business failures during the baseline period was especially high in western Norway due to the fall in oil prices in 2014–2015.
In Sweden the situation is even more mixed. Here, businesses in urban areas seem to have been more exposed to the distress caused by the Covid-19 pandemic. The most urbanised regions in the Stockholm-Gothenburg-Malmö corridor registered a greater increase in liquidations (Jönköping, Kronoberg and Södermanland regions saw surges of around 20%). However, predominantly rural regions in Sweden, such as Västerbotten and Jämtland, also recorded higher numbers of bankruptcies than average (9.8% and 8.8% increase, respectively). In Finland, the impact was greater in Lapland (26.9%) and around Helsinki (Uusimaa, 25.9%) than in the central parts of the country. Åland also experienced a moderate rise in business bankruptcies in 2020 (4.0%), mostly related to the tourism sector.
Regional patterns in business failures are linked to factors ranging from the effectiveness of the measures adopted by the various governments to the exposure of regional economies to vulnerable sectors. Regions with higher numbers of bankruptcies tend to reflect the concentration of economic activity in sectors particularly affected by the pandemic. It comes as little surprise that Accommodation and food service activities were the industries with the largest increase in concluded business bankruptcies in 2020 compared to the 2015–2019 baseline. In the Nordic Region as a whole, the number rose by 28.6%. This pattern is also discernible at the regional level. Hotels and restaurants were the activities with the biggest increase in the number of bankruptcies in a significant number of Swedish, Norwegian and Finnish regions (Map 8.4).
Other sectors suffering higher-than-average numbers of business bankruptcies are service industries, particularly those requiring closer social interaction, like Education (16.5% increase), Other service activities (12.0% increase) and Administrative and support service activities (7.9% increase). Overall, these numbers are consistent with the production patterns described above. The logistics sector was also greatly affected, with major impact localised around logistics centres and transport nodes in the different countries. In the capital regions of Oslo, Stockholm and Helsinki, Transportation and storage was the sector with the largest increase in bankruptcies. Wholesale and retail trade; repair of motor vehicles and motorcycles was the industry to suffer the most in Denmark and several Finnish and Swedish regions.

Map 8.4. Bankruptcies by industry and region (2020 compared to the 2015–19 average, concluded cases).
Conclusions
The Covid-19 pandemic has caused an economic recession that has affected industries and employees in very different ways than previous crises. Unlike ‘traditional’ economic downturns, in which the impact on consumption and employment is deep and broad, the coronavirus fallout has so far been more selective and has concentrated on specific sectors and regions. Economic activities that require closer social interaction, particularly those in the personal services sector, as well as those that rely the most heavily on social mobility, like tourism and hospitality, have been those most severely affected during the first waves of the pandemic in 2020 and 2021. By contrast, activities like real estate, financial services, or IT services have so far been spared by the pandemic in most of the Nordic countries.
All things considered, the macroeconomic figures for 2020 and 2021 suggest that the health control measures applied in Iceland, Denmark, Norway and Finland may have had more adverse economic consequences, in the form of further loss of value creation, than those adopted in Sweden. However, it is very difficult to link the specific contribution of infection control measures, self-regulation among households, and interruptions to foreign trade, with the overall economic performance. The interplay between the health protection measures adopted by institutions and individuals, social attitudes and consumption behaviours, together with pre-existing economic vulnerabilities, materialised in the different economic repercussions observed in the regions.
The support measures introduced by all the Nordic governments certainly helped to alleviate the short-term economic impact and enabled a rapid economic recovery. Still, these economic measures have also created some uncertainties, particularly when it comes to business demographics, debt status and fiscal policy. In addition, the impacts of the Covid-19 outbreak on human capital, company productivity, consumption behaviour and social attitudes may be long-lasting, as well as their implications for other relevant policy areas, such as the climate agenda. It is, therefore, too early to evaluate how deep and how far the Covid-19 pandemic, which is still ongoing, will affect the foundations of the Nordic economies in the long run.
References
Allain-Dupré, Dorothée, Isabelle Chatry, Antoine Kornprobst, and Maria-Varinia Michalun. (2020). The Territorial Impact of COVID-19: Managing the Crisis across Levels of Government. OECD Centre on SMEs, Entrepreneurship, Regions and Cities. https://www.oecd.org/coronavirus/policy-responses/the-territorial-impact-of-covid-19-managing-the-crisis-across-levels-of-government-d3e314e1/
Argento, Daniela, Katarina Kaarbøe, and Jarmo Vakkuri. (2020). “Constructing Certainty through Public Budgeting: Budgetary Responses to the COVID-19 Pandemic in Finland, Norway and Sweden.” Journal of Public Budgeting, Accounting & Financial Management 32 (5). Emerald Publishing Limited: 875–887. doi:10.1108/JPBAFM-07-2020-0093.
Bank of Finland. (2021). “Bank of Finland Annual Report 2020.”
Barnes et al. (2021). “How Businesses Are Surviving Covid-19: The Resilience of Firms and the Role of Government Support.” https://voxeu.org/article/how-businesses-are-surviving-covid-19?qt-quicktabs_cepr_policy_research=0.
Bougroug, Achraf, Øyvind Kragh Kjos, and Pål Sletten. (2021). Økonomisk Utvikling Gjennom Covid-19: En Sammenligning Av Utviklingen i Norge, Sverige Og Danmark. Oslo, Norway: Statistisk sentralbyrå. https://www.ssb.no/nasjonalregnskap-og-konjunkturer/artikler-og-publikasjoner/_attachment/450956?_ts=178ca845f00
Bricco, Jana. (2020). What are the Economic Effects of Pandemic Containment Policies? Evidence from Sweden. S.l.: International Monetary Fund. http://elibrary.imf.org/view/IMF001/29281-9781513556109/29281-9781513556109/29281-9781513556109.xml.
Cella, Cristina. (2020). Bankruptcy at the Time of COVID-19 – The Swedish Experience. Sveriges Riksbank. https://www.riksbank.se/globalassets/media/rapporter/staff-memo/svenska/2020/bankruptcy-at-the-time-of-covid-19--the-swedish-experience.pdf
Central Bank of Iceland. (2021). Annual Report 2020. Reykjavík, Iceland. https://www.cb.is/publications/news/news/2021/04/07/Annual-Report-2020/
Cook, David, and Lára Jóhannsdóttir. (2021). “Impacts, Systemic Risk and National Response Measures Concerning COVID-19—The Island Case Studies of Iceland and Greenland.” Sustainability 13 (15): 8470. doi:10.3390/su13158470.
Danmarks Nationalbank. (2021). Annual Report 2020. Copenhagen, Denmark. https://www.nationalbanken.dk/en/publications/Pages/2021/03/Annual-Report-2020.aspx.
Das, Sonali, Giacomo Magistretti, Evgenia Pugacheva, and Philippe Wingender. (2021). Sectoral Shocks and Spillovers: An Application to COVID-19. Working Paper 2021/204. IMF. https://www.imf.org/en/Publications/WP/Issues/2021/07/30/Sectoral-Shocks-and-Spillovers-An-Application-to-COVID-19-462895
D’Orazio, Paola. (2021). “Towards a Post-Pandemic Policy Framework to Manage Climate-Related Financial Risks and Resilience.” Climate Policy 21 (10): 1368–1382. doi:10.1080/14693062.2021.1975623.
Eggert Hansen, Martin, Stig Yding Sørensen, and Tine Andersen. (2021). Analyse Af Udvikling Og Respons i Nordiske Arbejdsmarkeder Som Følge Af COVID-19-Pandemien. Aarhus, Denmark: Teknologisk Institut.
Eurostat. (2013). European System of Accounts: ESA 2010. LU: Publications Office. https://data.europa.eu/doi/10.2785/16644.
Giese, Julia, and Andy Haldane. (2020). “COVID-19 and the Financial System: A Tale of Two Crises.” Oxford Review of Economic Policy 36 (Supplement_1): S200–S214. doi:10.1093/oxrep/graa035.
Greve, Bent, Paula Blomquist, Bjørn Hvinden, and Minna van Gerven. (2021). “Nordic Welfare States—Still Standing or Changed by the COVID-19 Crisis?” Social Policy & Administration 55 (2): 295–311. doi:10.1111/spol.12675.
Halloran, Afton, Amanda Wood, and My Sellberg. (2020). What Can the COVID-19 Pandemic Teach Us about Resilient Nordic Food Systems? Nordic Council of Ministers.
Heikkilä, Elli. (2020). “Editorial: Foreign Seasonal Migrants in Agriculture and COVID-19.” Migration Letters 17 (5): 563–567. doi:10.33182/ml.v17i5.1153.
Helwege, Jean. (2010). “Financial Firm Bankruptcy and Systemic Risk.” Journal of International Financial Markets, Institutions and Money 20 (1): 1–12. doi:10.1016/j.intfin.2009.11.002.
Hilmola, Olli-Pekka, Oskari Lähdeaho, Ville Henttu, and Per Hilletofth. (2020). “Covid-19 Pandemic: Early Implications for North European Manufacturing and Logistics.” Sustainability 12 (20). Multidisciplinary Digital Publishing Institute: 8315. doi:10.3390/su12208315.
Hodbod, Alexander, Cars H Hommes, Stefanie Huber, and Isabelle Salle. (2020). “The COVID-19 Consumption Game-Changer: Evidence from a Large-Scale Multi-Country Survey.” Covid Economics: Vetted and Real-Time Papers, no. 59 (November). CEPR Press: 40–76.
IMF. (2020). Fiscal Monitor, April 2020 Policies to Support People During the COVID-19 Pandemic. S.l.: International Monetary Fund. http://elibrary.imf.org/view/IMF089/28929-9781513537511/28929-9781513537511/28929-9781513537511.xml
IMF. (2021a). World Economic Outlook 2021/10: Recovery During a Pandemic. Health Concerns, Supply Disruptions, and Price Pressures. Washington, DC: International Monetary Fund, Publication Services. https://www.imf.org/en/Publications/WEO/Issues/2021/10/12/world-economic-outlook-october-2021.
IMF. (2021b). Policy Responses to Covid-19- Policy Tracker. International Monetary Fund. https://www.imf.org/en/Topics/imf-and-covid19/Policy-Responses-to-COVID-19#S.
IMF. (2021c). “Fiscal Policies Database.” https://www.imf.org/en/Topics/imf-and-covid19/Fiscal-Policies-Database-in-Response-to-COVID-19.
Jamil, Kazi Safayat, and Manuel Soares. (2021). “Ensuring Supply Chain Resilience in the Food Retail Industry during COVID-19 : The Case for the Food Retail Companies in Sweden Using Resource-Based View Theory.” Jönköping University, JIBS, Marketing and Logistics and Jönköping University, JIBS, Centre of Logistics and Supply Chain Management (CeLS) / , JIBS, Marketing and Logistics, JIBS, Centre of Logistics and Supply Chain Management (CeLS) and , JIBS, Centre of Logistics and Supply Chain Management (CeLS), JIBS, Marketing and Logistics.
Jokinen, Heikki. (2020). Finland Had No Need for New Schemes for Short-Time Work Due to the Coronavirus Pandemic. https://www.jhl.fi/en/2020/09/17/finland-had-no-need-for-new-schemes-for-short-time-work-due-to-the-coronavirus-pandemic/#:~:text=New%2C%20usually%20fully%20state%20financed%20schemes%20were%20quickly,on%20the%20basis%20of%20the%20actualised%20wage%20bill
Kaiponen, Vili. (2021). “Company Bankruptcy and Historical Crisis Performance Comparison in Finland, Germany & Sweden in the Beginning of COVID-19 Pandemic.”
Koivisto, Mikko. (2020). “Main Supply Chains of Forest Chips in Finland and Sweden, and Potential Effects of COVID-19 on the Markets of Forest Chips, Pulpwood and Timber.” University of Eastern Finland Faculty of Science and Forestry, School of Forest Sciences. https://erepo.uef.fi/handle/123456789/23880
Meinen, Philipp, Roberta Serafini, and Ottavia Papagalli. (2021). Regional Economic Impact of Covid-19: The Role of Sectoral Structure and Trade Linkages. Working Paper 2825. European Central Bank.
Norges Bank. (2021). Annual Report 2020. Oslo, Norway. https://www.norges-bank.no/en/news-events/news-publications/Reports/Annual-Report/2020-annual-report/.
OECD. (2021a). “Quarterly National Accounts” 2021 (1). doi:10.1787/22195114.
OECD. (2021b). “Industrial Production.” OECD. doi:10.1787/39121c55-en.
OECD. (2021c). One Year of SME and Entrepreneurship Policy Responses to COVID-19: Lessons Learned to “Build Back Better.” OECD Policy Responses to Coronavirus (COVID-19). OECD Policy Responses to Coronavirus (COVID-19). doi:10.1787/9a230220-en.
Sveriges Riksbank. (2021). “The Riksbank’s Measures in Connection with the Corona Pandemic.” https://www.riksbank.se/en-gb/press-and-published/updates-on-the-riksbank-and-the-coronavirus-pandemic/the-riksbanks-measures-in-connection-with-the-corona-pandemic/.
UNCTAD. (2021). Container Shipping in Times of COVID-19: Why Freight Rates Have Surged, and Implications for Policy Makers. UNCTAD Policy Brief 84. https://unctad.org/system/files/official-document/presspb2021d2_en.pdf
9. Consumption, GHG emissions, car sales, and housing markets
Authors: Karen Refsgaard, Alex Cuadrado and Nikolaos Tragotsis
Data and maps: Oskar Penje

In this chapter, we analyse the impact of the pandemic on household consumption[1]The definition of household consumption is stipulated in the 2008 System of National Accounts: “Household final consumption expenditure consists of the expenditure, including expenditure whose value must be estimated indirectly, incurred by resident households on individual consumption goods and services, including those sold at prices that are not economically significant and including consumption goods and services acquired abroad” (UN et al. 2008). Household spending is the amount of final consumption expenditure made by resident households to meet their everyday needs, such as food, clothing, housing (rent), energy, transport, durable goods, health costs, leisure, and miscellaneous services. The actual individual consumption includes government transfers which is equal to households' consumption expenditure plus those expenditures of general government and non-profit institutions serving households that directly benefit households, such as health care and education. After GDP, household final consumption is undoubtedly the most important variable in the national accounts, representing in general more than 60% of GDP (Lequiller and Blades 2014). patterns. We look at household consumption by size of, composition of, and changes in consumption prior to and during the pandemic. This is followed by an assessment of how consumption-related GHG emissions were effected in the early stages of the pandemic. We then analyse changes in cars sales as an indicator of how the pandemic directly affected consumption habits and of how this effect, combined with the gradual shift to electric cars, could support the climate agenda but also affect the car-manufacturing industry in the Nordic Region. As housing is such a large and indirect component of household consumption, we round off with a look at changes in the housing market at national and regional levels for different types of dwellings.
Household consumption
Previous studies have identified a sharp drop in consumer spending in the Western Hemisphere during the first wave of the pandemic (see e.g. Hodbod et al. 2020 for a multi-country comparison). Using transaction data covering 8% of the world’s GDP, Carvalho et al. (2020) observed a large and abrupt 50% decline in global household expenditure in 2020. However, this trend has not been homogeneous across regions and income groups (Bounie et al. 2020; Chetty et al. 2020). In the Nordic countries, household consumption fell most sharply in Q2 2020 (see Figure 9.1). By Q3 2021, it was higher than the pre-pandemic level in Denmark and Sweden and at a comparable level in Norway and Finland.
Footnotes
- ^ The definition of household consumption is stipulated in the 2008 System of National Accounts: “Household final consumption expenditure consists of the expenditure, including expenditure whose value must be estimated indirectly, incurred by resident households on individual consumption goods and services, including those sold at prices that are not economically significant and including consumption goods and services acquired abroad” (UN et al. 2008). Household spending is the amount of final consumption expenditure made by resident households to meet their everyday needs, such as food, clothing, housing (rent), energy, transport, durable goods, health costs, leisure, and miscellaneous services. The actual individual consumption includes government transfers which is equal to households' consumption expenditure plus those expenditures of general government and non-profit institutions serving households that directly benefit households, such as health care and education. After GDP, household final consumption is undoubtedly the most important variable in the national accounts, representing in general more than 60% of GDP (Lequiller and Blades 2014).
Figure 9.1. Final consumption expenditure of households in the largest Nordic economies.
Source: OECD, Quarterly National Accounts (QNA). Measure: LNBQRSA.
According to historical data, the sharp contraction in household consumption registered in 2020 can be considered a rather exceptional event in the recent economic history of the Nordic countries. In Norway, for instance, consumption had not receded substantially since the time series began in 1978 (consumption declined by 0.2% in Q4 1988). In Sweden, the only previous drop in household consumption comparable to the one observed in Q2 2020 was registered in Q1 1993, when consumption fell by 7%. In Iceland, 2020 was the first time a decline in household consumption was witnessed since records began in 1996. In Denmark, consumption fell during the financial crises of 1993 and 2008 but not as much as it did in Q2 2020. In Finland, consumption also fell substantially during the financial crisis of 2008, but Q2 2020 was a new record low.
In general, consumption behaviour is captured rather well by consumer confidence indices, which provide an indication of consumers’ confidence in the future economic situation. The OECD Consumer Barometer is one such indicator (OECD 2021a), showing large but overall synchronous monthly variations of the indicator after February 2020 for Denmark, Finland and Sweden (see Figure 9.2). In practice, consumer confidence declined in Q2 2020, recovered swiftly in Q3 2020 and fell again towards the end of 2020. During most of 2021, consumer confidence was slightly above the average pre-Covid-19 values, though still subject to greater fluctuations and instability than before the pandemic. Notably, it fell again towards the end of 2021. These patterns may reflect uncertainty about the likelihood of new outbreaks, lack of trust in health measures and restrictions and government policies for jobs and businesses.
Figure 9.2. OECD Consumer Barometer for selected Nordic countries.
Source: OECD, Consumer Barometer. Measure: GPSA.
Studies of consumer behaviour using credit card transactional data show that the different strategies deployed to combat the virus in the Nordic countries did not result in significant differences to aggregated consumption levels across the Nordic Region. In examining the effects of lockdowns on consumption habits, Andersen, et al. (2020) found that shutdown policies in Denmark had a modest impact on aggregate spending in comparison to the more liberal control measures adopted in Sweden. These authors analysed credit-card transactions for about 860,000 individuals in both countries from January 2020 to April 2020 and found that aggregate spending dropped by 29% in Denmark and 25% in Sweden. They conclude that the generous subsidies to firms and workers implemented in Denmark “partly offset the negative effect of the social distancing laws” (Andersen et al. 2020, 14).
Regarding the composition of products and services, consumer choices were affected in different ways, as social interactions were reduced due to forced or self-imposed restrictions. At aggregated level, available statistics show that the most negatively affected consumption categories in the Nordic countries were Restaurants and hotels, Recreation and culture, Transport, and Clothing and footwear (Figure 9.3). In analyses of credit card data from Denmark covering 94% of total registered transactions in 2020, Darougheh (2021) also showed a significant drop in purchases of recreation, clothing, transport, and real estate services. Similarly, Andersen et al. (2020) identified public transport, recreation and personal care services, as the categories where the use of credit cards declined the most in both Denmark and Sweden. These findings most likely reflect the restrictions on social gatherings and mobility.
On the contrary, spending on Food and non-alcoholic beverages, Alcoholic beverages, tobacco and narcotics, as well as Communications, increased in 2020 compared to 2019. For example, consumption of telecommunication services grew during the first half of 2020 (Darougheh 2021), likely due to an increased requirement to work from home (see Chapter 7). Spending on product categories such as Education, Health and Furnishing, household equipment and routine maintenance differed between the countries. In general, consumption statistics reflect that people spent more time at home in 2020 than the previous year and, therefore, generated an increase in demand for products and services consumed in the home.
Figure 9.3. Relative change in final consumption expenditure of households by consumption category for selected Nordic economies (2020 over 2019).
Source: Eurostat, table TEC00134.
Consumption-related GHG emissions
Consumption is increasingly seen as a key factor in reducing environmental pressures, and significant changes in lifestyles are considered necessary to reduce the use of resources and meet climate targets (Watson et al. 2021). On a global level, consumption-based greenhouse gas (GHG) emissions are higher than territorial emissions in most developed countries (Wilting and Vringer 2009; Ahmad and Wyckoff 2003). At the same time, the OECD (2021b) shows that variations in territorial (production-based) emissions per capita are greater at regional level than between countries. Production-based GHG emission analyses show that metropolitan regions contribute about 60% of territorial GHG emissions in the OECD countries, but measured per capita, remote rural regions emit three times more per capita than large metropolitan regions. This illustrates the extent of transformations of economic activities required in remote regions.
According to several studies (Heinonen et al. 2013; Pang et al. 2019; Peters, Andrew, and Karstensen 2016; OECD 2021b), income is one of the most important variables in explaining emissions from household consumption, implying a positive correlation between emissions and GDP per capita. Emissions per capita in, e.g. high-income cities will, therefore, contain large additional emissions inherent in the consumption of goods and services, in addition to the directly measured (territorial) emissions. Consumption-based analyses comparing rural and urban areas reveal that urban households have a higher carbon footprint, primarily due to their higher consumption levels resulting from their frequently higher income (Heinonen et al. 2013; OECD 2021a).
The pandemic has had multiple effects on climate-related issues. Of particular interest here is the effect of changes in consumer behaviour on consumption-related emissions. Calculating total GHG emissions in a given area (also known as climate footprint), hence considering territorial and consumption-based GHG emissions, is complicated. The calculation includes the emissions that occur in the country where the product is consumed (e.g., delivery of goods), as well as the emissions associated with the production of the goods (often in a different country). Eurostat, together with the National Statistical Offices from the Member States, are developing a modelling approach to estimate consumption-based GHG emissions based on economic data and information about the emissions created by different types of economic activity within the EU (2021).
This method is based on trade statistics data. Since Eurostat only collects import-export transactions recorded at external borders, the information is only available at highly-aggregated European level. However, several National Statistical offices, like Statistics Denmark, are testing this method to calculate the GHG footprints and consumption-embedded GHG emissions by commodity at the national level. An example is provided below in Figure 9.4. However, this method assumes that the production-related emissions are equivalent to those that would be expected if the product was produced within the EU, under similar technological conditions. Depending on where the imported commodities are produced, this assumption might not be realistic. Further research is underway to address the problems inherent in this methodology by creating a global model (see the FIGARO project). Until then, consumption-related emissions data should be interpreted with caution.
According to Iliev et al. (2021), 62% of total emissions in Denmark can be attributed to household consumption. This equates to 6.97 tonnes of CO2 per person per year. Proportionally, emissions embedded in imported food products made up the largest share of Denmark’s total climate footprint (12%), followed by other transport and communication (e.g., fuel; cars; maintenance of cars, aeroplanes and trains; phones and internet) with 8%. Between 2010 and 2020, the emissions linked to the consumption of goods and services produced within Denmark decreased, while the proportion of emissions by consumption of products produced abroad increased by 12 percentage points in the same period (Iliev et al. 2021). However, Denmark’s consumption-embedded GHG emissions decreased by 2.2% from 2019 to 2020 (from 22.65 million tonnes CO2 equivalent to 22.16 million tonnes CO2 equivalent). As Figure 9.4 demonstrates, this contraction is mostly due to reductions in local emissions in the areas of mobility, energy, recreation and culture, which are somewhat offset by increased local GHG emissions in areas such as food and housing. Still, whereas the food category increased emissions mostly due an increase on the local component, the housing category increased its climate footprint mostly due to the contribution of emissions embodied in imported goods and services. Local emissions in the housing category remained at similar levels as the previous year.
Figure 9.4. Climate footprint of Danish household consumption expenditure by types of use, 2020.
Source: Statistics Denmark 2022, experimental statistics.
Car sales
In most countries, the number of car registrations fell in 2020 compared to 2019. On a global scale, it is estimated that sales of motor vehicles fell by 14% (OICA 2021). In the EU, passenger car registrations during the first three quarters of 2020 dropped by 28.8%. The recovery of consumption during Q4 2020 brought the total contraction for the year down to 23.7%, or 3 million fewer cars sold than in 2019 (ACEA 2021). In the Nordic countries, consumer behaviour was consistent overall with the EU and the rest of the world. However, Iceland, Sweden, Finland, Åland, and Denmark recorded falls of 22%–11% – a far more severe decline than Norway, where the market only fell by 2.0%. The Faroe Islands was the only Nordic country to record more car registrations, up 15.8% in 2020 compared to 2019.
In Finland, Iceland, Norway, and Sweden, there were differences in car registrations in different parts of the country (Map 1). In Sweden and Finland, the position was more or less the same in the whole of the country, with only a few municipalities sticking out. In Finland and Sweden, net increases in car registrations were concentrated in rural areas, while in major urban areas, such as Uusimaa-Nyland in Finland and Västra Götaland and Stockholm in Sweden, car sales fell between 10%–22%. Net increases in Norway were recorded in many municipalities throughout the whole country in 2020 compared to 2019.

Map 9.1. New registered passenger cars, 2020 over 2019.
However, sales did not fall by the same amount for all types of vehicles in 2020. During the pandemic, evidence suggests that the global electric vehicle (EV) market performed much better than vehicles powered by combustion engines. According to the International Energy Agency (IEA), electric car registrations increased by a margin of 41% in 2020 compared to 2019 (IEA 2021a). In this respect, the Covid-19 pandemic may unleash change by affecting emergent sustainability niches. In the mobility sector, low-carbon transport through electrification is an example of one such niche (Kanda and Kivimaa 2020).
As shown in Table 9.1, the Nordic countries are global leaders in vehicle electrification (IEA 2021a). Contributing factors to this position are ambitious electrification targets, policies to phase out combustion engines, tax policies favouring fuel efficiency and electrification (e.g. VAT reductions on EVs in Norway), and parking privileges, to mention just a few (IEA 2021a; Münzel et al. 2019; Wappelhorst 2021).
| Territory | Share of EV vehicles as percent of total car sales, 2020 |
| Norway | 74.8% |
| Iceland | 45.0% |
| Sweden | 32.2% |
| Finland | 18.1% |
| Denmark | 16.4% |
| Europe* | 10.0% |
| China | 5.7% |
| USA | 2.0% |
| World | 4.6% |
Table 9.1. Share of new car sales in 2020 that are plug-in EVs.
Source: Global EV Data Explorer (2021b)
* EU27, Norway, Iceland, Switzerland, and United Kingdom.
Even if growth in the EV market is mainly in urban areas, Nordic rural regions are increasingly regarded as leaders when comparing the proportion of electric vehicles with other European rural regions (Wappelhorst 2021). For instance, the Aust-Agder region in Norway has led the rural electrification movement in Europe and maintained its position during the worst of the pandemic. By contrast, the Swedish rural region of Jämtland and the Finnish region of Etela-Pojhanmaa, both of which were recognised as regional leaders in the EV market in Europe prior to the pandemic (Wappelhorst 2021), did not record growth in 2020.
One possible explanation for the relatively high car demand during the pandemic in Norway may thus lie with the ongoing changes to legislation governing the EV market. Norway’s target of halting all new sales of ICE vehicles by 2025 has been highly successful due to incentive programmes. However, the Norwegian government has decided to scrap some of the incentives by the end of 2021 and by the end of 2022 the VAT exemption will be removed (Elbil.no 2021). The prospect of these regulatory changes may explain why middle and high-income households in Norway may have invested a proportion of their ‘forced savings’ during the pandemic in durables, such as cars, to a greater extent than households in other Nordic countries.
Housing markets
The effects of the pandemic have been apparent in the Nordic housing markets, but the impacts have been different across the countries, both spatially and temporally. Figure 9.5 shows the relative impact of Covid-19 on house prices in the Nordic countries, at the national level. In contrast to the 2008 financial crisis, the onset of the Covid-19 pandemic did not trigger a decline in house prices. On the contrary, in comparison to the steadier increases on year-to-year quarterly house prices experienced during 2019, in 2020 house prices accelerated greatly. During most of 2020, prices increased by more than 5% in relation to the same quarter of the previous year in all Nordic countries except Finland, and by Q2 2021 had increased by 10% in Denmark, Iceland, and Norway. Nordea (2021) notes three potential reasons for the sharp increase in house prices during the Covid-19 crisis: strong economic position of households due to savings driven by changed consumption habits, combined with economic support measures; increased time spent at home, generating greater demand for bigger homes; and older people cancelling plans to move to apartments.
Figure 9.5. Change of property prices in the Nordic housing markets.
Source: OECD, House Price Indices (RHPI). Indicator: Quarterly House Price Index. Measure: Percentage change compared to the same period of the previous year.
At the regional level, Map 9.2 shows that the price spikes described above were not uniform within the countries during the first year of the pandemic. Denmark was the country where prices increased the most. Here, Bornholm, Sjælland and the rural islands of Lolland and Falster recorded relatively high price increases, although many rural areas started from lower absolute prices in 2019. Iceland had the second highest house price rise of all the Nordic countries, with the most marked spikes found outside of the capital region. Most Swedish regions had increases above 15%, with the highest raise in Mellersta Norrland at 21%. All Norwegian regions showed price increases, particularly in Oslo and neighbouring regions. Finland was the only country where some regions experienced a decrease on property prices. This was so in Kainuu, North Karelia and Satakunta (more than 3%), and to a lesser extent in North Savo and Ostrobothnia (below 3%). However, the data in some of these regions frequently point in different directions for single and multi -family dwellings. Often, but not always, the price of flats fell more than it did for houses. Moderate increases are still observed in some of the southern regions, where the major cities are located, and also in Lapland.

Map 9.2. OECD Regional House Price Index. Change 2020Q2 – 2021Q2.
According to Lindquist et al. (2021), lower lending rates, changes in housing preferences and a limited supply of new homes added to price pressure in Norway. Price increases and growth in turnover were more pronounced in the suburbs surrounding Oslo than in the city centre which may reflect a desire for “more space” (Lindquist et al. 2021). This trend has also been evident in other Nordic countries. For example, in Sweden the average price increase for single family houses was comparatively smaller than for apartments during the quarters before the pandemic. By contrast, from the first quarter of 2020 the trend reversed, so that the average price increase for single family houses become greater than the average increase for flats (OECD 2022).
The local dimension in house-price development
During the Covid-19 crisis, urban areas have recorded price increases for both apartments and houses, but with a larger relative price spike for houses in peri-urban areas. A detailed comparison of property prices, whether houses or apartment, at the local level for all Nordic countries was not possible for this publication due to differences in the way that data is collected in the countries. Instead, we explore the price development for single family houses during the pandemic based on the example of Denmark.
Map 9.3 compares the price development of single-family houses between Q4 2019 and Q1 2020 with the price development between Q2 2021 and Q3 2021 for all Danish municipalities. As can be seen in the map, most municipalities experienced higher price increases in 2021, but the extent to which this change was more pronounced differs between municipalities. The increases are highest in the Copenhagen Region, but also in Aarhus and surrounding municipalities, and the peri-urban areas around Vejle. High relative increases are also found in coastal and island municipalities (e.g. Bornholm, Lolland, Svendborg and around the Western part of the Limfjord), though it is worth noting that these municipalities had lower relative house prices to begin with. These patterns may reflect changing preferences for houses, demand for more space and access to recreational areas.
According the Danish Economic Council, in June 2021 (Det Økonomiske Råd 2021), there are several reasons for the very high price increases . The Council argues a lot of people below the age of 40 have been buying for the first time. Households also received extra income during the pandemic in 2020 when the Danish government decided that holiday pay should be made available the same year as it is earned. The Council argues that changing priorities, including the need for more space to work from home, increased focus on access to recreation and nature, and less money spent on foreign travel may all be reasons for the increased demand for houses.

Map 9.3. Price development for single-family houses from 2019Q4-2020Q1 to 2021Q2-2021Q3.
Conclusions
In this chapter, we have investigated changes in overall consumption triggered by the pandemic and the subsequent effects on GHG emissions. We have also taken an in-depth look at car sales and property prices. Overall consumption in the Nordic countries fell, primarily during the first wave of the pandemic. The composition of spending changed, and consumer confidence was subject to greater fluctuations and instability than pre-pandemic. Analyses indicate that reduced and changed consumption was not due to income effects but rather a result of containment measures and the subsequent increase in time spent at home. Data from Denmark showed an overall decrease in consumption-related emissions from 2019-2020. Maintaining these reductions into the future, rather than a return to “business as usual” will be key in meeting climate targets.
The number of car registrations declined in 2020 compared to the previous year, but the electric vehicle market performed significantly better than vehicles powered by combustion engines. This was most pronounced in Norway, perhaps due to changes in legislation for the electrical vehicle market combined with consumption savings in other areas for middle and high-income households. The pandemic also impacted the Nordic housing market, though the changes were experienced differently at different times and in different places. Overall, housing prices increased in all countries, with higher relative increases apparent for single family homes in some areas. In Denmark, several rural areas (e.g., island and coastal municipalities) also experienced relatively high price increases although from a lower level. These changes in demand may reflect a need for more space and closer proximity to nature and outdoor recreation.
Do these changes in consumption and housing during Covid times indicate that the pandemic will change people’s preferences and consumption habits in the long run, e.g. by changing mobility patterns and increasing the attractiveness of living farther from the city centre? These aspects are interesting to investigate alongside with the differences between direct and indirect emissions that are important for regional carbon reducing policies. Whereas urbanity plays an important role when only considering direct emissions, socioeconomic drivers that more directly influence consumption patterns may outweigh these carbon-savings effects when the total GHG emissions are considered (OECD 2021b).
References
ACEA. (2021). “Economic and Market Report: State of the EU Auto Industry – Full-Year 2020.” https://www.acea.auto/publication/economic-and-market-report-state-of-the-eu-auto-industry-full-year-2020/
Ahmad, Nadim, and Andrew Wyckoff. (2003). Carbon Dioxide Emissions Embodied in International Trade of Goods. OECD Science, Technology and Industry Working Papers.
Andersen, Asger Lau, Emil Toft Hansen, Niels Johannesen, and Adam Sheridan. (2020). “Pandemic, Shutdown and Consumer Spending: Lessons from Scandinavian Policy Responses to COVID-19.” ArXiv:2005.04630 [Econ, q-Fin], May. http://arxiv.org/abs/2005.04630
Bounie, David, Youssouf Camara, Etienne Fize, John Galbraith, Camille Landais, Chloe Lavest, Tatiana Pazem, and Baptiste Savatier. (2020). “Consumption Dynamics in the COVID Crisis: Real-Time Insights from French Transaction and Bank Data.” Covid Economics: Vetted and Real-Time Papers, no. 59 (November). CEPR Press: 1–39.
Carvalho, Bruno Pessoa, Susana Peralta, and João Santos. (2020). Regional and Sectorial Impacts of the Covid-19 Crisis: Evidence from Electronic Payments. ECARES working paper 2020–48. Brussels, Belgium: ECARES. www.ecares.org.
Chetty, Raj, John Friedman, Nathaniel Hendren, Michael Stepner, and The Opportunity Insights Team. (2020). The Economic Impacts of COVID-19: Evidence from a New Public Database Built Using Private Sector Data. w27431. Cambridge, MA: National Bureau of Economic Research. doi:10.3386/w27431.
Darougheh, Saman. (2021). “Dispersed Consumption versus Compressed Output: Assessing the Sectoral Effects of a Pandemic.” Journal of Macroeconomics 68 (June): 103302. doi:10.1016/j.jmacro.2021.103302.
Det Økonomiske Råd. (2021). Dansk Økonomi Forår 2021: Aktuel Økonomisk Politik Konjunktur Og Offentlige Finanser Tilbagetrækningsaftalen Tidlig Indsats. https://dors.dk/files/media/rapporter/2021/f21/endelig_rapport/f21_dansk_oekonomi_foraar_2021.pdf
Elbil.no. (2021). “Norwegian EV Policy.” https://elbil.no/english/norwegian-ev-policy/
Eurostat. (2021). “Statistics Explained: Greenhouse Gas Emission Statistics - Carbon Footprints.” https://ec.europa.eu/eurostat/statistics-explained/index.php?oldid=516252.
Heinonen, Jukka, Mikko Jalas, Jouni K Juntunen, Sanna Ala-Mantila, and Seppo Junnila. (2013). “Situated Lifestyles: I. How Lifestyles Change along with the Level of Urbanization and What the Greenhouse Gas Implications Are—a Study of Finland.” Environmental Research Letters 8 (2). IOP Publishing: 025003. doi:10.1088/1748-9326/8/2/025003.
Hodbod, Alexander, Cars H Hommes, Stefanie Huber, and Isabelle Salle. (2020). “The COVID-19 Consumption Game-Changer: Evidence from a Large-Scale Multi-Country Survey.” Covid Economics: Vetted and Real-Time Papers, no. 59 (November). CEPR Press: 40–76.
IEA. (2021a). Global EV Outlook 2021. Paris. https://www.iea.org/reports/global-ev-outlook-2021
IEA. (2021b). Global EV Data Explorer. Paris. https://www.iea.org/articles/global-ev-data-explorer
Iliev, Bogomil, Line Merling Arendt, Peter Rørmose Jensen, and Fenja Søndergaard Møller. (2021). Dansk Forbrug Sætter i Høj Grad Sit Klimaaftryk i Udlandet. 2021:22. DST Analyse. Copenhagen, Denmark. https://www.dst.dk/Site/Dst/Udgivelser/nyt/GetAnalyse.aspx?cid=47752
Kanda, Wisdom, and Paula Kivimaa. (2020). “What Opportunities Could the COVID-19 Outbreak Offer for Sustainability Transitions Research on Electricity and Mobility?” Energy Research & Social Science 68 (October): 101666. doi:10.1016/j.erss.2020.101666.
Lequiller, François, and Derek Blades. (2014). Understanding National Accounts: Second Edition. OECD. doi:10.1787/9789264214637-en.
Lindquist, Kjersti-Gro, Sverre Mæhlum, Bjørn Helge Vatne, and Ella Getz Wold. (2021). The housing market in the pandemic year 2020. https://norges-bank.brage.unit.no/norges-bank-xmlui/bitstream/handle/11250/2760506/staff_memo_6_21---boligmarkedet-i-pandemiaret-2020.pdf?sequence=1&isAllowed=y
Münzel, Christiane, Patrick Plötz, Frances Sprei, and Till Gnann. (2019). “How Large Is the Effect of Financial Incentives on Electric Vehicle Sales? – A Global Review and European Analysis.” Energy Economics 84 (October): 104493. doi:10.1016/j.eneco.2019.104493.
Nordea. (2021). Nordea Economic Outlook 1/2021: The Growth Booster. 1/2021.
OECD. (2021a). “OECD Consumer Barometer.” OECD. doi:10.1787/94670b25-en.
OECD. (2021b). OECD Regional Outlook 2021: Resilience in the COVID-19 Crisis and Transition to Net Zero Greenhouse Gas Emissions. OECD. doi:10.1787/17017efe-en.
OECD. (2022). “Housing Prices (Indicator).” OECD. doi:10.1787/63008438-en.
OICA. (2021). “Sales/Registrations of New Vehicles in Countries Represented in OICA.” https://www.oica.net/
Pang, Melissa, João Meirelles, Vincent Moreau, and Claudia Binder. (2019). “Urban Carbon Footprints: A Consumption-Based Approach for Swiss Households.” Environmental Research Communications 2 (1). IOP Publishing: 011003. doi:10.1088/2515-7620/ab59c5.
Peters, Glen P., Robbie M. Andrew, and Jonas Karstensen. (2016). Global Environmental Footprints: A Guide to Estimating, Interpreting and Using Consumption-Based Accounts of Resource Use and Environmental Impacts. TemaNord, 2016,532. Copenhagen: Nordic Council of Ministers. doi:10.6027/TN2016-532.
Statistics Denmark. (2022). “AFTRYK: Climate Footprint of Danish Consumption (Experimental Statistics) by Types of Use (Causes of Emissions), Industries (Origin of Emissions) and Countries/Economies (Origin of Emissions).” https://www.statbank.dk/AFTRYK
UN, IMF, OECD, UN, WB, and EC. (2008). System of National Accounts 2008. New York: European Commission, European Communities, International Monetary Fund, Organisation for Economic Co-operation and Development, United Nations and World Bank.
Wappelhorst, Sandra. (2021). Beyond Major Cities: Analysis of Electric Passenger Car Uptake in European Rural Regions. Working Paper 2021–10. International Council on Clean Energy Transportation. https://theicct.org/sites/default/files/publications/Ev-europe-rural-mar2021.pdf
Watson, David, Nina Lander Svendsen, Simon Kaarsberg, and Hanna Värttö. (2021). Is Economic Growth Compatible with a Sustainable Nordic Future? TemaNord. Nordic Council of Ministers. doi:10.6027/temanord2021-542.
Wilting, Harry C, and Kees Vringer. (2009). “Carbon and Land Use Accounting from a Producer’s and a Consumer’s Perspective–an Empirical Examination Covering the World.” Economic Systems Research 21 (3). Taylor & Francis: 291–310.
10. Covid-19 and tourism: a game-changer?
Authors: Anna Karlsdóttir and Ágúst Bogason
Maps and data: Oskar Penje

Prior to the onset of the pandemic, there was a concern that some of the more popular destinations in the Nordic countries, as well as internationally, had reached a tipping point due to overtourism (i.e., Sæþórsdóttir, Hall, and Wendt 2020; Viken, A., Nilsen, R., & Olufsen, C. 2020; Ioannides 2019; Oklevik et al. 2019). Overtourism puts pressure on the environment and can cause visible decay in tourist destinations. It is the opposite of responsible tourism, which revolves around developing tourism to make places better to live in and visit (Goodwin 2019).
As borders began to close at the beginning of March 2020, international and intra-regional tourism fell dramatically. Almost overnight, concerns about overtourism were replaced by ‘lack of tourists’. Though this was considered a temporary situation at first, after two years of travel restrictions, the Nordic tourism sector is far from returning to its former strength. Meanwhile, policymakers and developers in tourist destinations try to prepare for a future for tourism that establishes an acceptable balance between economic recovery and social and environmental responsibility – a difficult task under the circumstances. This chapter sheds some light on these processes and situates the Covid-19 tourism crisis in the broader debate about tourism as a sustainable and complementary economic activity in the Nordic Region.
Tourism is defined as a social, cultural and economic phenomenon that entails the movement of people to countries or places outside their usual environment for personal or business/professional purposes. These people are called visitors (which may be either tourists or excursionists; residents or non-residents) and tourism has to do with their activities, some of which involve tourism expenditure. From an economic perspective, tourism is a collection of activities, services and industries that deliver a travel experience comprising transportation, accommodation, eating and drinking establishments, retail shops, entertainment businesses and other hospitality services provided for individuals or groups traveling away from home (UNWTO 2022).
Effects on international and domestic tourism
Tourist flows are subject to seasonal fluctuation, even under normal circumstances. Figures 10.1 and 10.2 show that the evolution in the number of tourists throughout the main tourist months of 2020 and 2021 followed somewhat similar patterns in most of the Nordic countries. The figures show the number of arrivals at tourist accommodation from abroad (Figure 10.1), and from the reporting country (Figure 10.2). The definition of accommodation includes hotels and other short-stay accommodation, campsites, recreational vehicle parks and trailer parks. However, privately owned accommodation, (e.g., cottages, cabins and holiday homes), are not included in the official statistics. Nordic estimates show that almost half of the population has access to a holiday home (via ownership, family or friends) and, therefore, we can assume that the numbers for travelling and tourism within the Nordic Region have been greater than the official accommodation statistics show.
Figure 10.1. Relative change in arrivals of visitors from abroad at tourist accommodations January 2020 - August 2021 compared to same months in 2019.
Source: Eurostat and ÅSUB. The 2021 data for Åland are preliminary.
Figure 10.2. Relative change in domestic visitors at tourist accommodations January 2020 - August 2021 compared to same months in 2019.
Source: Eurostat.
Figure 10.1 shows that the number of foreign tourists was substantially lower in 2020 than in 2019. In addition, the return of at least some international tourists in June/July of 2020 marks a much later start to the tourist season than usual. In some destinations this meant that the normal peak tourism period during spring, summer and autumn was shortened by two to three months. Only a modest recovery can be noted in 2021, which is more pronounced in Sweden and Iceland, and less pronounced in Norway and Finland. The strongest recovery was in Åland, where the number of tourist arrivals from abroad[1]All visitors from outside Åland are consider as arrivals from abroad. Tourism flows to Åland are primarily composed of Swedish and Finnish nationals visiting the archipelago. was higher in July 2021 than in July 2019.
Figure 10.2 shows that, even when the most stringent health restrictions were in place in 2020, people did still travel in their home country. Only Sweden recorded a lower number of domestic arrivals in July 2020 compared to July 2019. The largest rise between the 2019 and 2020 levels was in Iceland, which had over 170,000 more domestic visitor arrivals in 2020 than in 2019. As restrictions to international travel become more stringent, the propensity for travelling within the home region increased. Hence, the distances travelled were shorter than under normal conditions, and the largest share of the journeys took place during national holidays and traditional holiday seasons. Similar to the pattern observed above for international tourists, the main noticeable change between 2019 and 2020 was that the number of domestic travellers in each of the Nordic countries peaked in a shorter period/season, compared to 2019. This can probably be attributed to the role of the gradual relaxing of health measures and travel restrictions in June 2020. However, by August the same year travel restrictions were reimposed in many countries, as the pandemic spread.
Footnotes
- ^ All visitors from outside Åland are consider as arrivals from abroad. Tourism flows to Åland are primarily composed of Swedish and Finnish nationals visiting the archipelago.

Map 10.1. Relative change tourist overnight stays at tourist accommodations January 2020 - August 2021 compared to same months in 2019.
Map 10.1 shows the relative change in the number of overnight stays at the regional level between 2019 and 2020 for foreign and domestic visitors. As the map to the left shows, the sharpest fall in visitors from abroad was in destinations where foreign tourists usually make up a high proportion of the total visitors. This is particularly relevant to islands like Åland (89% decrease on foreign visitors from early 2019 to mid-2020) and to Iceland (66-77% drop depending on region). Lofoten and Nordland County in Norway, as well as Western Norway with Møre and Romsdal, which also have a high proportion of international tourists during the summer season due to their scenic landscape, also recorded sharp falls of 77-79% on foreign visitors during the same period.
In Finland, the lake district (South Savo) and Southern Karelia, as well as the coastal Central Ostrobothnia (major cities Vasa and Karleby), recorded a 75-77% drop in the number of visitors from abroad. The fall here was mainly due to the lack of tourists from Russia. Even Finnish Lapland suffered a major fall in international visits during the winter peak period. For many local businesses that rely heavily on winter holidaymakers, the 2021/22 winter was a make-or-break season (McDougall, 2021). In Sweden, the regions of Kalmar, Västra Götaland, Värmland and Örebro lost 77–79% of visitors from abroad, probably due to much fewer visitors from neighbouring Norway and from Denmark. In Denmark, the number of overnight stays by visitors from abroad to the Capital Region was down by 73%, whereas the number of domestic visitors declined by 27%.
No region lost as many overnight visitors, both from abroad and domestic, as the capital cities and larger urban areas in the Nordic countries. Copenhagen, Oslo, Stockholm, Helsinki and Reykjavik experienced declines of 71–77% for visitors from abroad. Declines were also recorded for domestic tourists (13-45%) in all major Nordic cities but in Oslo, which had 28% more overnight stays by domestic tourists in 2020 than 2019.
There is, however, evidence that remote rural areas in some regions became popular summer destinations in 2020 and 2021. All regions in Denmark, except the Capital Region, as well as Sørlandet (Agder region) in Norway, experienced an increase of local visitors in 2020 compared to 2019, but still the effect was less marked than it was in Iceland. Here, the more remote regions of Vestfirðir had up to 55% more overnight visitors, with the biggest increase in the Northeast (66%) and Eastfjords (110%). In these regions, all types of accommodation (from hotels to camping sites) were fully booked during the summer of 2020 and 2021. For the Eastern region of Iceland, this rise in domestic travel even resulted in a rollout of new accommodations – probably the only place in any of the Nordic countries to experience this kind of boost to its tourism economy during the pandemic. This process might have been boosted by a government incentive programme providing all residents in Iceland with a travel voucher in 2020 and again in 2021 (Ferðamálastofa 2021).
From constant growth to ‘full-stop’
The Nordic countries enjoyed unprecedented growth and development of new niche products and services within tourism up until the beginning of 2020, albeit with major regional variations. While some destinations have become well-established after evolving over a long period, others gained sudden popularity, especially over the last decade. The concept of a Tourism Area Life Cycle (TALC) perspective (Butler 1980; Butler 2009; Kristjánsdóttir 2016; McKercher and Wong 2021) allows for an understanding of tourist areas as dynamic in that they evolve and change over time. The model defines patterns and stages in the evolution of tourist areas that are not necessarily linear (Figure 10.3). For example, in an OECD study of 202 countries and territories, 162 of them displayed a pattern of multiple lifecycles (McKercher and Wong 2021).

Figure 10.3. Hypothetical evolution of a tourist area: Tourism Area Life Cycle (TALC).
Source: Richard Butler, 1980.
Bearing in mind that local and regional economies are complex multi-layered systems, defining definitive stages for tourist areas is complicated and is, in essence, a simplification. Nevertheless, placing tourist regions in TALC stages showcases some general characteristics and challenges for destinations dependent on tourism, whether in the early stage (exploration), consolidation (the peak stage) and beyond, as part of an evolutionary economic process. This perspective allows us to pay attention to the long-term processes of change in the spatial economy, with an empirical focus on individuals and companies at regional level, as environments in which evolutionary processes operate. Thus, tourism is seen as an activity that creates and develops productive spaces with a focus on the role of tourism demand as the main driver of economic and spatial change (Brouder et al., 2016).
In a Nordic context, Greenland can be described as an emerging tourism region, where nature-based tourism is the main attraction. Even if cultural and leisure activities offered in major locations like Nuuk or Ilulissat can be considered to be in a growth phase, the high cost of infrastructure expansion creates a barrier to tourism. Large expanses of Greenland remain entirely inaccessible due to few international air connections and limited road infrastructure. Thus, with fewer than 100,000 visitors per year, Greenland remains one of the least visited destinations in the western hemisphere. However, Greenland’s situation as a relatively expensive destination enables its status position of a ‘rare gemstone’ for visitors (Bogason et al. 2021).
The exponential growth in the influx of tourists to Iceland up to 2020 places it among the top 20 worldwide destinations that have enjoyed a single unbridled period of growth during the first two decades of 21st century. In this period, Iceland progressed through long exploration and discovery phases before visitor numbers rose rapidly since around 2004 (Mckercher & Wong, 2021). The same can be observed in the Åland Islands, a mature destination embodying a small economy with high dependency on visitors from abroad. Tourism for Iceland and Åland evolved over very different time frames, but both economies share a high dependence on international tourism. This results in greater economic vulnerability in times of crisis, such as the almost complete cessation of international travel prompted by the pandemic (Karlsdóttir & Sánchez Gassen, 2021).
While the large metropolitan tourism destinations lost the highest numbers of visitors during the first waves of the pandemic in 2020 and 2021 (the capital cities lost 71–77% of their visitors due to Covid-19 in the period 2020–2021), the relative economic impact was not as severe as in other tourist destinations due to greater diversification and resilience. Copenhagen, for example, suffered a major loss of visitors but, as a mature destination in the process of turning away from a prime focus on growth to more responsible tourism, the overall impact on the city’s economy was not as serious as in regions more dependent on tourism revenue. Certain sectors in the city, like accommodation and restaurants, did suffer, of course, but overall, the economic impact was not as significant as in many other cities. Copenhagen, as a destination that has gradually built-up tourism maturity, has made significant efforts to become a better place to live and visit. These changes have included initiatives to develop tourism outside the core city centre and traditional tourism hotspots, diversification of experiences and an improved geographical spread of visitors in the city to facilitate a more positive overall experience for both locals and visitors (Christensen et al. 2018). Copenhagen can, therefore, be seen in the Butler’s TALC taxonomy as a mature destination on a trajectory towards rejuvenation as an urban destination.
The pandemic – a roller coaster ride for the tourism sector
As larger proportions of the population become vaccinated and borders slowly began to open in 2021, the main concern for many tourism bodies has been to outline and implement strategies for the sector to bounce back stronger (Bændasamtök Íslands, 2021). In some cases, regional strategies that were already being revised have prioritised a more environmentally, carbon neutral approach. Priorities include extended tourism seasons, spreading out tourists geographically, encouraging longer stays, focusing on the local benefits of tourism, and developing the sector in harmony with the local population. While strategies encouraging more responsible tourism were already gaining traction, the pandemic presents an opportunity to amplify this trend, both to reduce economic dependence on tourism as well as to meet visitor and the local populations’ requirements for more socially and environmentally sustainable tourism.
As in other developed economies, tourism authorities in the Nordic countries face two major parallel challenges, each quite different in nature and implications. The first and most stringent challenge is addressing the short-term economic impacts of the pandemic on the tourism industry. The actions taken by national authorities to “flatten the curve” have triggered crises in this sector. As described in the previous sections and illustrated by data on credit card transactions (see box), shorter stays and less spending have impacted communities that depend on this industry (see also Chapter 8).
For the large cities as well as specific areas and regions, spending by tourists from abroad makes up substantial income that can be considered as an equivalent to export revenues. For most of the Nordic countries, spending on credit cards issued abroad rose almost constantly from 2016, but dropped significantly in all of them in 2020 (see Figure 10.4 and 10.5). The biggest drop was in Norway, falling more than two thirds from 2019. The country that was less affected is Sweden, where spending also fell in 2020 but to a lesser extent than in other countries.
Figure 10.4. Spending on credit cards issued abroad, 2019 and 2020. Billion euros.
Source: European Central Bank; Central Bank of Norway; Central Bank of Iceland.
Figure 10.5. Spending on credit cards issued abroad, Indexed change 2016–2020 (2016=100).
Source: European Central Bank; Central Bank of Norway; Central Bank of Iceland.
The second challenge concerns climate change, which has triggered extensive global commitments to a green transition and a more sustainable economy, including tourism. Consumers are also increasingly demanding more sustainable products, which in turn encourages investors and business sectors to move towards more environmentally-friendly practices. In the Nordic countries, much of the tourism sector was already evolving in this direction. However, the Covid-19 pandemic may have accelerated the process in some ways. In particular, the pandemic has undoubtedly provoked a shift in behaviour among travellers and perhaps also an adjustment in travelling values. One clear impact in international travel has been the introduction of vaccination certification as compulsory for travellers. Success in the tourism economy will be judged on the extent that these two crises are addressed, now and in the future.
Restrictions on cross-border mobility have been a boost to domestic and rural tourism. Entrepreneurs who identified this need reoriented and adapted to the new reality, and their service provision has thrived. This has, in turn, led to an increase in the popularity of several rural tourism destinations and less-visited areas (yle, 2020; House of Lapland,2021; Fredriksson, 2020; Fredriksson, 2021). While expectations for staycations[1]A staycation can be defined as a vacation in which one does not travel away from home. were high in summer 2020, domestic arrivals did not compensate for the loss of income from international tourists in, for example, Västerbotten (Sweden) and Lapland (Finland). There is still much to be done to ensure robust tourism and hospitality services function as stable income streams in the future.
While the temporal mobility between work, leisure and travelling that tourism entails can assume different forms, the actual distance travelled is one of the main shifts that post-pandemic times must address. The introduction of vaccine passports, need for testing and other documents, and uncertainty around travel restrictions are likely to increase domestic tourism and travel to neighbouring countries. At the same time, long-haul travel by Nordic residents may decline, not only because of health measures and travel restrictions, but also due to the climate challenge. The availability and cost of flights may also be a factor as it remains to be seen how, or even if the airline industry will recover to the activity levels of pre-2020. The green transition requirements must be addressed and will hopefully become guiding criteria for tourism investments, influencing the choice of priorities and management at various levels and thus contributing to a more sustainable development.
Similarly, whether certain types of urban tourism, like extended weekends in capital cities or other larger urban areas, are a thing of the past remains to be seen. Mass events, such as outdoor concerts drawing thousands of people to one place, may also change. Both the size of the audiences and the geographical distance they travel could be reduced. Social distancing measures, compulsory registration and the need to present various documents for inspection may also adversely affect large cultural events and audiences. Some analysts believe that smart cities are the way forward in post-pandemic travel, aiding the visitor experience, mitigating the effects of overtourism and leading to more sustainable management (GlobalData Technology 2021; Goessling et.al, 2020; Sharma et.al., 2021). Digital vaccine passports were meant to ensure the safe recovery of international travel post-pandemic but only provided free movement for a limited time before new variants emerged and some countries reintroduced travel restrictions, even for those previously vaccinated. However, introducing regenerative tourism to aid hard-hit tourism businesses after two years of little or no income requires special effort. With businesses adapting to consumer preferences post-pandemic, this will bring further opportunities for destination marketing organisations to work with local stakeholders and draw up more responsible tourism policies post-pandemic (Bonhill-Smith 2021). After two years of Covid-19, it could be said that the only conviction regarding the tourism industry is that it will face uncertainty over the next few years.
Conclusions
Inclusive, place-based development is a key component that resonates well with UN Sustainable Development Goals and with the Copenhagen approach to liveable cities (2018). Governments will continue to have a role to play in lending the necessary support to this principle. Retaining the structure and framework that make up the tourism value chain through what may become a prolonged crisis will be crucial. On a destination-management level, maintaining brand values and creating the conditions and infrastructure that can make tourism and liveability become a natural fit rather than a contradiction in terms will be very important. Climate consciousness among travellers, international agreements on more sustainable development and the value of a ‘sustainable product’ are already pushing the tourism sector in this direction.
To restore confidence and facilitate recovery, it is also important to highlight the role of tourism as a catalyst for building diverse and thriving communities. For that purpose, tourism businesses need to be more aware of local products and services and aim to embed themselves regionally and locally. We have seen that where tourism is a complementary activity to other economic sectors, businesses are less vulnerable because they have a range of income sources instead of depending solely on visitor spending. These principles would make tourism economies less volatile, and tourism activities would contribute to the resilience and robustness of regions and places that receive visitors. Promoting the qualities of longer stays as a valuable basis to rethink tourism is seen as a necessary enabler for sustainable tourism (Bogason et al., 2020).
Staying longer and spending more is an emerging trend among inbound tourists arriving in Iceland in summer 2021. One of the big attractions, the volcanic eruption in Reykjanes peninsula, drew many North American, fully vaccinated visitors as the first international travellers to return to Iceland. Compared to earlier years, they spent more money on overnight stays, stayed longer, travelled more around the country and paid for more recreational activities (Ingvarsdóttir 2021). This fuels hope for a shift in international travel behaviour.
Overall, it is difficult to forecast how tourism and travel will evolve given that the pandemic may continue in waves and mutations, causing loosening and tightening of regional and international travel restrictions from time to time. Tourism stakeholders hold onto the hope that they may yet bounce back to business as usual at some point. Official bodies and stakeholders will have to work with different time frames, strategies, and scenarios when navigating a market so prone to uncertainty. The effects on travel behaviour, economy, industry, and the Nordic regions will be different whether we look three years ahead or a decade.
References
Bændasamtök Íslands, (2021). "Hvernig endurræsum við íslenska ferðaþjónustu?" Bændablaðið - Tímarit Bændablaðsins. 2021 (1):38-43. Bændasamtök Íslands.
Bogason, Àgúst, Anna Karlsdóttir, Rikke Brandt Broegaard, and Rikke Brandt Broegaard. (2020). Planning for Sustainable Tourism in the Nordic Rural Regions. Nordregio. doi:10.6027/R2020:12.1403-2503.
Bogason, Àgúst, Anna Karlsdóttir, Rikke Brandt Broegaard, Johanna Carolina Jokinen, and Johanna Carolina Jokinen. (2021). Planning for Sustainable Tourism in the Nordic Rural Regions - Cruise Tourism, the Right to Roam and Other Examples of Identified Challenges in a Place-Specific Context. Nordregio. doi:10.6027/R2021:1.1403-2503.
Bonhill-Smith, J. (2021). Slower Travel Methods Could Be The Next Big Tourism Trend As Sustainability Features More Heavily In Consumer Decisions. https://www.hospitalitynet.org/news/4104634.html
Brouder, Patrick, S. Anton Clavé, and Dimitri Ioannides, eds. (2016). Why Is Tourism Not an Evolutionary Science?: Understanding the Past, Present and Future of Destination Evolution. New Directions in Tourism Analysis. New York, NY: Routledge.
Butler, Richard. (1980). “The Concept of a Tourist Area Cycle of Evolution: Implications for Management of Resources.” The Canadian Geographer / Le Géographe Canadien 24 (1): 5–12. doi:10.1111/j.1541-0064.1980.tb00970.x.
Butler, Richard. (2009). “Tourism in the Future: Cycles, Waves or Wheels?” Futures 41 (6): 346–352. doi:10.1016/j.futures.2008.11.002.
Christensen, S.M., Juhlin, C., & Rifbjerg, A. (2018). I SAMTALE MED KØBENHAVN – En Kvalitativ Analyse Af Balancen Mellem Turisme Og Hverdagsliv i København. Wonderful Copenhagen 2018. https://www.wonderfulcopenhagen.dk/wonderful-copenhagen/videncenter/i-samtale-med-koebenhavn
Ferðamálastofa. (2021). The Icelandic Tourist Board. https://www.ferdalag.is/
Fredriksson, Johanna. (2020). Turismen kan öka i Västerbotten i sommar. Umeå Universitet.26.Juni 2020. https://www.umu.se/nyheter/turismen-kan-oka-i-vasterbotten-i-sommar-_9301965/
Fredriksson, Johanna. (2021). "Turismen kommer återhämta sig hyfsat snabbt efter pandemin", Umeå Universitet, 01.july.2021. https://www.umu.se/reportage/turismen-kommer-aterhamta-sig-hyfsat-snabbt-efter-pandemin/
GlobalData Technology. (2021). Smart Cities are the next step for urban tourism post pandemic. Business analysis. April 6.2021. https://www.verdict.co.uk/tourism-smart-cities-covid/
Gössling, S., Scott, D. & Hall, M. C. (2021). Pandemics, tourism and global change: a rapid assessment of COVID-19, Journal of Sustainable Tourism, 29:1, 1-20, DOI: 10.1080/09669582.2020.1758708
House of Lapland. (2021). Big regional differences in Lapland's summer tourism. https://www.lapland.fi/business/big-regional-differences-in-laplands-summer-tourism-finlands-covid-19-situation-causes-uncertainty-for-the-winter-season/
Ingvarsdóttir, Þóra Birna. (2021). Viðskipti: Stoppa Lengur Og Eyða Meiru. at https://www.mbl.is/vidskipti/frettir/2021/06/21/stoppa_lengur_og_eyda_meiru/.
Karlsdóttir, Anna & Nora Sánchez Gassen. (2021). Regional Tourism Satellite Accounts for the Nordic countries. Nordregio Report 2021:2 doi:10.6027/R2021:2.1403-2503.
Kristjánsdóttir, Helga. (2016). “Can the Butler’s Tourist Area Cycle of Evolution Be Applied to Find the Maximum Tourism Level? A Comparison of Norway and Iceland to Other OECD Countries.” Scandinavian Journal of Hospitality and Tourism 16 (1): 61–75. doi:10.1080/15022250.2015.1064325.
Mac Dougall, David. (2021). Finnish Lapland fears Europe's COVID surge could hit its Christmas season, Euronews, 25.November 2021. https://www.euronews.com/2021/11/25/finnish-lapland-fears-europe-s-covid-surge-could-hit-its-christmas-season
McKercher, Bob, and IpKin Anthony Wong. (2021). “Do Destinations Have Multiple Lifecycles?” Tourism Management 83 (April): 104232. doi:10.1016/j.tourman.2020.104232.
Sharma, G. D., Thomas, A., & Paul, J. (2021). Reviving tourism industry post-COVID-19: A resilience-based framework. Tourism management perspectives, 37, 100786. https://doi.org/10.1016/j.tmp.2020.100786
UNWTO. (2022). “Glossary of Tourism Terms.” https://www.unwto.org/glossary-tourism-terms.
yle. (2020). Blir det här de inhemska resmålens sommar? Efter en tuff vår har de små aktörerna en chans: "Nu är det upp till bevis för turismen i Finland" 15.05.2020. https://svenska.yle.fi/artikel/2020/05/15/blir-det-har-de-inhemska-resmalens-sommar-efter-en-tuff-var-har-de-sma-aktorerna
Footnotes
- ^ A staycation can be defined as a vacation in which one does not travel away from home.
11. Conclusions
Covid-19: From crisis to opportunity for the Nordic Region
Author: John Moodie

The Covid-19 pandemic remains a devastating global public-health, economic and social crisis. The historian Willian H. McNeill, writing in his seminal 1976 book ‘Plagues and People’, argued that health crises often mirror societies (McNeill, 1976). This logic is reflected in the Nordic Region, where the policy response to the pandemic has been largely driven and shaped by different national traditions, cultures, norms and values (Lanzano, 2020; Strang, 2020; Dewan, 2021; Moodie, 2021a). Indeed, there have been no one-size-fits-all policies or collaborative response to the crisis within the Nordic Region (Enestam, 2021). While it is too early to ascertain the overall extent of the socio-economic damage caused by the crisis and the effects of the different national policy response measures introduced, the State of the Nordic Region 2022 provides an important snapshot of the impact of Covid-19 across different Nordic countries and spatial scales. This final chapter takes a bird’s-eye perspective across the Nordic Region as a whole, examining some of the broader trends that have emerged during the pandemic, or been exacerbated by the crisis. The chapter assesses how these trends will impact the future direction of policymaking in relation to the implementation of the three core pillars of the Nordic Vision 2030 – a socially sustainable, green, and competitive Nordic Region. Finally, the chapter reflects on the extent to which the crisis represents a catalyst and window of opportunity to re-examine the role of Nordic cooperation as an essential tool for recovering from the pandemic and enhancing regional resilience against future shocks.
Covid-19 has held up a mirror to the Nordic Region, exposing both strengths and challenges. The findings highlighted in this report indicate that the Nordic Region has shown remarkable resilience in withstanding the threats posed by the health crisis and is well placed to make a rapid recovery. However, the crisis has also brought to light significant societal inequalities that need to be addressed if the Nordic Region is to meet its vision to become the most sustainable and integrated region in the world by 2030. The overall Nordic strengths and challenges identified within the report are outlined below.
Nordic strengths and opportunities
-
The Nordic Region has shown considerable economic resilience during the crisis. As Chapter 8 shows, the economic repercussions of the pandemic have been less severe in the Nordic countries than for other European economies. The GDP contraction was -3.0%, compared to -5.9% in the EU-27. Overall, the decline in the Nordic Region was in line with the global average (-3.1%). However, the economic impacts have been quite asymmetric across Nordic countries. With a GDP contraction of -7.1% in 2020, Iceland was the country that suffered the most. Finland (-2.3%) and Sweden (-2.9%) ranged close to the Nordic average. Denmark (-2.1%) and Norway (-0.8%) were less severely affected. The strength of the Nordic economies and welfare systems allowed governments to introduce economic mitigation and financial support measures that helped limit the damage of the pandemic, including wage subsidies, tax deferrals, and support for small and medium-sized enterprises (SMEs). These measures reduced the potential for irreversible consequences, such as business closures and permanent job losses. Strong national economies with low public debts made it possible to increase support measures without major financial consequences. Indeed, despite the high levels of public expenditure, overall national budget deficits remain under control. In the short term, this economic stability has helped the Nordic economies bounce back quickly from the crisis. However, the health crisis is not over yet, and uncertainties related to the new virus variants may cast doubt on the capacity of the Nordic economies to cope with a long-term Covid-19 pandemic.
-
Covid-19 related deaths are relatively low in the Nordic Region compared with Europe as a whole. The highest number of excess deaths in 2020 were found in Sweden (8%) and Åland (7%), but in Åland the excess deaths were not caused by Covid-19. In Greenland, Finland, Iceland, and Denmark, the figures ranged from 2–4%. Norway did not register any excess deaths. The low number of excess deaths during the pandemic can largely be explained by the tough early lockdown measures introduced in most Nordic countries; however, it can also be attributed to the high levels of access to quality public healthcare and the high levels of public health among the population prior to the crisis. The Nordic countries have long ranked at or above the European average on key health indicators, including life expectancy, avoidable mortality, chronic disease morbidity, obesity and self-rated health among OECD countries (OECD, 2019). Overall, population growth, number of births and life expectancy have been relatively unaffected by the crisis. There has been a small increase in life expectancy in most Nordic countries. In Iceland, Norway, Finland, Denmark and the Faroe Islands, life expectancy increased for both sexes in 2020. In Sweden, life expectancy declined by 0.7 years for males—from 81.3 years to 80.6—and for females by 0.4 years—from 84.7 to 84.3 years. The number of births increased in large parts of the Nordic Region during the pandemic (Greenland and Sweden are exceptions). This has been attributed to, amongst other things, the generous maternity/paternity benefits offered under the Nordic welfare model.
-
Changing mobility and consumption patterns have led to environmental benefits. The lockdowns introduced to limit the spread of the Covid-19 virus have resulted in large increases in the number of people working from home and significant decreases in commuting, foreign travel and public transport use. Evidence from Denmark suggests that this, together with an overall decrease in household consumption, has resulted in reduced GHG emissions, as shown in Chapter 9. Household consumption is a large contributor to GHG emissions (e.g., in Denmark, it comprises 62% of total emissions). Consumption behaviour is also closely related to income levels – i.e., the higher the income, the higher the consumption. Income levels are, therefore, a key variable when considering policies for reducing GHG emissions. Chapter 9 also indicates that there has been an increase in the number of purchases of electric vehicles (EV) during the crisis. Norway, Iceland, Sweden, Finland and Denmark top the global classification of EV sales in 2020, along with the Netherlands.
-
Sectors and workers have shown remarkable adaptability in the shift towards remote work. This change was made easier in the Nordic countries due to a growing trend of remote working that preceded the pandemic, especially in knowledge and IT-intensive sectors (Chapter 7). The highest proportion of jobs that can be done from home is found in the largest urban areas, where knowledge-based and IT businesses are predominantly located. Access to high-speed broadband connectivity throughout much of the Nordic Region is one precondition that has enabled such a successful shift to remote work.
-
Opportunities for sustainable tourism. The challenges associated with travelling abroad throughout the crisis resulted in an increase in domestic tourism. As noted in Chapter 10, rural areas became popular destinations for staycations, and rural tourism began to thrive as entrepreneurs reorientated their business models to adapt to the opportunities presented by increased local tourism. In addition, evidence from Iceland suggests that when international tourists did return, they stayed longer and invested more in local economies than was typical pre-pandemic. Together, these trends present a real opportunity to address over-tourism and further promote sustainable tourism throughout the Nordic Region.
-
High levels of internal mobility support rural revitalisation. The crisis has resulted in significant increases in internal migration, with people responding to the pandemic and shutdowns by increasing mobility within their own countries. Although further research is needed to understand the precise nature of these trends, Chapter 4 identifies some evidence of counter-urbanisation. The number of people moving away from the capital regions increased, as did the population in several rural regions. The opportunity to work remotely has resulted in more people spending time in their second homes, which are often located in rural areas. These developments lay the foundation for the revitalisation of Nordic rural areas, but as Chapter 7 indicates, such transformation is largely dependent on improved digital and broadband infrastructures, which are essential for remote work and encouraging businesses to remain in or set up in rural areas.
Nordic challenges
-
The Covid-19 crisis has produced asymmetric health and social impacts across the Nordic Region. Significant inequality between different income groups has been exposed, especially within socio-economically deprived urban and rural regions. Following global trends, the crisis has hit the most vulnerable groups in Nordic society hardest, including the elderly, low-income groups, and immigrant communities. As shown in Chapter 2, the virus has caused a higher number of deaths among elderly people, particularly those living in care homes in Sweden. Higher death rates have also been recorded in immigrant communities in Sweden, Norway and Denmark, characterised by high-density living and where most people work in low-income service sectors jobs, which placed people at greater risk of contracting the virus. Families who were already vulnerable before the pandemic (single parents, low-income groups, immigrants in crowded housing etc.) have found the pandemic, social distancing and home schooling more stressful than more affluent families. Vulnerable groups were also more likely to lose their jobs permanently or temporarily.
-
The hardest hit sectors were the service sector, tourism and export-based manufacturing. In line with global trends, the service sector (retail and culture), tourism industry, and export-based manufacturing industries have been the most severely hit by the crisis across the Nordic Region (Chapter 8). Many sectors had to adjust production levels due to changes in supply and demand, and this had a severe impact on employment levels at the start of the pandemic. As Chapter 7 shows, home working opportunities were severely limited in occupations requiring face-to-face contact, including the service industries, social care, construction, manufacturing and transport sectors. Most of these occupations are at the lower end of the education and qualifications spectrum. This contrasts with high levels of home working in knowledge-driven sectors requiring higher qualifications and providing higher incomes. An urban-rural split has also been identified in relation to the potential for remote working, as rural areas are dominated by traditional industries that require a physical presence, such as agriculture, forestry and fisheries. These differences highlight the vast inequality of opportunities between those in low-income versus high-income positions.
-
Unemployment increased during the crisis. Despite government intervention reducing the number of job losses, there have still been significant layoffs across the Nordic Region. Chapter 5 highlights that layoffs were most prominent in larger cities and metropolitan areas with a higher proportion of service-sector jobs. Regions where the economy is focused on tourism and manufacturing also saw increased layoffs due to border closures and decreased supply and demand. Unemployment has disproportionately hit young adults and non-EU migrants working in low-income, service-sector jobs in the gig economy, where the opportunities for home working are limited.
-
Housing markets boomed during the pandemic. During the pandemic, house prices have been rising quickly, with citizens keen to take advantage of low rates on loans. As Chapter 9 highlights, house prices increased across the Nordic Region except in the most rural areas of Finland. By contrast, price rises in the more rural regions in Iceland and Sweden increased more than in urban areas. In particular, rural areas close to big cities saw substantial increases in the price of detached and single-family houses, which suggests that people sought dwellings more suitable for isolation and working from home. The increased demand for houses in rural areas may also be explained by the attractiveness of having more space and closer proximity to nature and outdoor recreation. While the strong demand for larger properties and increases in housing prices have boosted the Nordic economies, it has also become more difficult for young people and less affluent families to enter the housing market. This raises the need for more affordable housing opportunities across the Nordic Region.
-
Gender disparities have been highlighted from both a health and social perspective. From a health standpoint, Covid-19-related deaths have been significantly higher amongst older males across the Nordic Region (see Chapter 2). From a social outlook, Chapter 4 highlights the ways in which the closure of schools and childcare facilities in some countries (e.g., Denmark and Norway) and the introduction of home office requirements placed additional pressure on individuals and families, particularly in low-income households, increasing overall stress as well as anxiety and depression levels. Initial research indicates that women shouldered a larger share of the additional childcare burden. More research is needed, however, to elucidate the short- and long-term impact of the pandemic on gender equality in the Nordic countries.
-
Cross-border mobility ground to a halt. The crisis has had serious implications for mobility in the labour market and across borders. As shown in Chapter 4 and Chapter 6, Nordic cross-border regions saw significant decreases in labour mobility as border closures and travel restrictions made cross-border working difficult, leading some commuters to leave their jobs temporarily or permanently. Indeed, formal barriers to cross-border working were evident during the crisis, including the introduction of strict travel restrictions, heterogeneous national policies related to remote work and furlough schemes, and national differences in tax legislation and labour market policies. Migration was also affected by the restrictions as there were declines in both immigration to and emigration from the Nordic countries. Net immigration was the smallest since 2005, shortly after the EU enlargement. In 2020, immigration fell by 21% and emigration by 9%. Based on the monthly data for Sweden in 2021, immigration will be about half of the average for the previous 5 years and emigration about 90%. Based on quarterly data for 2021, both immigration and emigration in Denmark will be about 20% below average, and immigration in Iceland will be about 10% lower.
-
The pandemic has affected international tourism severely. Border closures have dramatically affected international tourism to popular Nordic tourist destinations, particularly capital cities and other metropolitan areas, which saw large reductions in the number of tourist visits. The decline in international tourism was a result of border closures, which saw significant reductions in international air and ferry passengers and a dramatic decline in the number of passengers travelling across borders in cars and by rail. As Chapter 10 shows, a reduction in international tourism contributed directly to decreases in foreign expenditure, which makes up an important export value income for the national economies in the Nordic Region. The impact of declining tourism has been particularly devastating for countries such as Iceland and Åland whose economies are heavily reliant on international visitors. Although domestic tourists sometimes spend more capita than international tourists, the decline in international tourism points to the need for diversifying the economy in these heavily affected regions.
-
Divergent containment policies and border closures fuelled a decline in trust and social capital. As Chapter 6 highlights, informal barriers to cross-border working such as different national norms, values and cultural perceptions have been exacerbated by the crisis. Cross-border commuters, students and other Nordic employees working in a non-native Nordic country have faced ‘corona shaming’ from colleagues or been ostracised and isolated in office settings due to concerns about different national laws. These issues have badly affected Nordic border regions, dividing families, friends and businesses and reducing the high levels of trust that are the cornerstone of Nordic cross-border co-operation and competence mobility.
Covid-19 as a catalyst for Nordic policy change and transition
The Covid-19 crisis can act as a catalyst for transformational policy change within the Nordic Region and presents a window of opportunity to strengthen health and welfare systems, enhance digital technology and accelerate the shift towards a carbon-neutral economy and society. Policymakers at the national, regional and local levels need to go beyond short-term thinking and work together to ensure that recovery responses and public investment funds are closely aligned with long-term, post-pandemic policy priorities around sustainability and social inclusion. The findings outlined in this report highlight particular areas that Nordic policymakers must address in meeting the three main strategic priorities of the Nordic Vision 2030—creating a socially sustainable Nordic Region, a green Nordic Region and a competitive Nordic Region. Based on these findings, this section highlights future policy directions that present the greatest opportunity to address each goal of Vision 2030 as the Nordic Region emerges from the crisis.
Inclusive labour markets, affordable housing, and well-functioning care systems
A socially sustainable Nordic Region is inclusive, equal, and cohesive with shared values, cultural exchanges, and increased welfare. The challenge for Nordic policymakers is to harness new technological processes for promoting economic and social change in a way that promotes fairness, social justice, and opportunity for all. A socially sustainable transition is one that ensures that no one is left behind by the forces of globalisation and that all people can participate in and benefit from the digital and green transitions. The Covid-19 crisis has exposed and exacerbated existing socio-economic inequalities across the Nordic countries, cities, and regions. As this report shows, the socio-economic impact of the pandemic has hit the most vulnerable groups in society hardest, particularly young people, the elderly and immigrants living in deprived urban and rural areas or working in low-income, service-sector jobs. It is essential that Nordic policymakers work to reduce these inequalities to help protect the most vulnerable groups in society from future crises.
The labour market impacts of the pandemic have been highly selective, with vulnerable groups much more likely to be temporarily or permanently unemployed. Workers in service-sector jobs require greater contractual stability and improved rights during crisis periods. In addition, people with few qualifications should be given the tools to succeed in knowledge and technology-driven economies by offering re-skilling, up-skilling and lifelong learning opportunities.
The rise in house prices indicates the relative strength of the Nordic economies; however, new housing preferences may have negative implications for existing communities, and high prices overall can make it difficult for younger people and newly arrived immigrants to get a foot in the housing market. Ensuring access to affordable housing requires a solid understanding of how housing markets in different locations are responding to the changing circumstances brought about by the pandemic. Alongside this, a strong commitment is required to policies that promote an adequate supply of the right types of housing in the appropriate locations.
Most importantly, as life expectancy continues to rise in the Nordic countries, policymakers need to find effective measures for reorganising the delivery of health and social care. The pandemic has highlighted the need to reassess the organisation of elderly care to support health and welfare services and protect elderly people. There is also a requirement to focus on increasing investment in the treatment of mental health issues caused by stress, anxiety, and depression.
Working from home, environmentally conscious consumption, and sustainable tourism
A green Nordic Region promotes the green transformation of our societies, as well as carbon neutrality and a sustainable, circular, and bio-based economy. The challenge for Nordic policymakers is to harness the aspects of behavioural change brought about by the crisis that have the potential to support the green transition and pursue strategies through which these behaviours can be maintained in pursuit of longer-term environmental goals.
As the report highlights, working from home during the pandemic has led to changes in work mobility that have the potential to decrease the use of fossil fuels and lower greenhouse gas emissions. Realising these gains in the long-term will require a nuanced understanding of how working from home relates to other lifestyle choices, for example, the demand for larger dwellings further from the city centre. The ability of urban and regional policy to respond to such changes will be vital in ensuring environmental benefits become an important incentive for a longer-term shift towards increased remote working.
Vehicle electrification has also accelerated during the pandemic as middle and high-income earners channelled savings in other consumption areas into the purchase of more environmentally friendly vehicles. The Nordic Region remains a forerunner with regards to vehicle electrification and will retain this status in the longer term by offering incentives to buy electric vehicles. Electrification processes also have the potential to create new jobs and enhance the competitiveness of the Nordic Region.
The report has also indicated the huge potential for increased green or nature-based tourism as a driver of economic and spatial change. Climate consciousness among travellers, international agreements on more sustainable development, and the value of a ‘sustainable product’ are also pushing the tourism sector in greener directions. This can be further promoted by developing the staycation industry through increased financial support for rural tourism businesses and ensuring that the regional tourist industry is locally embedded and meets the needs of the community by investing in and promoting local products and services.
Diverse regional economies, open borders, and well-connected communities
A competitive Nordic Region is built on knowledge, innovation, mobility and digital integration. While the financial support provided by governments has limited the economic damage of the crisis in the short term, the long-term damage to Nordic economies and competitiveness remains uncertain. As society and borders reopen, we will see some of the more affected sectors recuperate. This recovery is likely to be uneven, however, with some sectors likely to overcome the damage caused by the pandemic quicker than others. The service sector and tourism industries will be revived as consumer confidence grows. However, the competitiveness of manufacturing industries remains under pressure from continued disruptions to supply chains and the ongoing process of technological change. The vulnerability of some sectors highlights the importance of diverse and balanced regional economies to ensure economic resilience in times of crisis. Here, resilience can be enhanced through the development of stakeholder and citizen-led, place-based policy strategies built around areas of regional economic strength and opportunity.
Ensuring the free flow of people, goods and services across borders is essential for Nordic economic growth and competitiveness. The closure of borders and travel restrictions has negatively impacted Nordic cross-border labour markets and the skills-supply in general. It will be important to rebuild trust in cross-border regions and in the common Nordic labour market through the introduction of measures to ensure that people, goods and services can continue to flow freely across borders during times of crisis.
As the report highlights, digitalisation has laid the foundation for a long-term shift towards remote working for a substantial proportion of Nordic workers. This increased freedom to ‘work from anywhere’ has in turn created the conditions for new and dynamic linkages between urban and rural areas. Many people have spent more time at second homes, taken advantage of the lower visitor numbers in popular tourism destinations by enjoying vacations within their own countries, or even relocated from the city to a rural area. Within this context, there has been much talk about the potential for this trend as an opportunity for revitalising rural areas. Revitalisation efforts might have a greater chance of success in rural municipalities closer to large urban centres. Furthermore, these opportunities are contingent on increasing the access to high-speed broadband for rural communities, making them more attractive places to live and work.
Nordic cooperation and Covid-19 recovery
The Covid-19 pandemic has exposed the fragility of Nordic co-operation, particularly in cross-border regions where the impact of the pandemic has been most evident among families, friends and businesses left divided by the abrupt imposition of border closures and restrictions. The crisis represents a major challenge to Nordic co-operation, with the countries taking an inward-looking, state-centric approach rather than a collective and coordinated transnational response to the crisis. Covid-19 has placed Nordic co-operation at a crossroads, and which road it will take depends upon whether the governments, regions and municipalities regard co-operation as a ‘must-have’ or a ‘nice-to-have’ (Giacometti & Wøein Meijer, 2021). Indeed, the ongoing pandemic is representative of the types of global challenges faced in an increasingly interconnected and interdependent world. The Nordic Region is, therefore, not immune to global shocks of this nature, and Nordic countries and regions must work together and pool resources to help overcome such threats.
The crisis presents an ideal moment to reflect and re-evaluate the nature of Nordic co-operation moving forward. According to the OECD (2020), “co-operation is an imperative – and not an option” in responding to the socio-economic challenges presented by the crisis and effectively implementing just, green and smart transitions. The Nordic Region has a tradition of experimenting with collaborative governance in the delivery of public services across borders and between regions and municipalities (Cedergren et al., 2021). Promoting Nordic collaborative governance processes will be required in order to pool resources to deliver public policies and services efficiently and effectively. Facing potential revenue reductions, interregional and inter-municipal collaborative governance will be particularly important for smaller regions and municipalities to help increase financial resources and administrative capacities, reduce transaction costs and establish economies of scale. Regional reforms of this nature are underway in Finland. Harnessing the potential of digitalisation will also be essential for maintaining dialogue between institutions and actors and exploring the potential for active citizen engagement in policymaking.
The top-down national measures introduced during the pandemic have undermined the unique position of Nordic sub-national actors and their capacity to drive regional resilience recovery and transition strategies (Giacometti & Wøien Meijer 2021). Nordic regional leadership will be an essential element of the recovery process, ensuring a place-based territorial response with a central role for sub-national level actors in the development and implementation of tailored policies that meet the specific needs of people in the regions and local communities (Andreasson & Lundqvist, 2018; Sotarauta & Beer, 2021). The pandemic has highlighted the important role of regional and municipal authorities in crisis management and the delivery of vital public services and welfare provisions, including health care, social services, education and economic support for businesses. Embracing the notion of active subsidiarity and bringing policymaking closer to the people are essential for democracy and legitimacy, so it is imperative that Nordic regions and municipalities play a central role in post-pandemic decision-making about recovery (Moodie et al., 2021b; 2021c). Indeed, it is vitally important to encourage experimental territorial governance processes that leave room for flexibility and adaptability in the development of local policies. Within this context, an emphasis on Nordic regional resilience thinking may be useful for understanding how Nordic regions are affected by crises and how to facilitate local transitions and recovery (Giacometti & Teras, 2019).
While the pandemic has exposed weaknesses and fragility in Nordic co-operation, it also serves as a reminder of the advantages of working together, particularly the benefits that freedom of movement across borders offer to local economies, labour markets and people (Giacometti et al., 2022). Mechanisms must be found to ensure that the strengths of the Nordic cross-border co-operation are fully utilised to support joint decision-making and maintain open borders during the next crisis. It is particularly vital that actors in border regions can trust that their planning and activities will not be jeopardised in the future (Enestam, 2021). This crisis should be a wake-up call for the renewal of Nordic co-operation and for building consensus among key national and regional authorities, sectors, stakeholders and citizens. These actors can build on existing Nordic co-operation infrastructures, networks and social capital to deliver effective policies that meet the needs of the people of the Nordic Region. Daring to define a new Nordic co-operation pathway fit for the challenges of the 21st century is the key to making the Nordic Region more resilient to future crises. New co-operation frameworks must take into account the uncertainties with which we live and reinforce the capacity of the Nordic Region to absorb disturbances and adapt to new conditions.
References
Andreasson, U., & Lundqvist, M. (2018). Nordic leadership. Nordic Council of Ministers.
Cedergren, E., Huynh, D., Kull, M., Moodie, J., Sigurjónsdóttir, H. R., & Wøien Meijer, M. (2021). Public service delivery in the Nordic Region: An exercise in collaborative governance, Nordregio.
Dewan, C. (2021), Covid-19, Nordic trust and collective denial: Sweden and Norway compared, Corona Times, accessed: https://www.coronatimes.net/covid-19-nordic-trust-collective-denial-sweden-norway/
Enestam, J.E. (2021), Strategisk Genomlysning: Nordisk Civil Krisberedska, accessed at: https://www.norden.org/sites/default/files/2021-11/Enestam%20SE.pdf Giacometti, A., & Teräs, J. (2019). Regional economic and social resilience: An exploratory in-depth study in the Nordic countries. Nordregio.
Giacometti, A., & Wøien Meijer, M. (2021). Closed borders and divided communities: status report and lessons from Covid-19 in cross-border areas. Nordregio.
Giacometti, A., Wøien Meijer, M., & Moodie, J. (2022), Trust: The Social Capital of Border Communities in the Nordic Region. Cross-Border Review: Yearbook 2021, (CESCI: Budapest).
Lanzano, C. (2020), Trust in Science and Sweden’s different approach to Covid-19, Corona Times, accessed at: https://www.coronatimes.net/trust-science-sweden-covid19/
McNeill, W. H. (1976). Plagues and Peoples, (Achor Publisher: New York).
Moodie, J. R. (2021a), Sweden’s response to Covid-19 and the limits of individualism, Corona Times, accessed at: https://www.coronatimes.net/sweden-response-covid-19-limits-individualism/
Moodie, J. R., Salenius, V., & Wøien Meijer, M. (2021b). Why territory matters for implementing active subsidiarity in EU regional policy. Regional Studies, 1-13.
Moodie, J. R., Wøien Meijer, M., Salenius, V., & Kull, M. (2021c). Territorial governance and Smart Specialisation: Empowering the sub-national level in EU regional policy. Territory, Politics, Governance, 1-21.
OECD (2020), The territorial impact of Covid-19: Managing the crisis across levels of governance, accessed at: https://www.oecd.org/coronavirus/policy-responses/the-territorial-impact-of-covid-19-managing-the-crisis-across-levels-of-government-d3e314e1/
Sotarauta, M. & Beer, A. (Ed.). (2021). Handbook on City and Regional Leadership. Edward Elgar Publishing.
About State of the Nordic Region 2022
Nordregio Report 2022:2
Published: 23 March 2022
ISBN
ISSN
DOI http://doi.org/10.6027/R2022:2.1403-2503
© Nordregio 2022
The State of the Nordic Region 2022 report has been developed by Nordregio with Gustaf Norlén as the project leader. Gustaf and his colleagues Linda Randall, Nora Sánchez Gassen, and Carlos Tapia coordinated the writing process with authors from Nordregio. Johanna Feuk Westhoff oversaw the communication activities related to the project with assistance from Åsa Ström Hildestrand.
In addition to the editors and authors from Nordregio a reference group consisting of members from Nordregio’s board gave valuable inputs. The reference group consisted of Ulla Agerskov, Hans-Henrik Bull, Gitte Mondrup, Anna Rosenberg, and Katarina Fellman. We also want to thank others at the NCM secretariat, EK-A as well as Kjell Nilsson, Luciane Aguiar Borges, Johannes Lidmo and Lisa Rohrer for valuable comments.
