Photo: Tapio Haaja / Unsplash.com
Internal migration in the Nordic countries
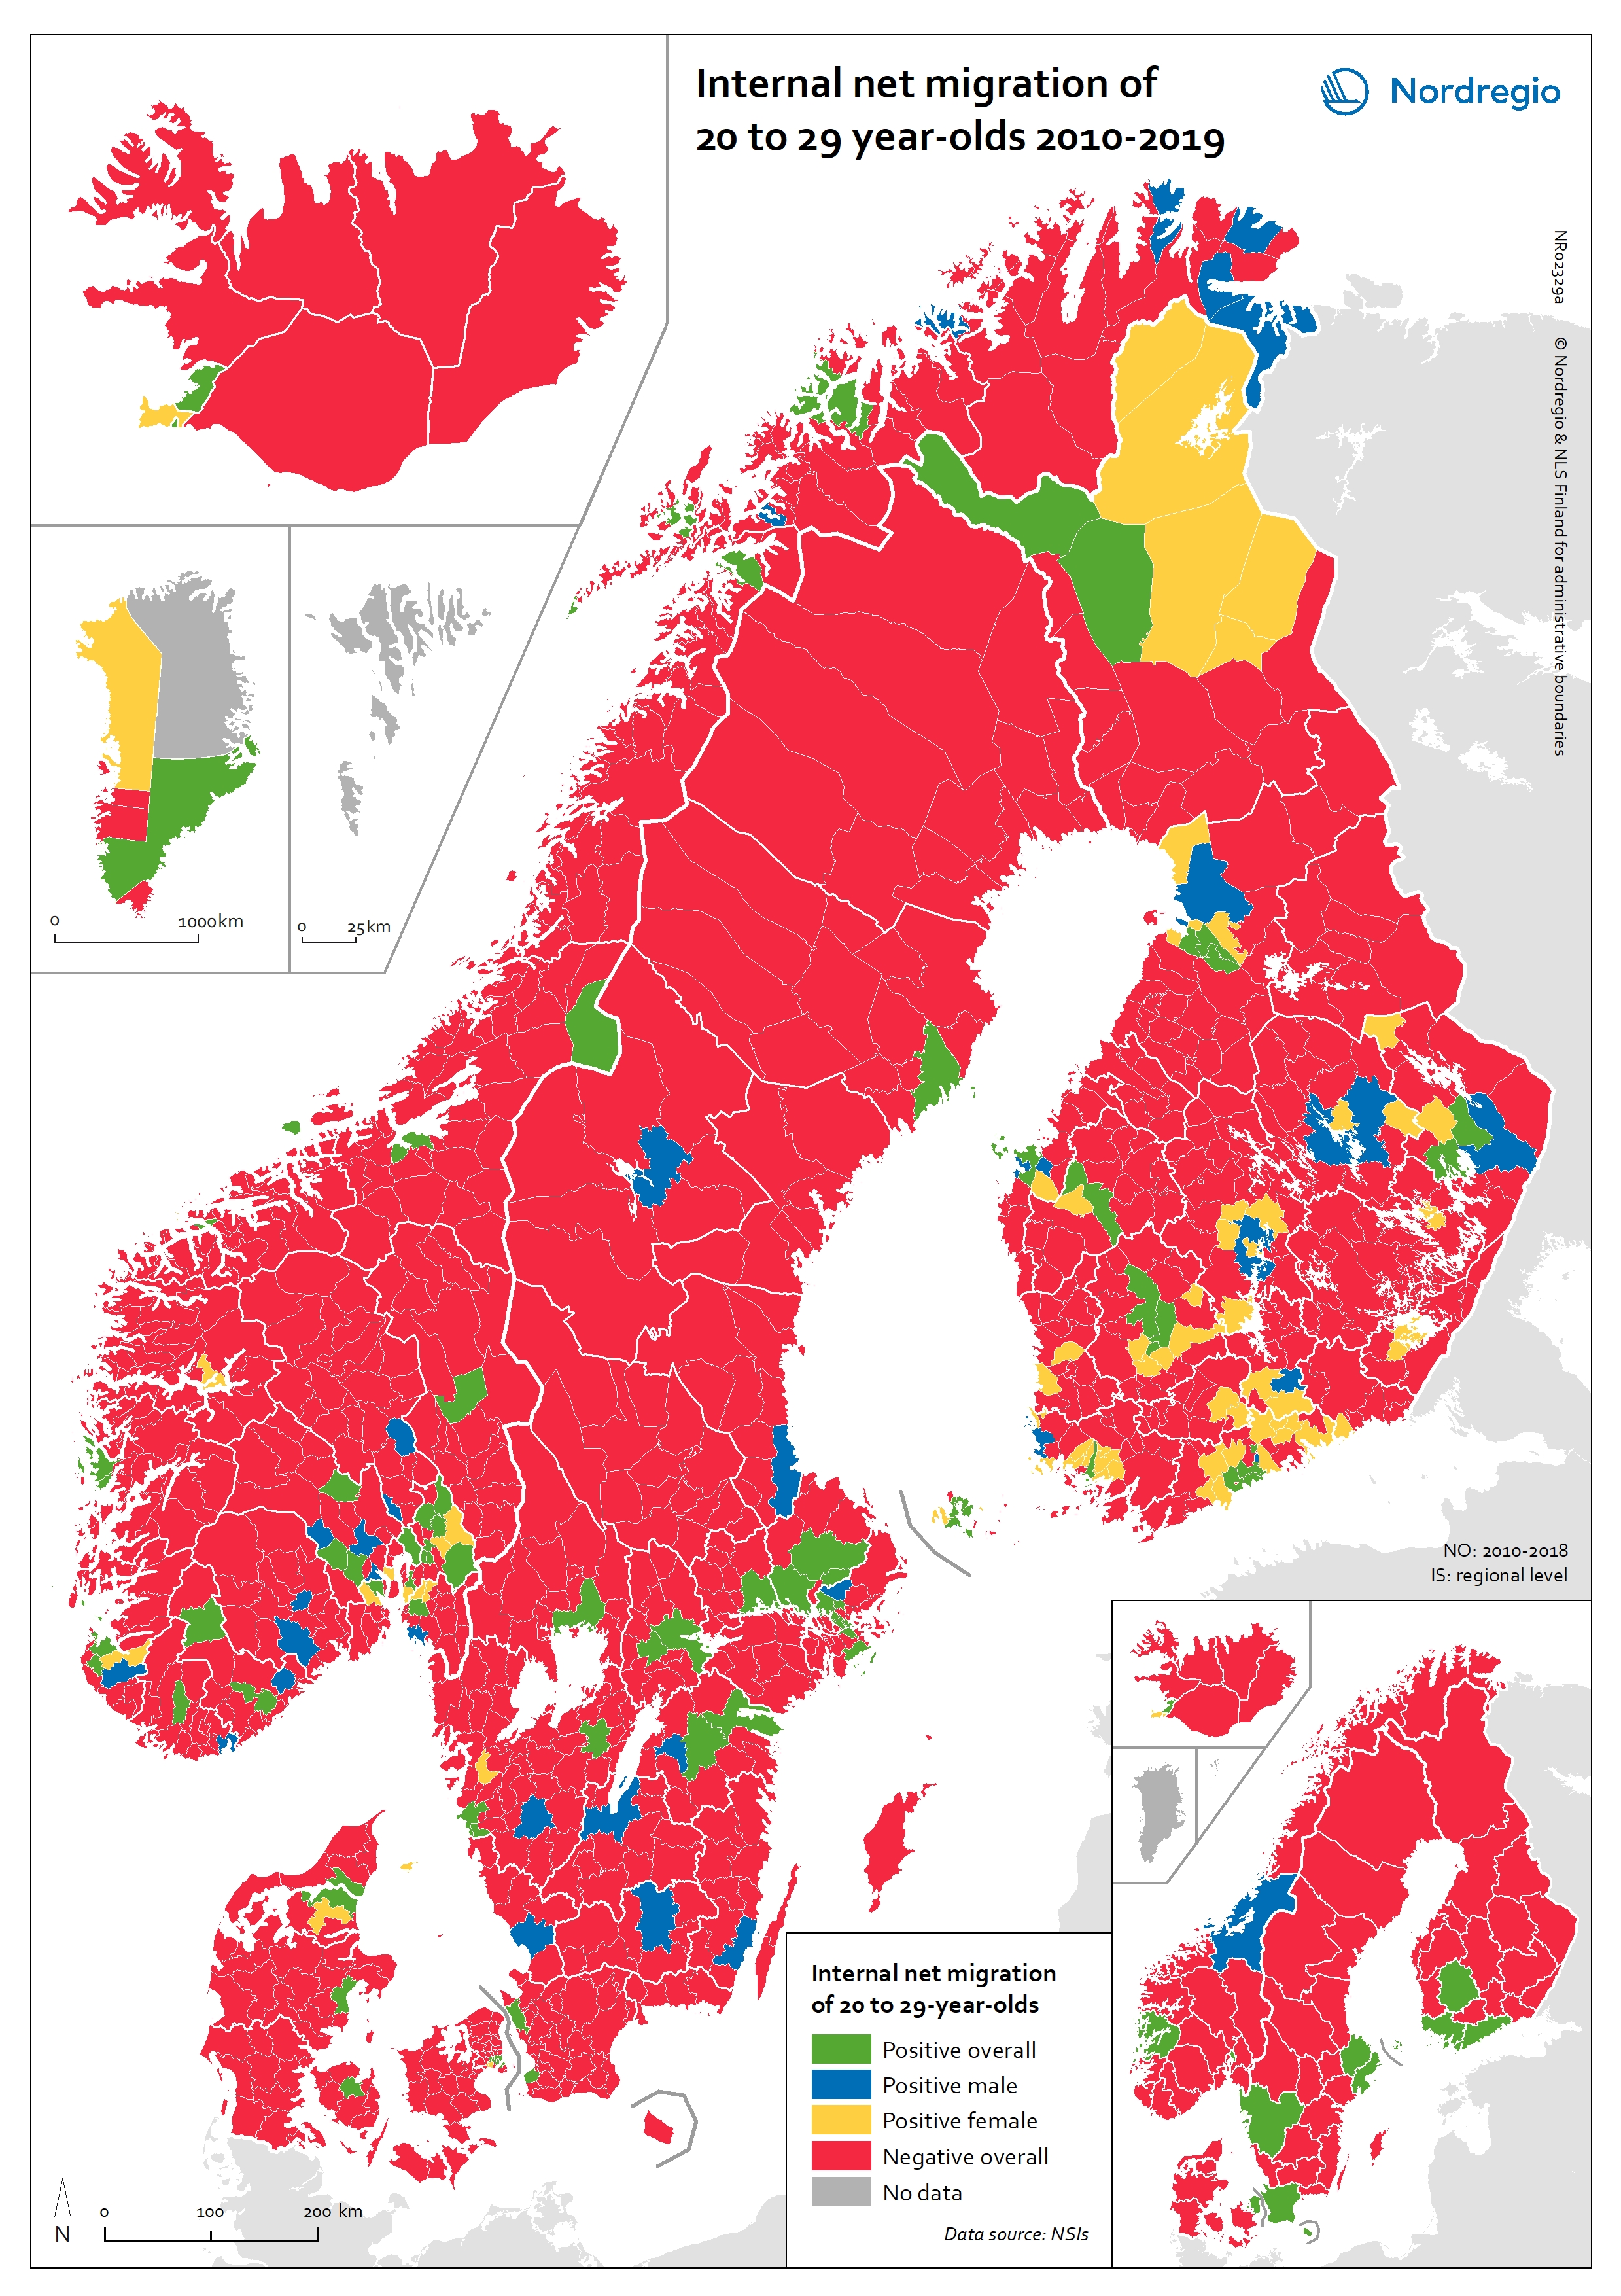
Recent data shows a high level of internal migration among young adults in the Nordic region and this research project derives from the striking differences in migration intensities between people in their 20s and 30s, as demonstrated in Map 1 and Map 2. Map 1 is a regional map for the Nordic region showing internal net migration by sex of the cohorts 20-29 years old in 2010-2019 and clearly shows how the migration stream is dominated by flows towards cities and university towns, for both men and women. With very few exceptions, rural municipalities are experiencing negative net migration of these young adults in favour of urban areas.
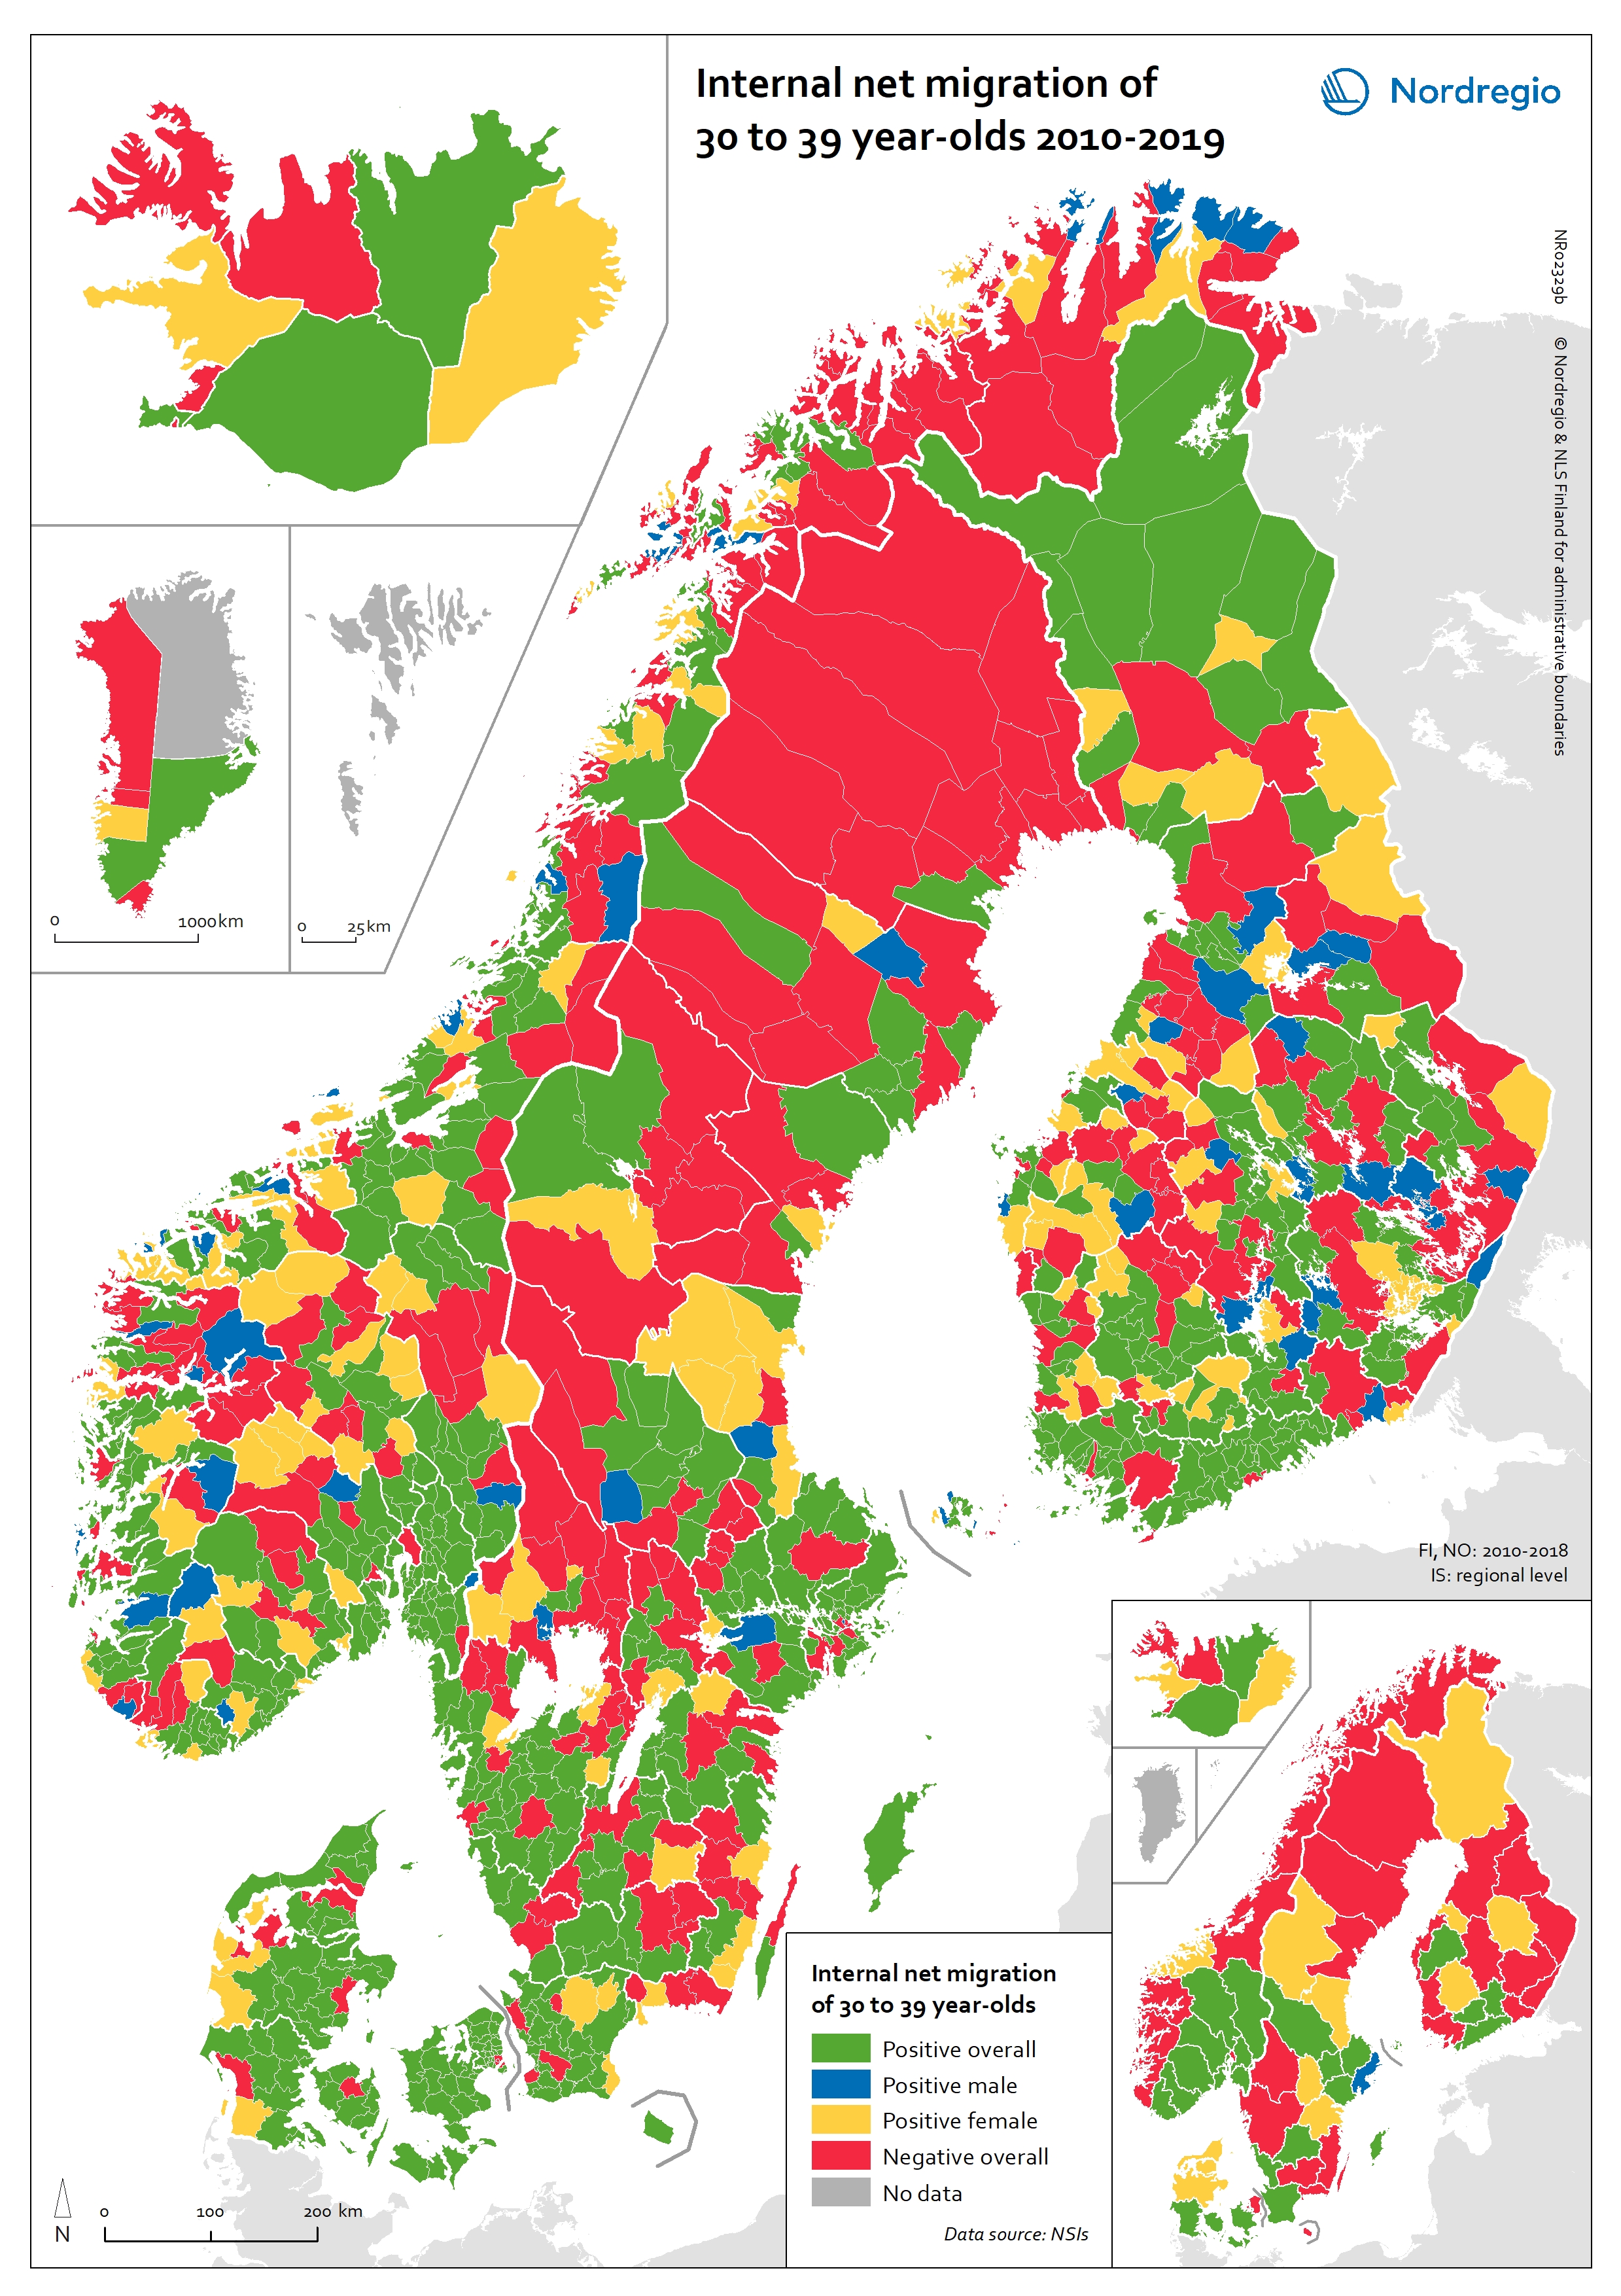
Map 2 demonstrates more diverse migration routes for the 30-39 age cohort, especially for women. For this cohort, a substantial proportion of rural municipalities shows a more positive picture, where the more remote municipalities are experiencing positive net migration, especially among women, whereas there is a negative net migration across the Nordic capital city municipalities (Lundgren et al., 2020). More recent migration data suggests that this trend is accelerating for both men and women of this cohort across the Nordic countries. There was a significant shift in internal migration in the Nordic countries during the pandemic years 2020 and 2021 compared to the previous years. The largest change was the increasing out-migration from capital cities and major urban areas (Jensen & Randall, 2022). 0

