Photo: Christian Lue/Unsplash
Demographic characteristics:
Age structure, gender and foreign-born populations
Age structure
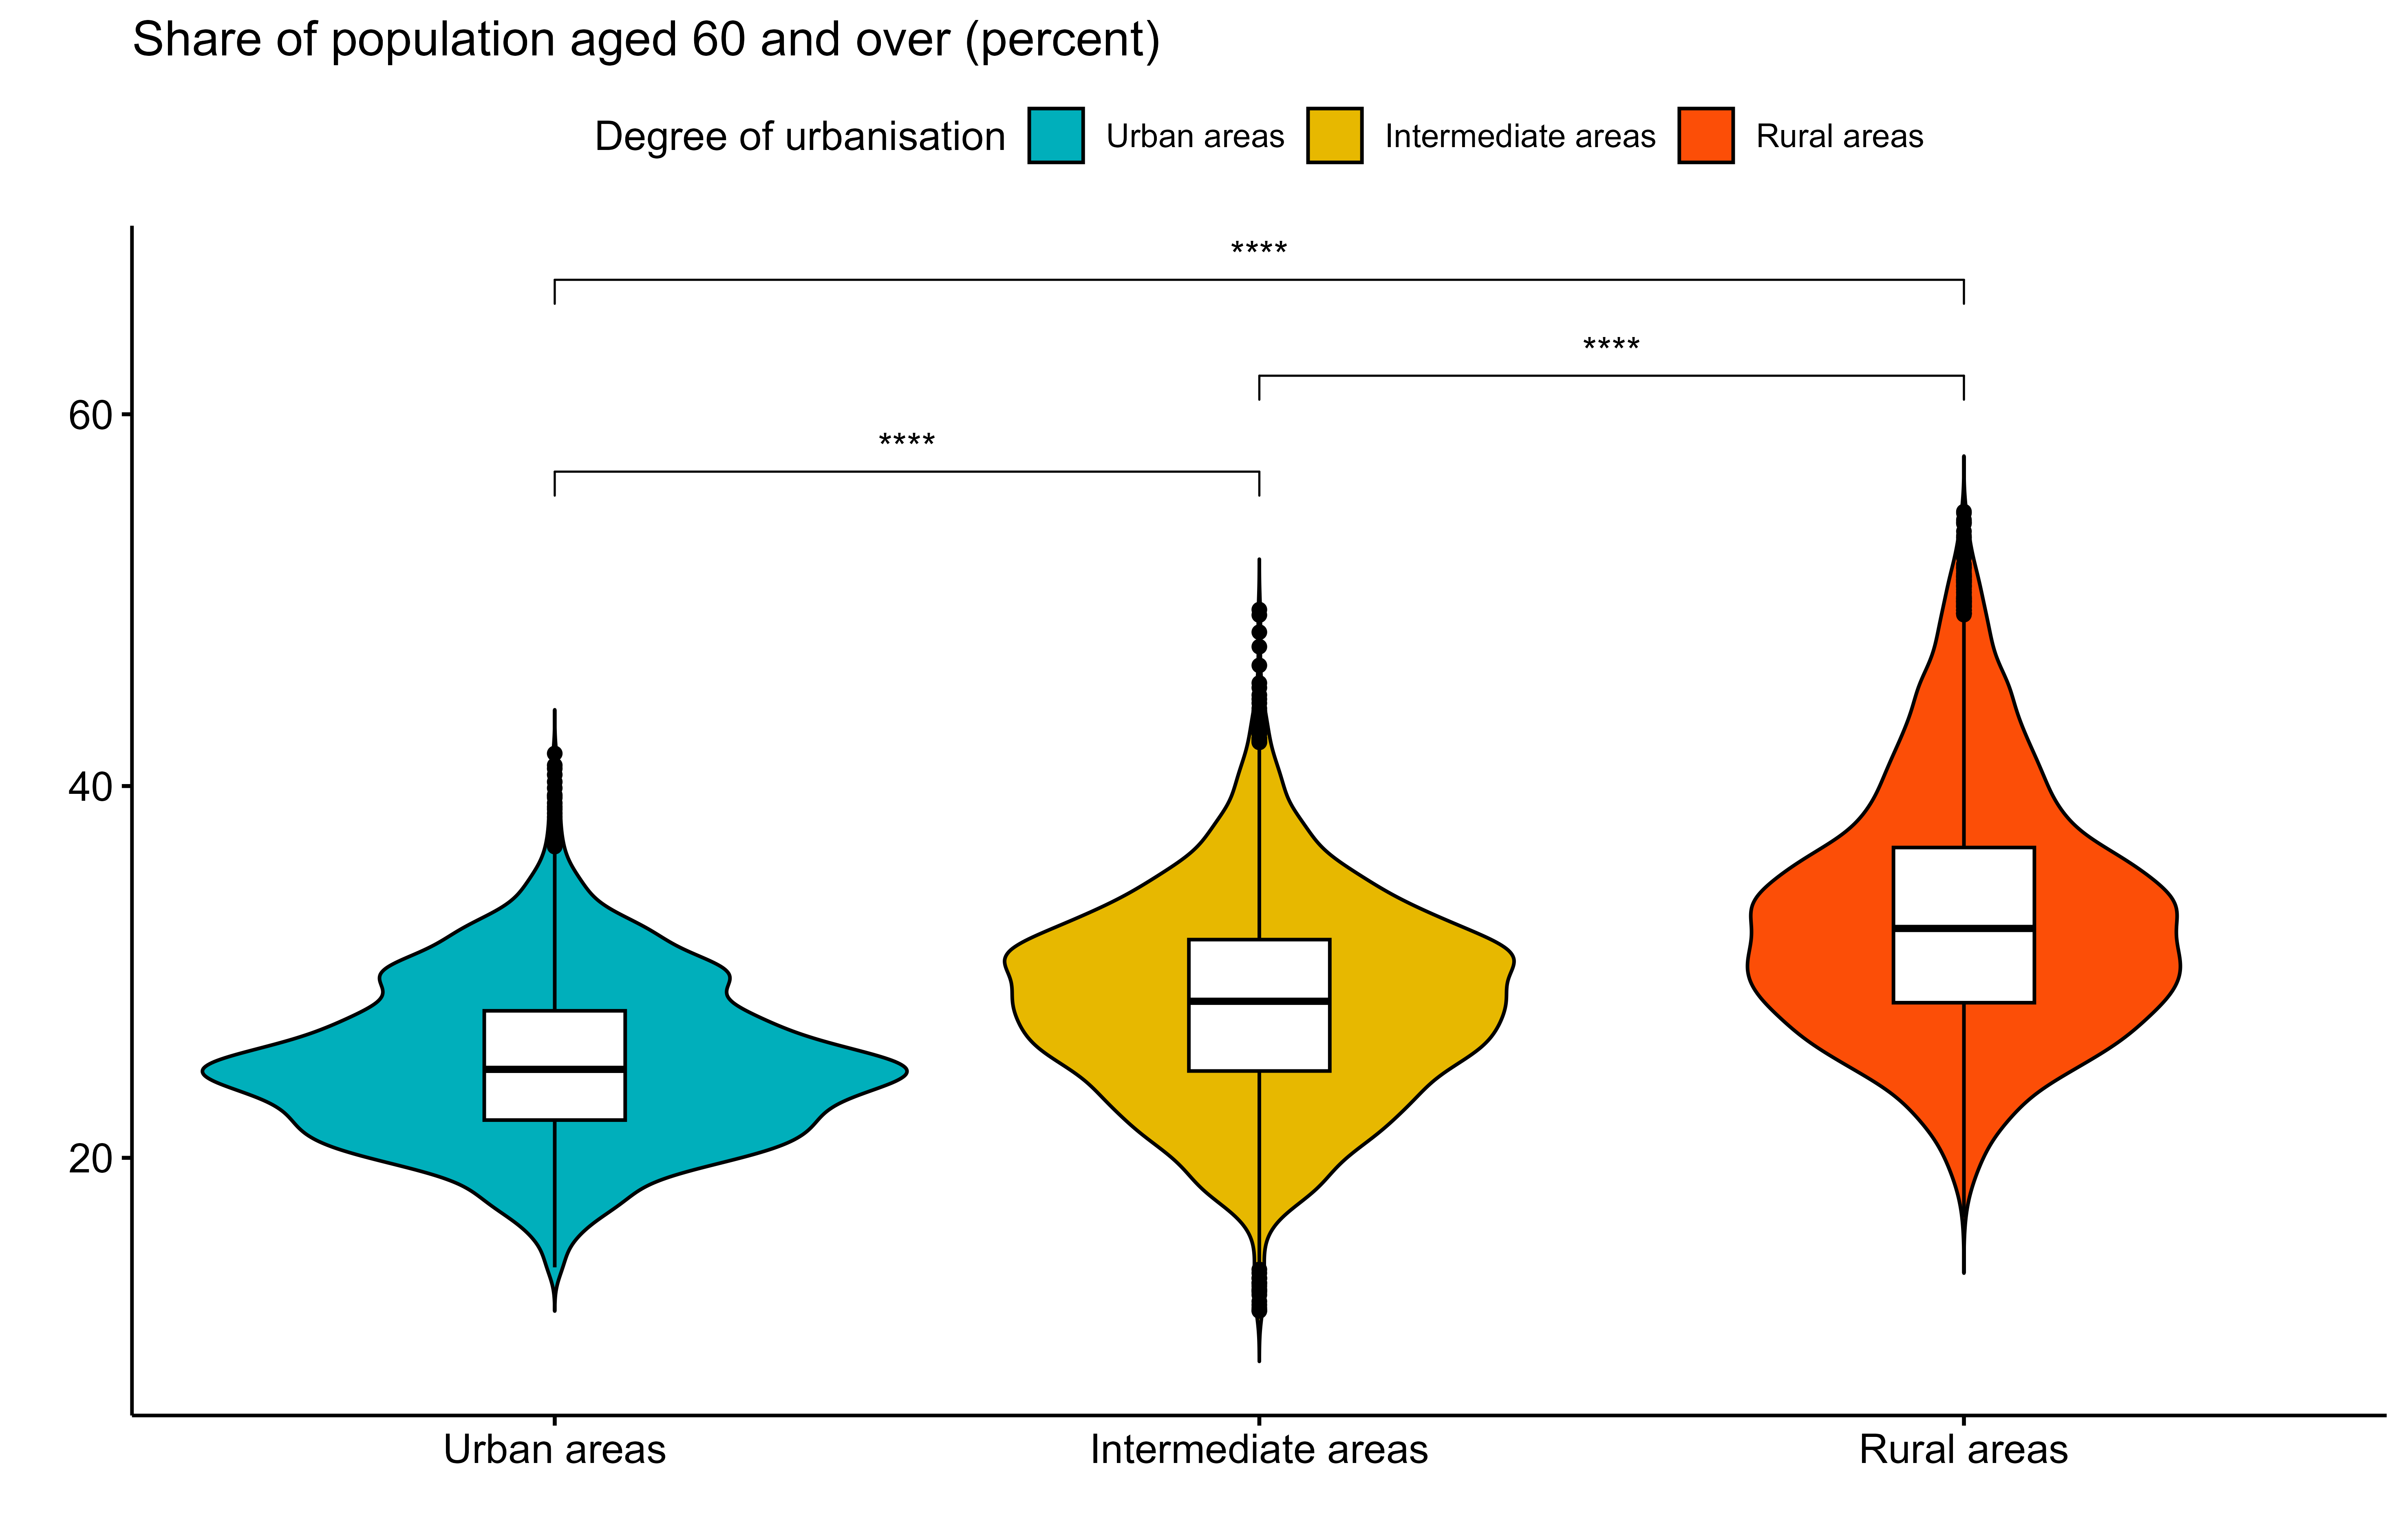
Map 1 shows the share of the population aged 60 and above in the Nordic countries in 2023. Rural municipalities generally have the highest proportions of elderly residents, exceeding 35% in several cases, particularly in Finland and northern Sweden. These areas often have aging populations due to younger people moving to cities. In contrast, urban municipalities like Stockholm, Oslo, Helsinki, and Copenhagen have a lower share of older populations, often less than 25%. Greenland, the Faroe Islands, and Iceland all have comparatively young populations with a low share of people aged 60 and older. The violin plot in Figure 1 shows that the age distribution differences between urban, intermediate, and rural municipalities are statistically significant at p <= 0.0001.
Figure 1: Share of population aged 60+ (2023)
Note: The violin plot does not include Greenland and the Faroe Islands, since they are not part of the urban-rural typology used here (see Annex 1). Iceland is also not included in the violin plot, since data were not available at municipal level.
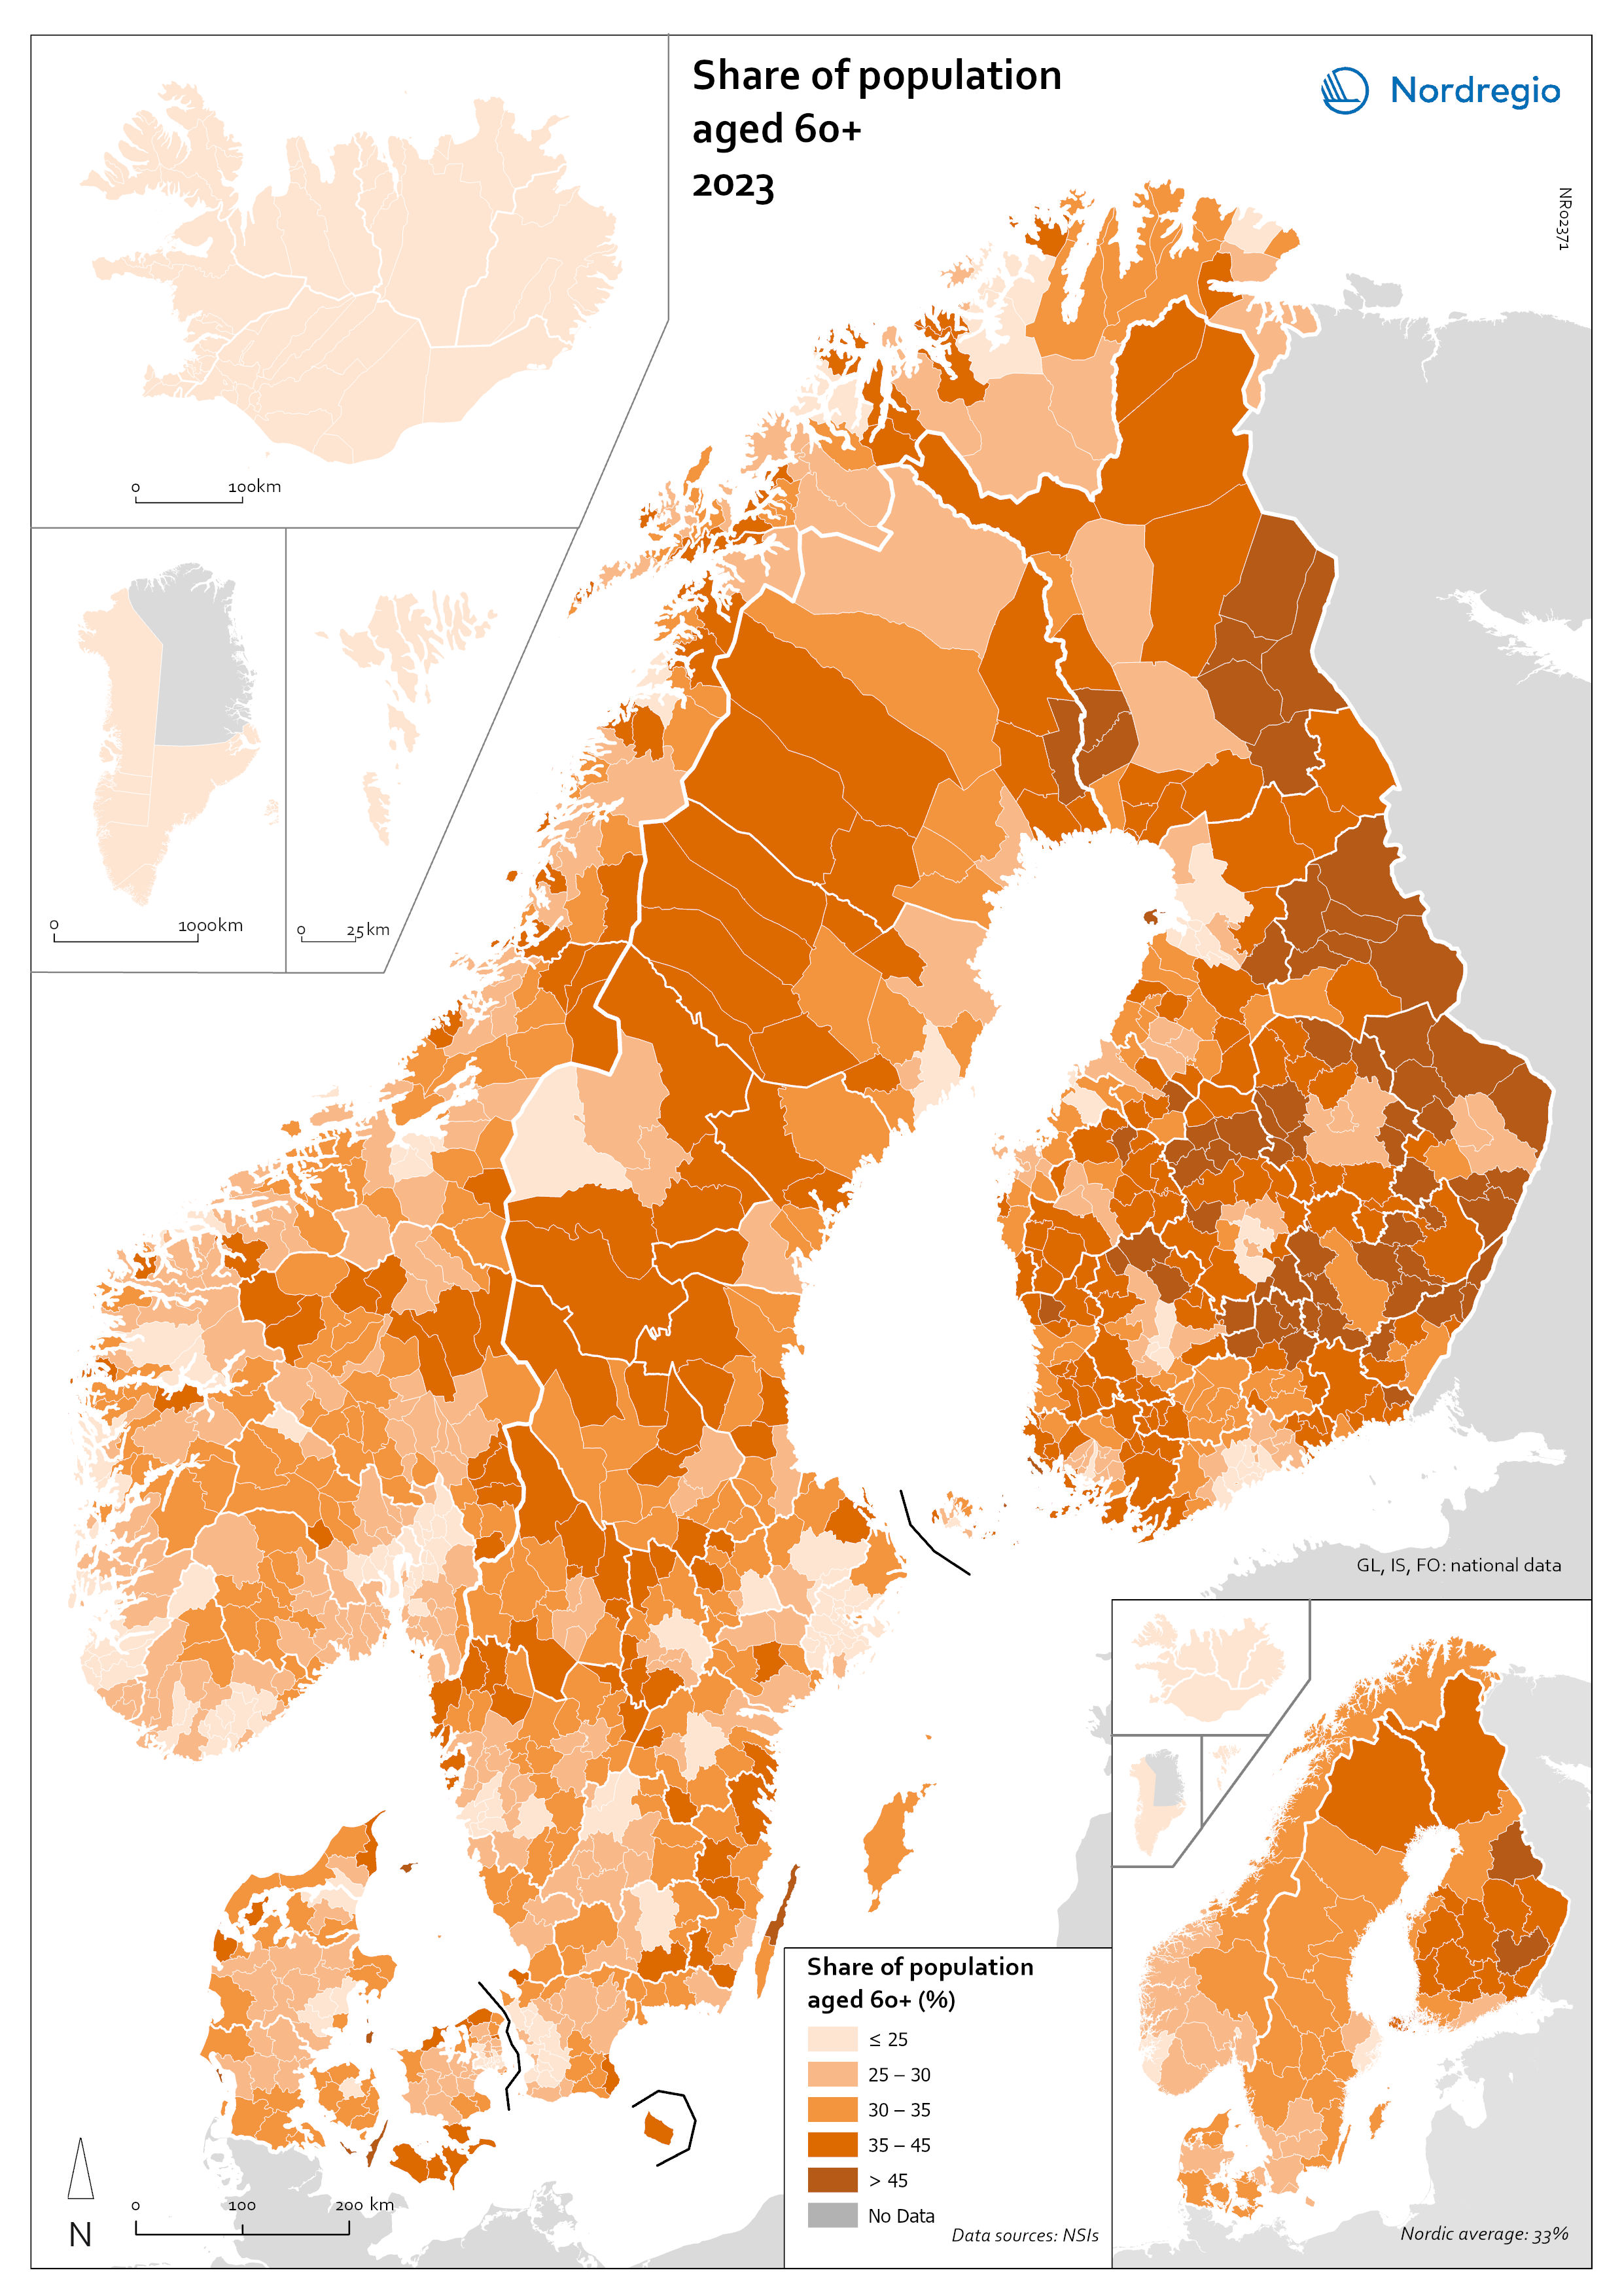
Map 1: Share of population aged 60+ (2023).
Gender
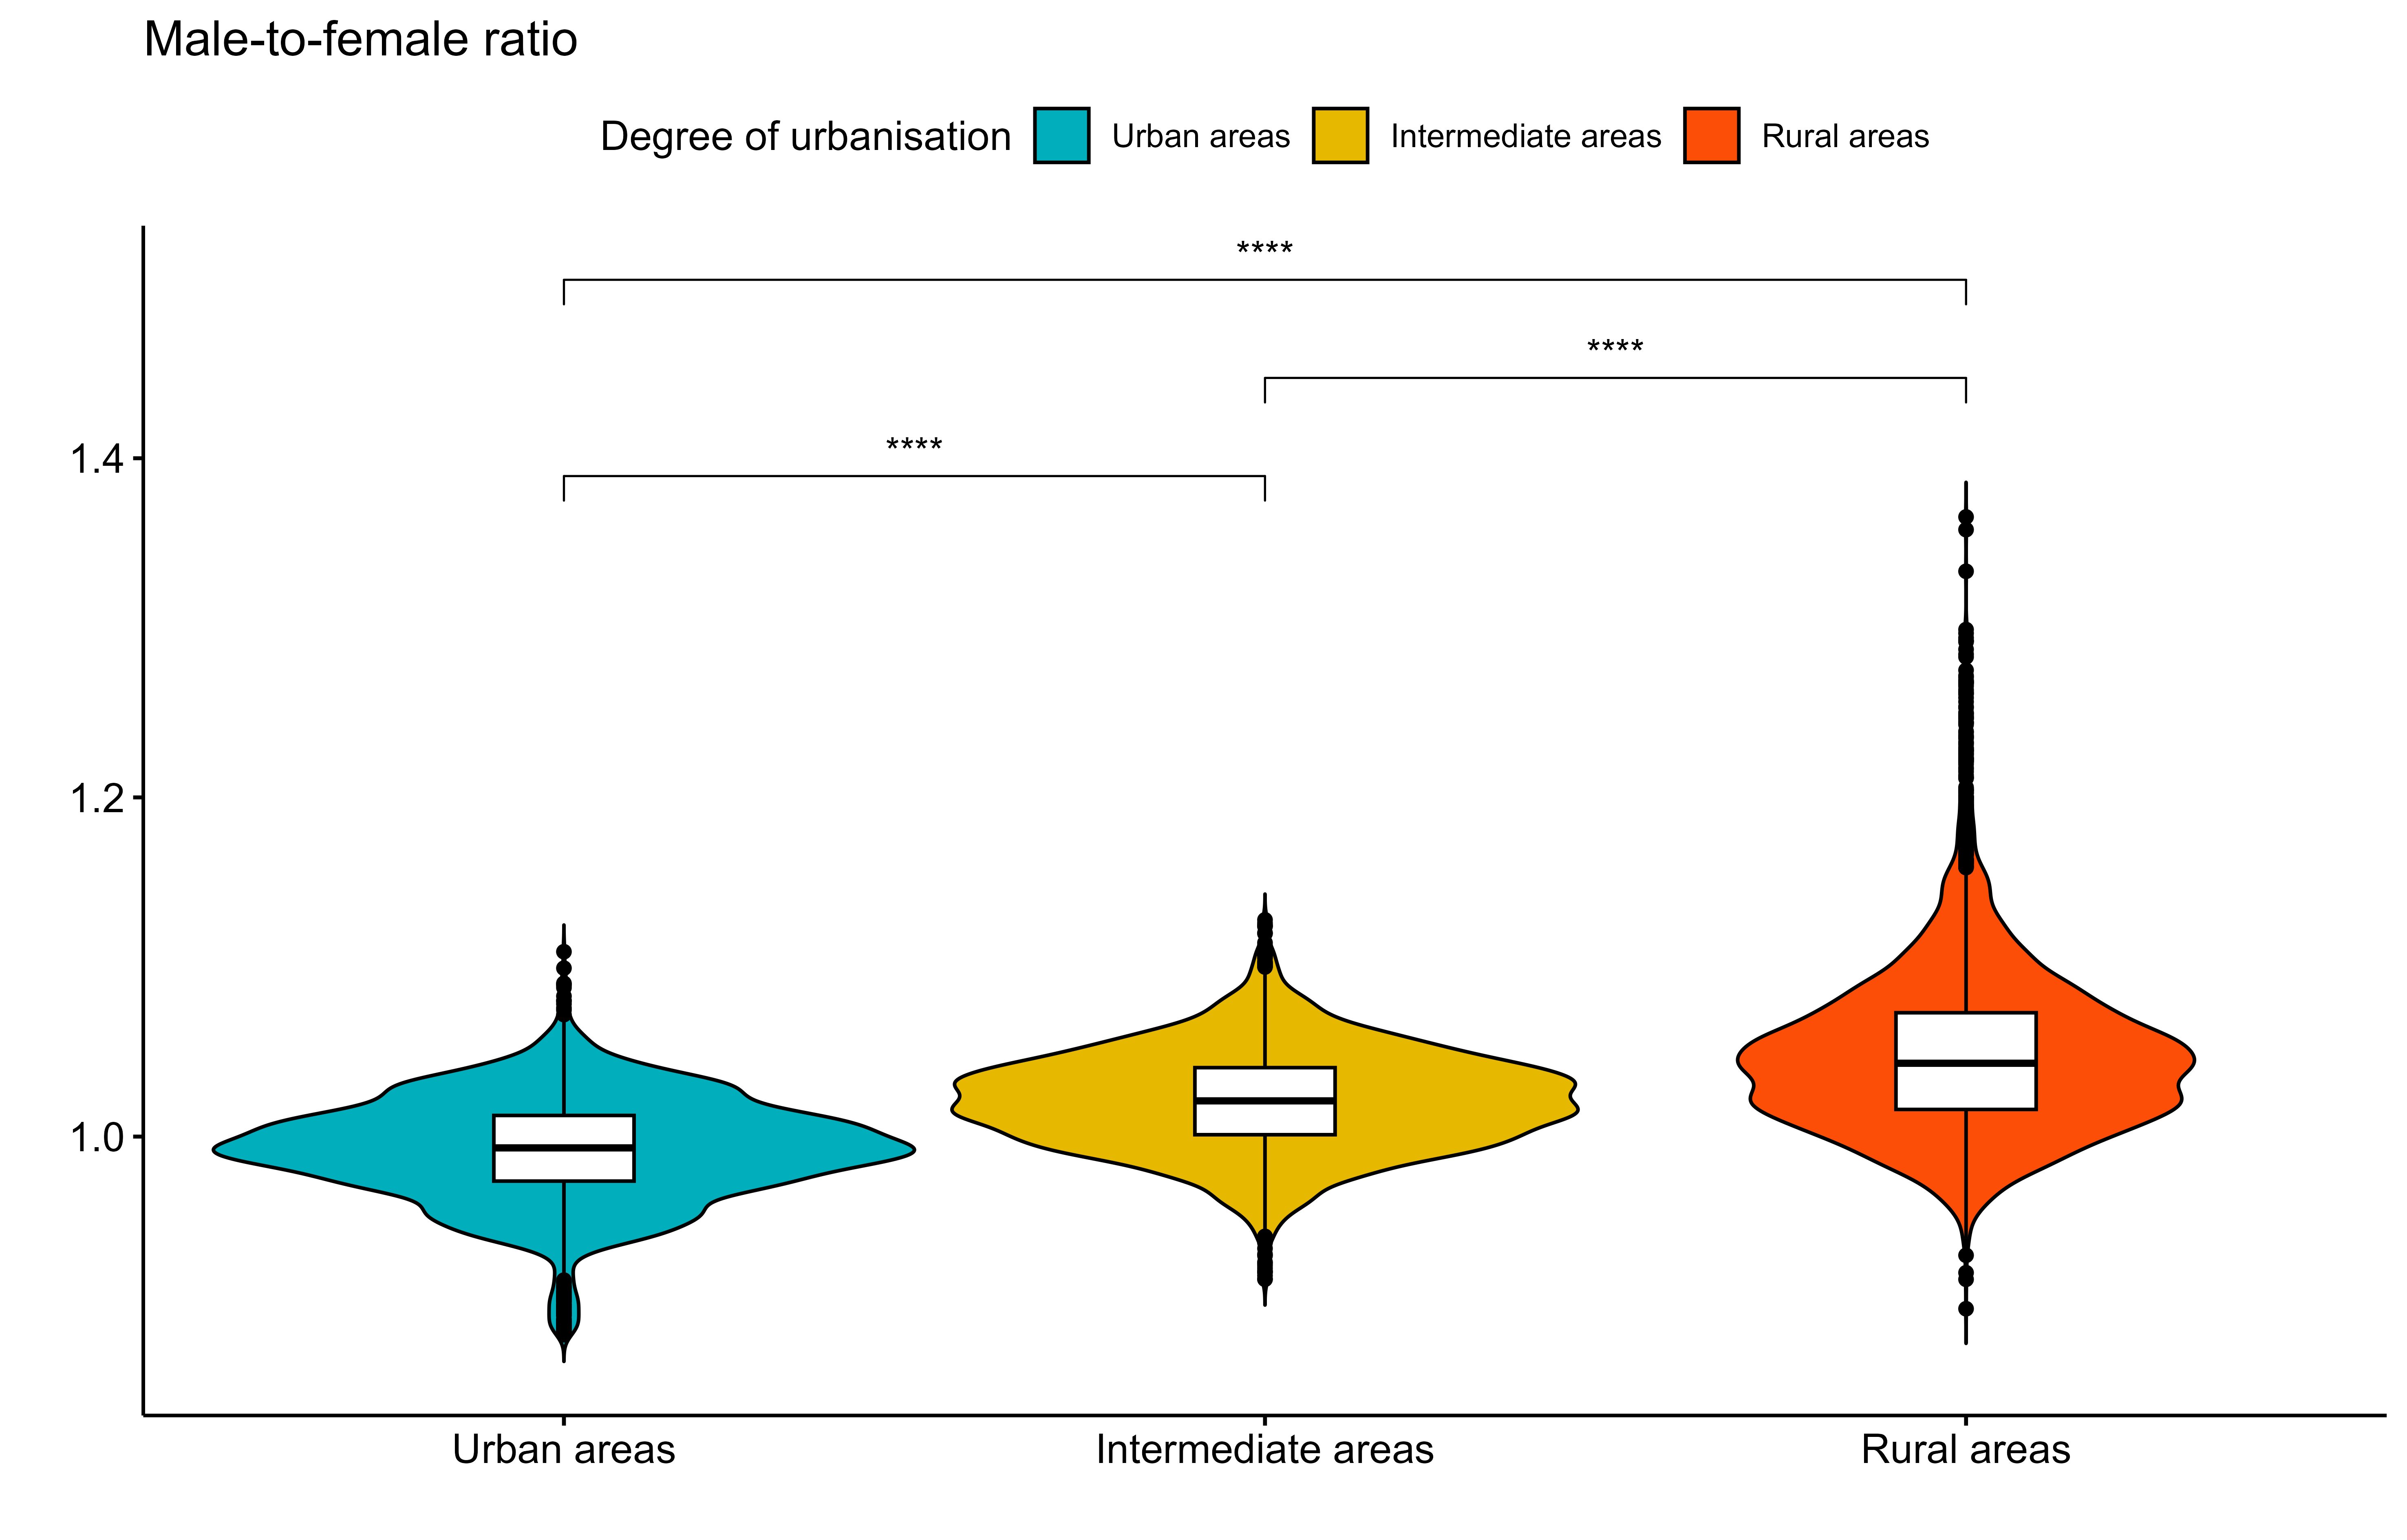
Map 2 illustrates the gender balance of the population in Nordic municipalities in 2023, expressed as a male-to-female ratio. On average, there are slightly more males than females in the Nordic Region, with a male-to-female ratio of 1.03. However, there are significant regional and local variations. Greenland has the highest male-to-female ratio in the Nordic Region. The Faroe Islands, as well as rural municipalities in northern Sweden, northern Finland and parts of Norway, also have high ratios, often exceeding 1.06. This is often because of more women moving to cities. In contrast, cities like Stockholm, Helsinki, Oslo and Copenhagen tend to have lower male-to-female ratios, often below 1.02, indicated by brown and yellow shades. These areas have more balanced or even female-dominated populations. Overall, Denmark has less pronounced gender imbalances compared to its Nordic neighbors, with most municipalities having ratios closer to the Nordic average. The four asterisks above the significance brackets in the violin plot in Figure 2 show that the differences in gender balance between urban, intermediate and rural municipalities in the Nordic Region are statistically significant at p <= 0.0001.
Figure 2: Gender balance (2023)
Note: The violin plot does not include Greenland and the Faroe Islands, since they are not part of the urban-rural typology used here (see Annex 1). Iceland is also not included in the violin plot, since data were not available at municipal level.

Map 2: Gender balance (2023).
Foreign-born populations
Map 3 shows the share of foreign-born inhabitants among the total population in 2023, highlighting significant variation between the Nordic countries, regions and between urban, intermediate and rural municipalities. Cities like Stockholm, Oslo, and Copenhagen have higher shares of foreign-born residents.
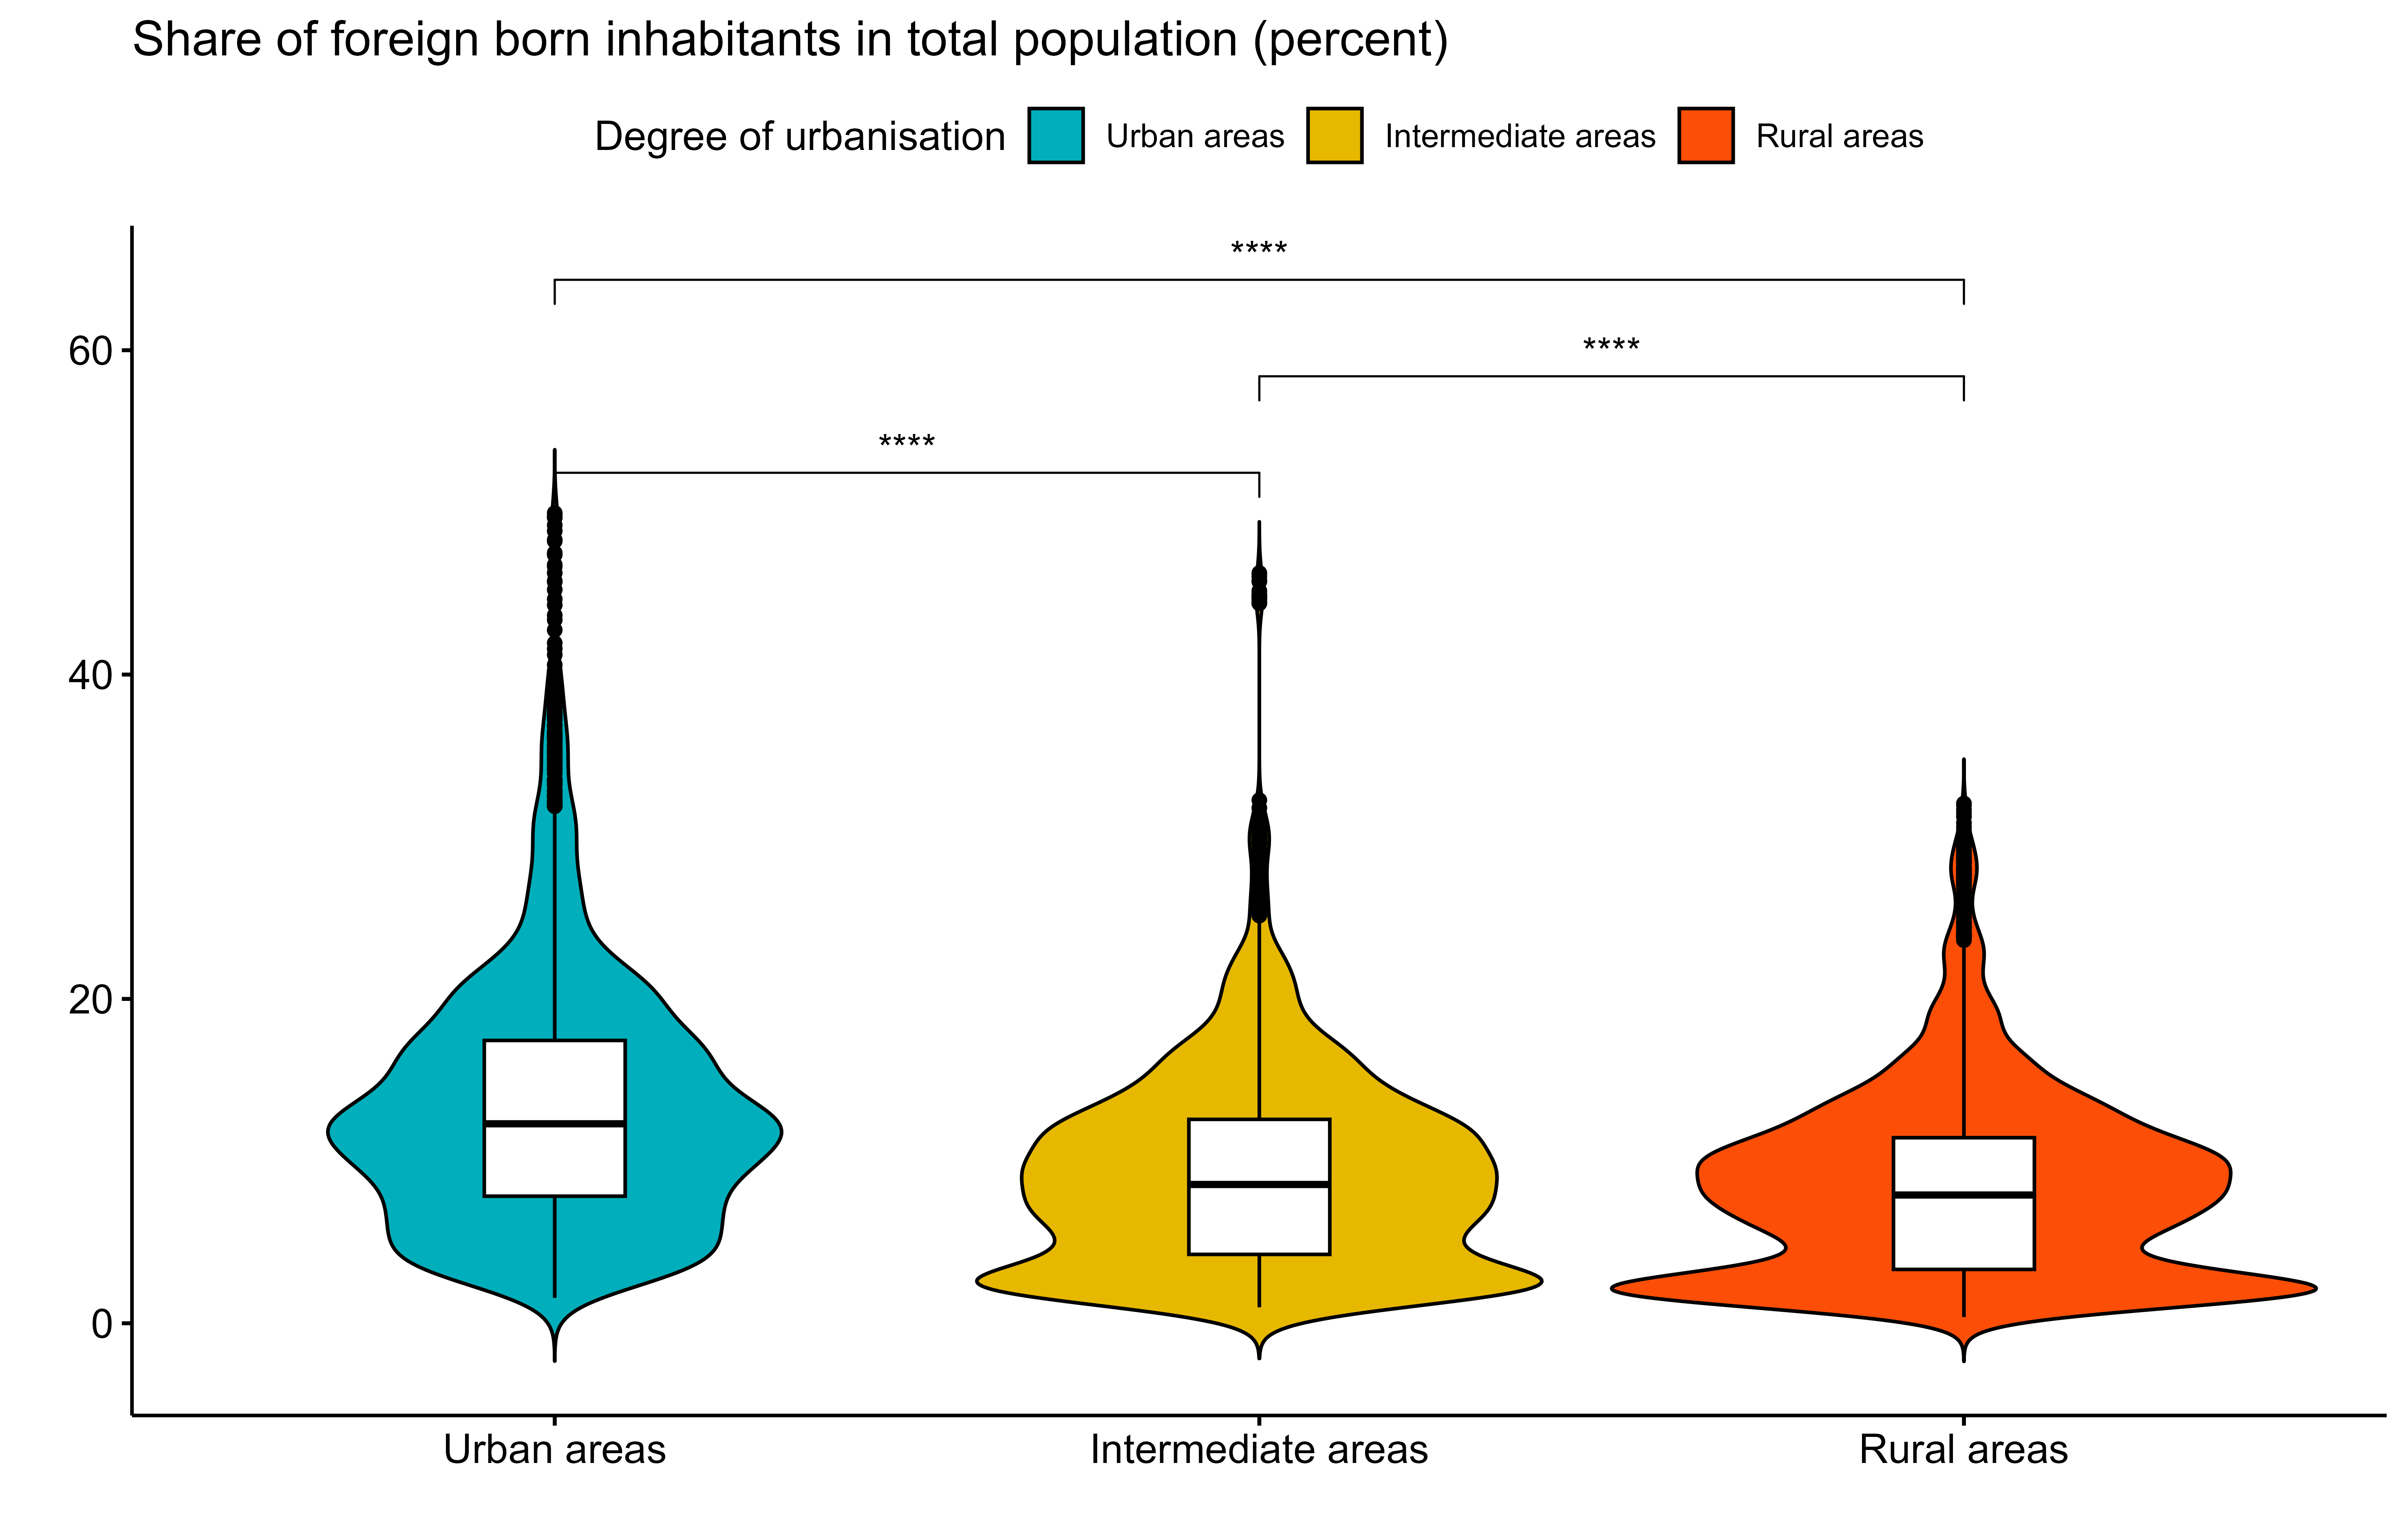
In Sweden, municipalities with high levels of immigrants include Botkyrka, Södertälje, and Huddinge, all in the Stockholm area, where about 50% of the population is foreign-born. In southern Sweden, municipalities like Malmö and Landskrona have foreign-born populations exceeding 40%. Västra Götaland, including Gothenburg, also has high shares, though at slightly lower levels. In Denmark, the Capital Region, including Copenhagen, and other urban municipalities show higher proportions of foreign-born inhabitants, though values are generally lower compared to Swedish cities. In Finland, Helsinki has a high share, though it remains below many Swedish municipalities. Åland also stands out for its relatively high percentage of foreign-born residents compared to mainland Finnish regions. In Norway, Oslo has the highest share of foreign-born residents, with nearly 28% of its population from outside Norway. Regions like Viken and Rogaland show moderately high shares. The four asterisks above the significance brackets in the violin plot in Figure 3 show that the differences between urban, intermediate and rural municipalities in the Nordic Region are statistically significant at p <= 0.0001.
Figure 3: Share of foreign-born people among the total population (2023)
Note: The violin plot does not include Greenland and the Faroe Islands, since they are not part of the urban-rural typology used here (see Annex 1). Iceland is also not included in the violin plot, since data were not available at municipal level.

Map 3: Share of foreign-born people among the total population (2023).