Photo: Magnus Fröderberg/norden.org
Socio-economic characteristics:
Education, unemployment and income
Tertiary education
Map 4 shows the percentage of the population aged 25–64 with tertiary education in the Nordic Region in 2022. Tertiary education includes Bachelor’s, Master’s, or equivalent degrees, doctoral degrees as well as short-cycle educational programmes.
This corresponds to levels 5-8 in the International Standard Classification of Education (ISCED), see https://uis.unesco.org/en/glossary.
The map highlights urban-rural differences. Major cities and their surrounding municipalities tend to have higher percentages of people with tertiary education compared to rural municipalities. For example, Oslo and Stockholm have high levels of tertiary education, with 60% or more of the population having attained such education. Similarly, the Uusimaa region, which includes Helsinki, has the highest percentage of tertiary-educated individuals, while rural regions like North Karelia and Kainuu have lower levels. Denmark follows a similar pattern, with the capital region of Denmark (Hovedstaden) having higher educational attainment levels than North Jutland and Southern Denmark. In Iceland, the share of people with tertiary educational is greater in Reykjavik than in the rest of the country. Norway has comparatively high levels of higher education even in rural municipalities. The significance brackets included in the violin plot in Figure 4 show that the differences in educational attainment between rural, intermediate, and urban municipalities are statistically significant at p <= 0.0001.
Figure 4: Tertiary educational attainment (2022)

Note: Data were not available for the Faroe Islands. The violin plot does not include Greenland, since it is not part of the urban-rural typology used here (see Annex 1). Iceland is also not included in the violin plot, since data were not available at municipal level.
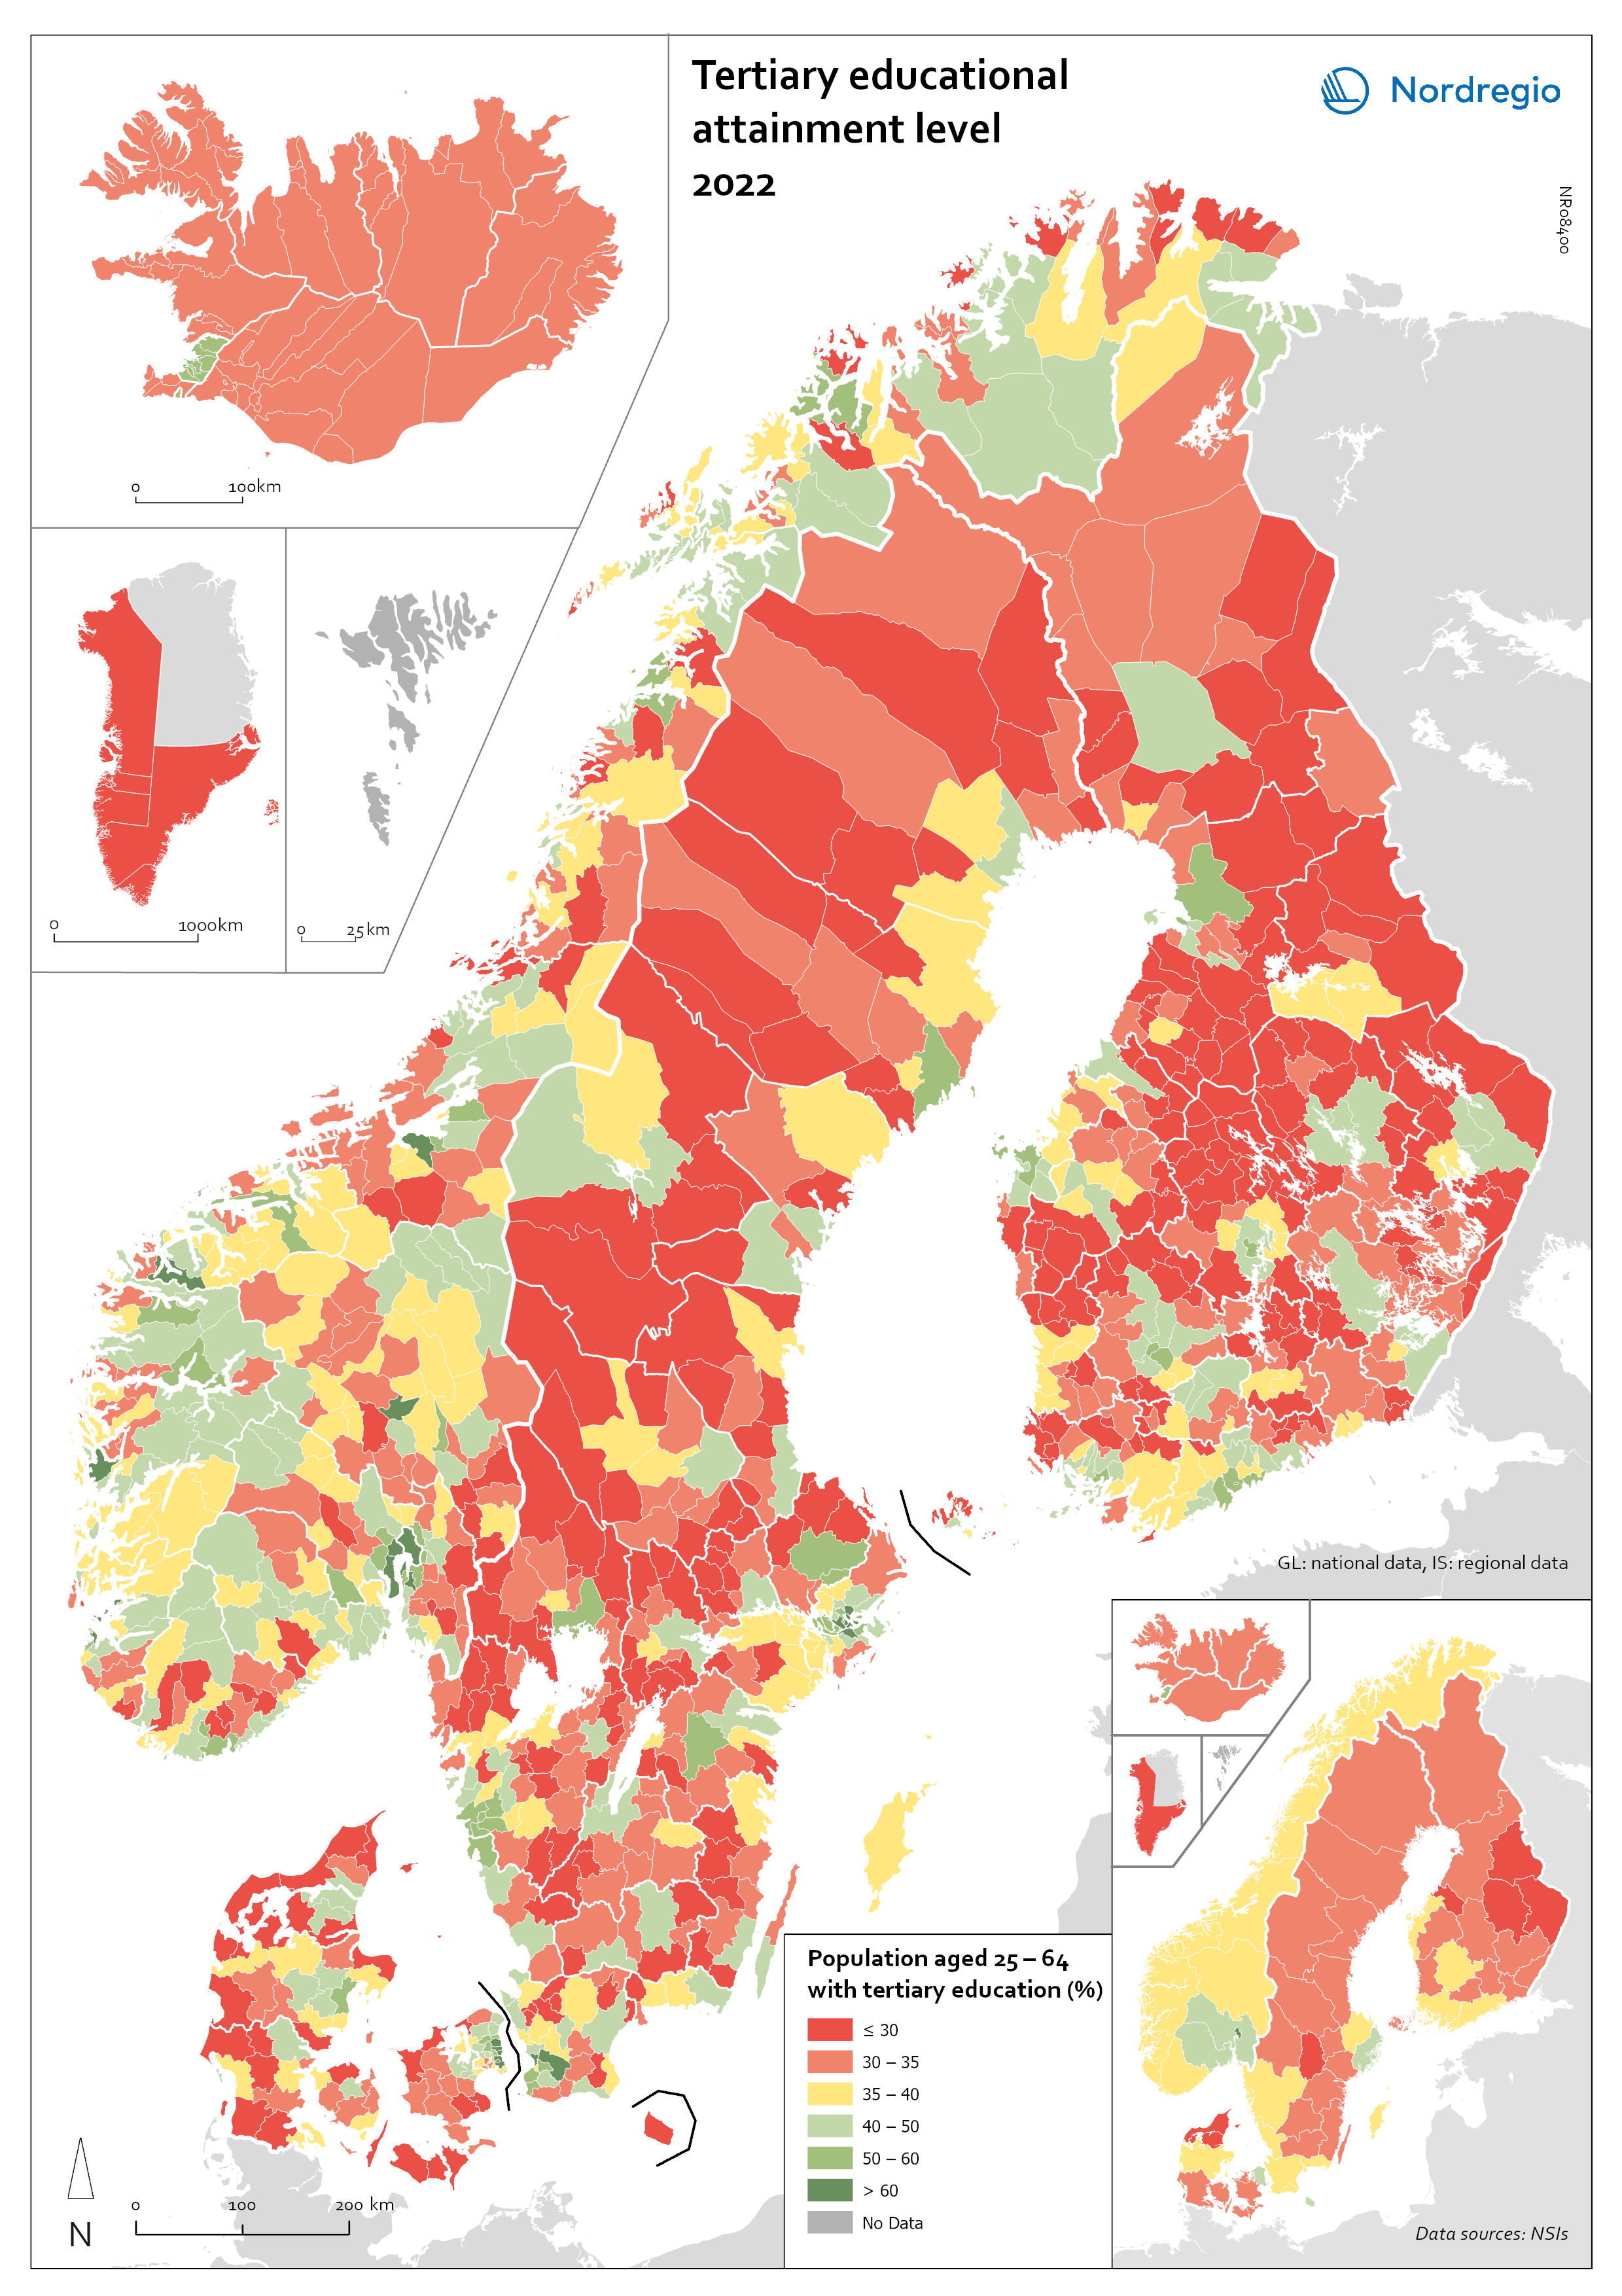
Map 4: Tertiary educational attainment (2022).
Unemployment
Map 5 shows the unemployment rates across Nordic municipalities and regions for 2022, highlighting variations both within and between countries. Areas shaded in darker red indicate higher unemployment rates, while yellow shades represent lower unemployment.
Norway had the lowest unemployment rates in 2022, especially in regions like Trøndelag and Innlandet, where rates were below 1.5%. Many rural municipalities of Norway had low unemployment, and urban municipalities around Oslo and Stavanger had relatively higher rates, although still low compared to other Nordic countries (2.5-3.5%). Denmark shows a similar pattern, with generally low unemployment rates in 2022. Like in Norway, the largest Danish cities such as Copenhagen, Aarhus, Aalborg and Odense had higher unemployment compared to rural municipalities. Finland presents a different scenario, with higher unemployment rates in the rural Eastern and Northern regions, such as Lapland, North and South Karelia. The more densely populated Western regions including urban municipalities like Turku and Tampere, as well as Ostrobothnia, had lower unemployment rates. Sweden had a complex unemployment pattern in 2022. Lower unemployment rates (2.0-3.5%) were observed in both rural municipalities in northern and central parts of the country, including in Norrbotten, Jämtland, and Dalarna, as well as in urban municipalities such as Gothenburg and Stockholm. By and large, however, the more densely populated southern regions had higher unemployment levels.
The violin plot in Figure 5 indicates that, from a Nordic perspective, rural municipalities had lower unemployment rates compared to their intermediate and urban counterparts. These differences are statistically significant at p <= 0.0001. Nevertheless, this result masks cross-country and regional differences, with many rural municipalities in Finland and Sweden experiencing higher-than-average unemployment.
Figure 5: Unemployment rate (2022)

Note: The violin plot does not include Greenland and the Faroe Islands, since they are not part of the urban-rural typology used here (see Annex 1). Iceland is also not included in the violin plot, since data were not available at municipal level.
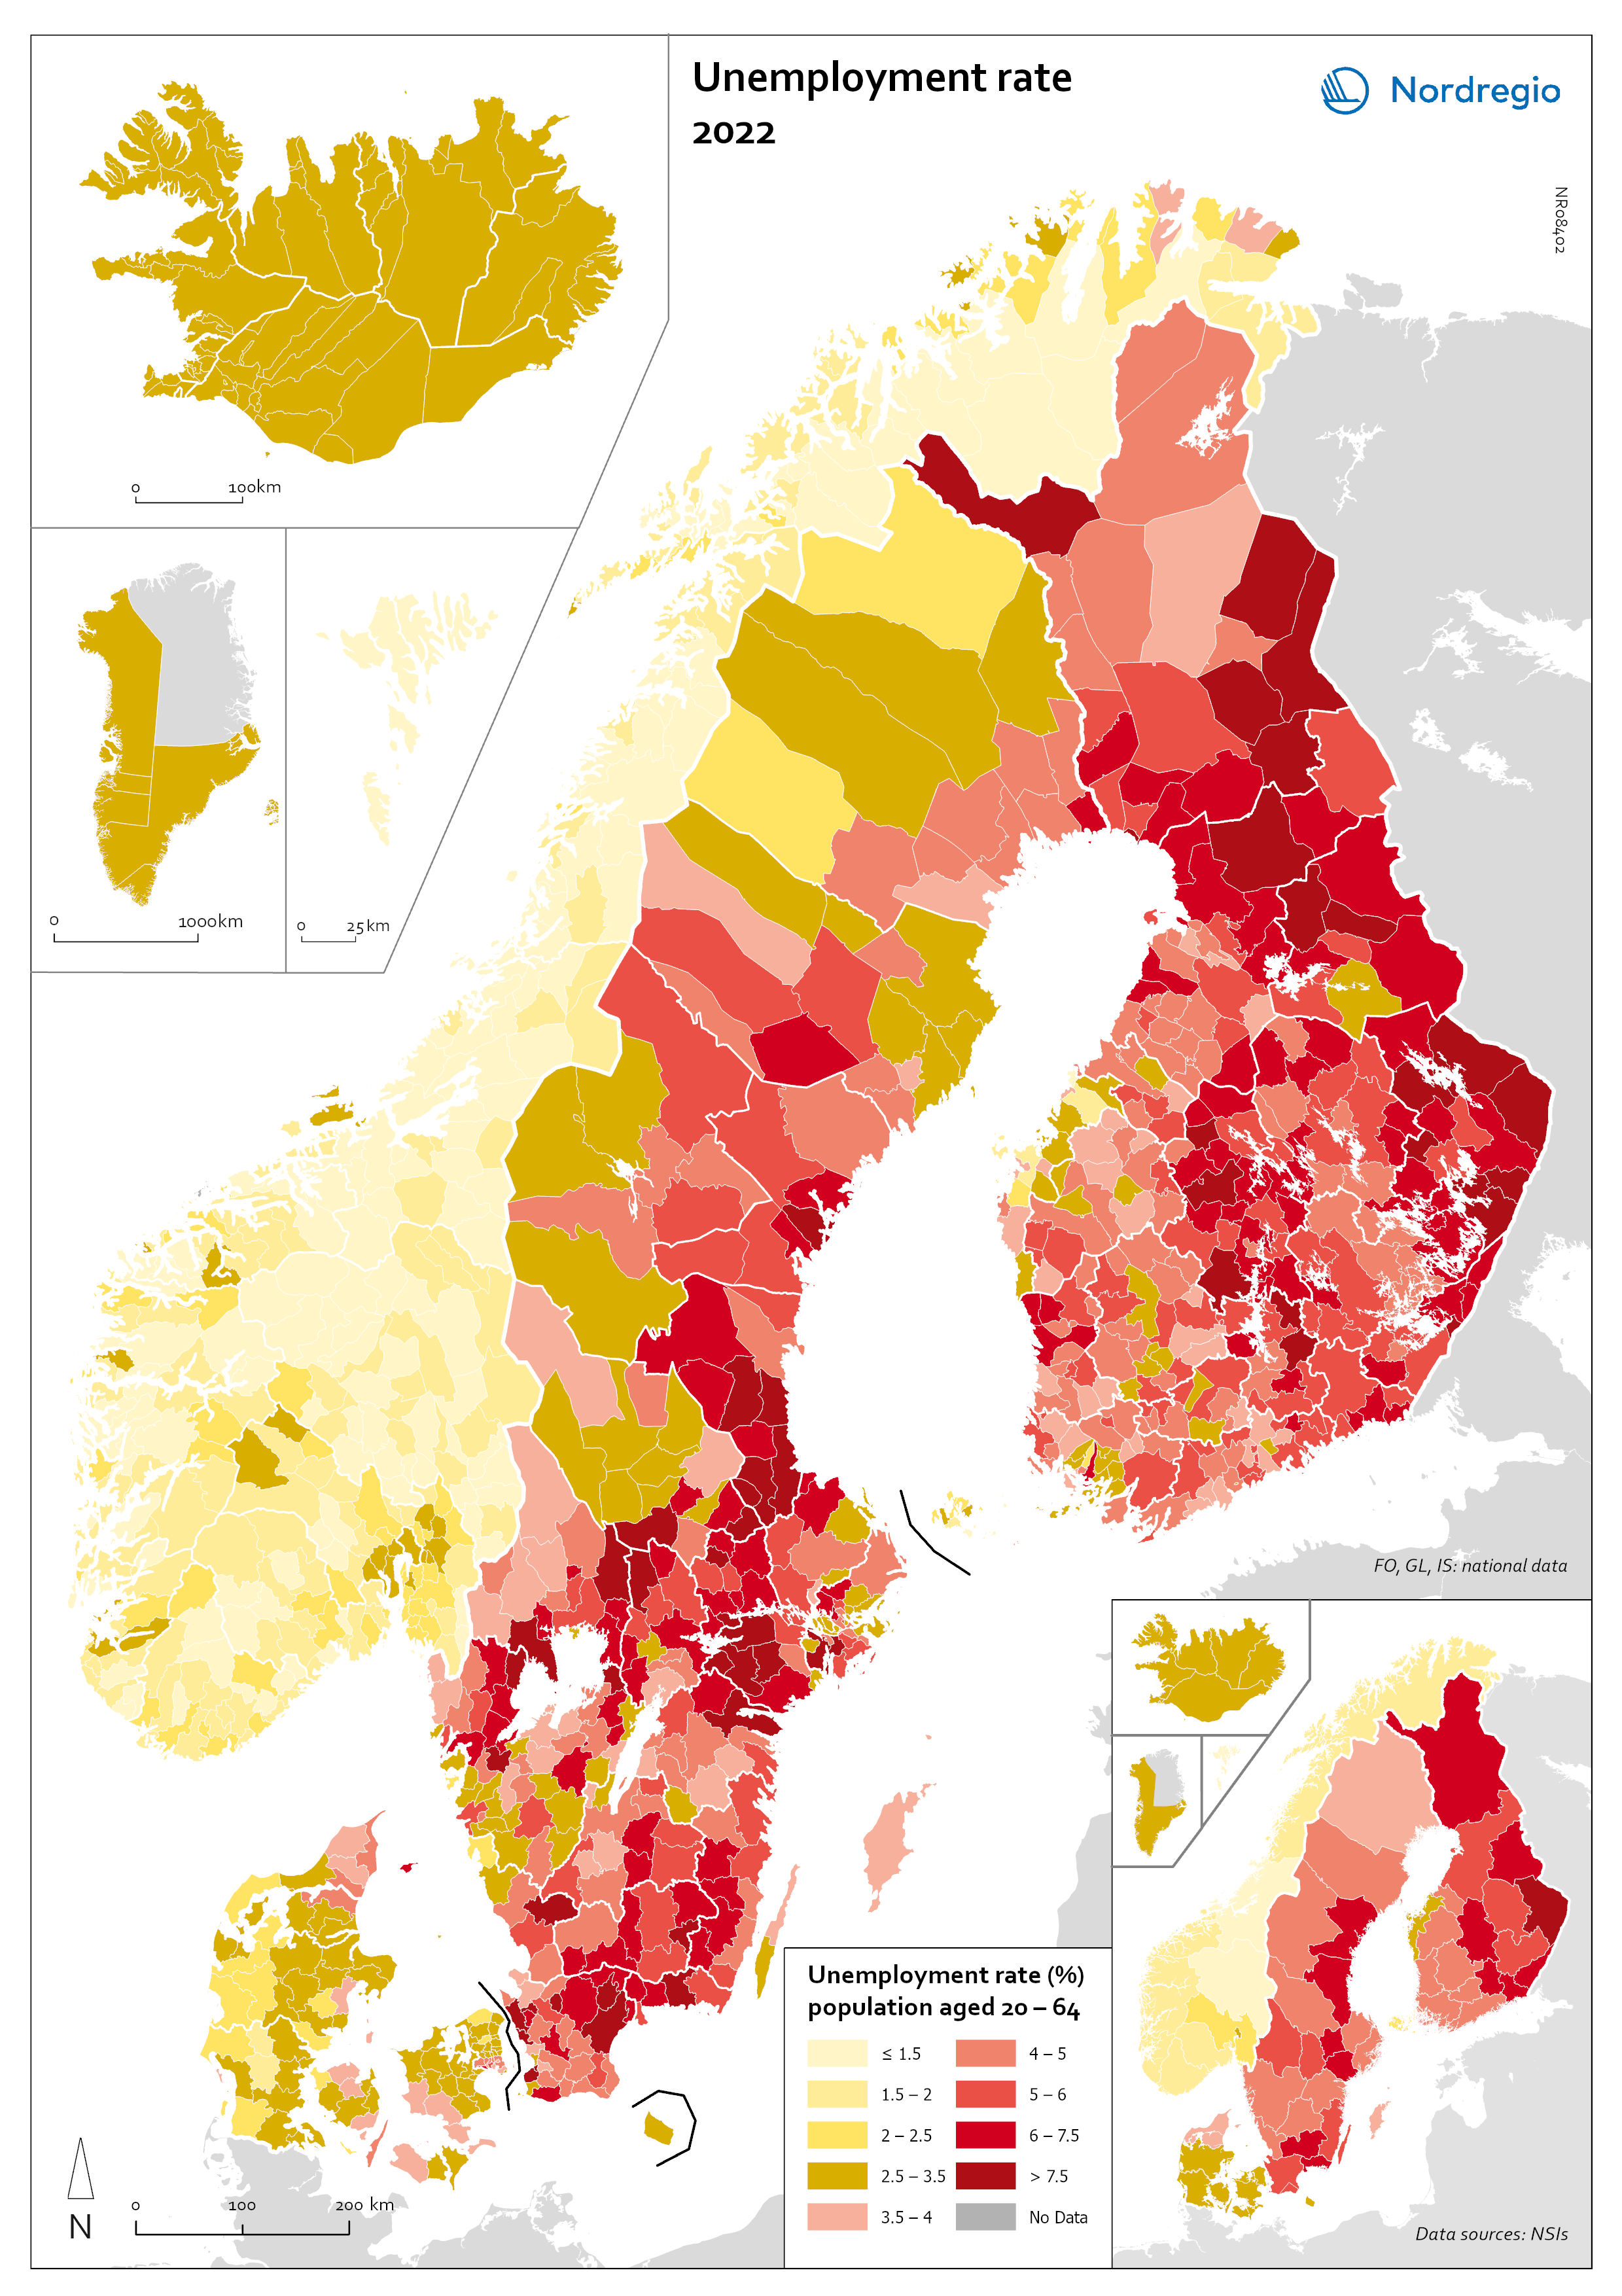
Map 5: Unemployment rate (2022).
Household income
Equivalized income is a measure of household income
Household income refers to the income earned by all members of a household (incl. wages, salaries, self-employment, welfare and social security benefits, pensions, investment income, and other sources of income).
The distribution of equivalised household income across municipalities in the Nordic Region in 2022 shows significant imbalances (Map 6). Two main patterns stand out. First, households in Norway are much wealthier than those in other Nordic countries, with an average equivalised household income of 33,099 EUR-PPP. Greenland has the lowest mean equivalised household income in the region, at 19,695 EUR-PPP. Second, urban households generally have higher incomes than those in rural and intermediate municipalities. This trend is especially noticeable in the largest cities of Sweden, Finland, and, to a lesser extent, Denmark, where urban municipalities offer more economic opportunities. The violin plot indicates that the spatial income differences between urban and intermediate, and urban and rural municipalities are statistically significant at p <= 0.0001. Differences between intermediate and rural municipalities are significant at p <= 0.01. There are also outliers with very high incomes (over 50,000 EUR-PPP) among both urban and rural municipalities. Such outliers are not found among intermediate municipalities (peri-urban municipalities, rural areas close to urban areas and local centers in rural areas). Overall, these patterns highlight economic disparities within and between countries in the Nordic Region, with notable urban-rural divides and differences in national averages contributing to an uneven distribution of household income.
Figure 6: Mean equivalized household income (2022)

Note: The violin plot does not include Greenland and the Faroe Islands, since they are not part of the urban-rural typology used here (see Annex 1). Iceland is also not included, since data were not available at municipal level.
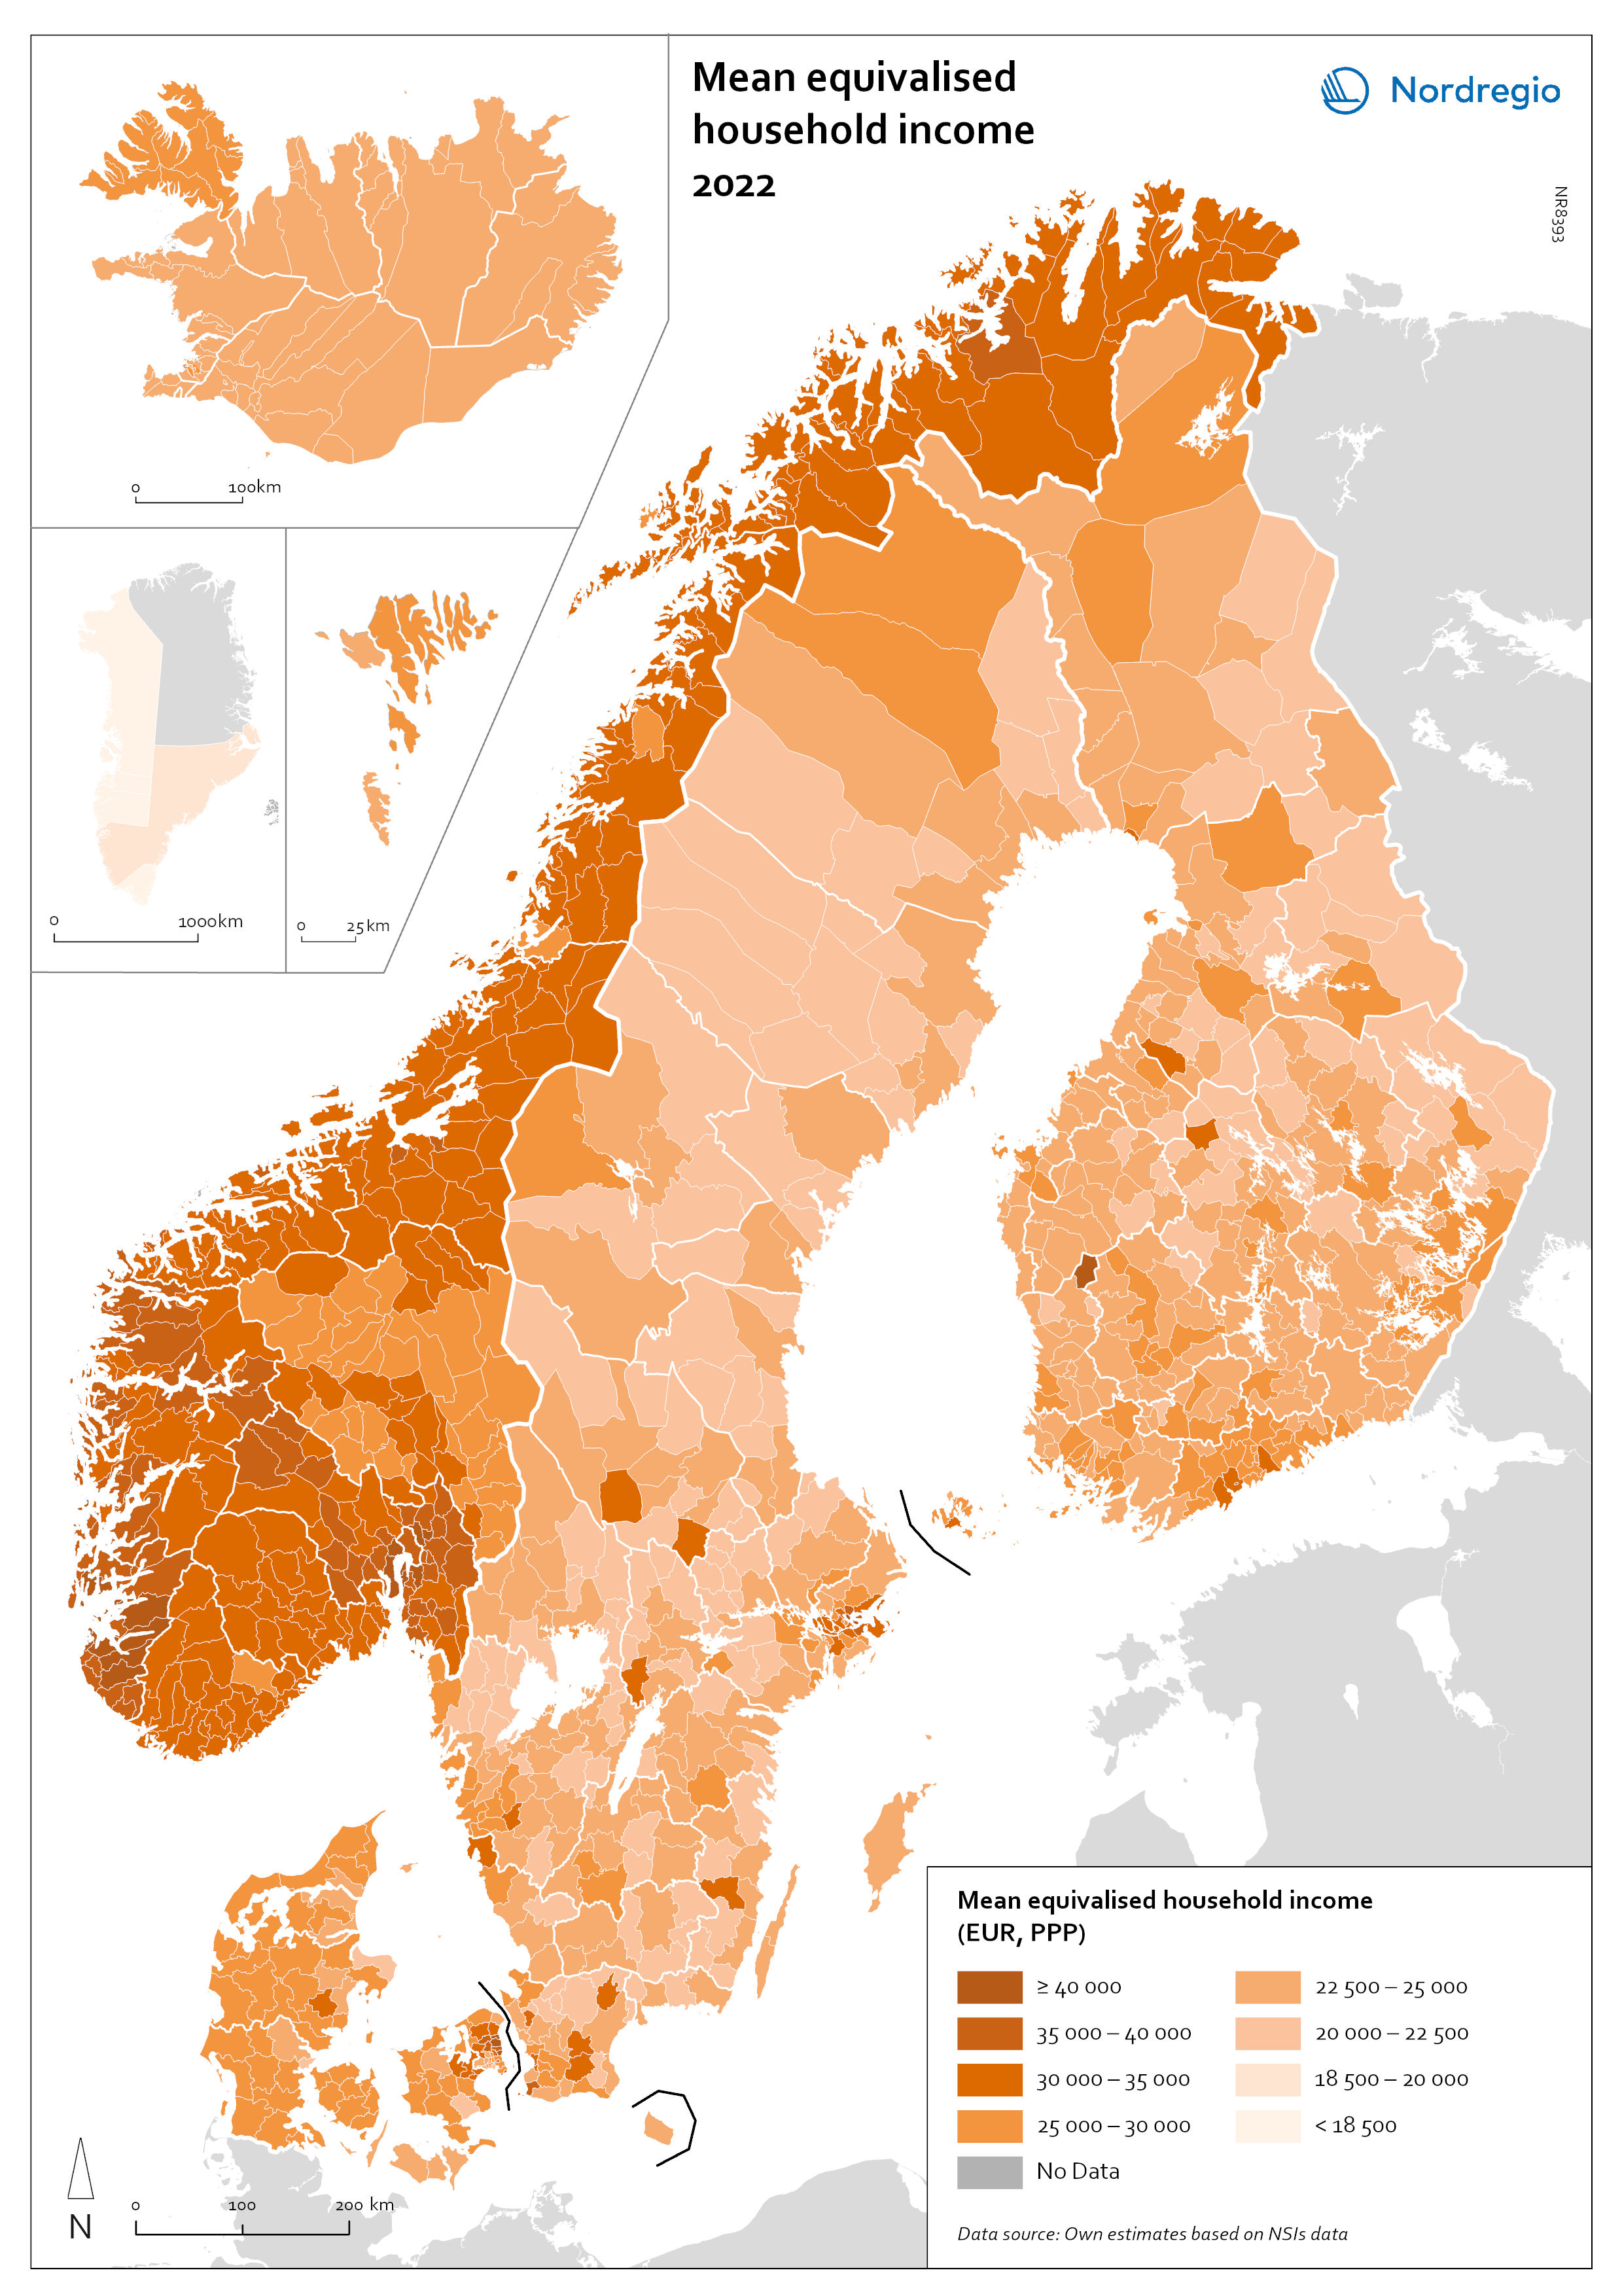
Map 6: Mean equivalized household income (2022).
Economic inequality
The patterns in Figure 6 may conceal significant socio-economic differences within municipalities. This perspective is added in Map 7. The map shows the Gini coefficient at the municipal and regional level across the Nordic Region for 2022, highlighting variations in income inequality. The Gini coefficient, which ranges from 0 to 1, measures inequality: 0 means perfect equality, and 1 means maximum inequality. Higher income inequality is associated with greater levels of poverty and social exclusion, lower levels of perceived wellbeing and happiness, and lower levels of human development (Tapia et al. 2024).
Two patterns stand out from Figure 7. First, household income is generally more equally distributed in Norway and Northern Sweden than in other parts of the Nordic Region. Several factors may explain the lower levels of income inequality in Norway, including the active role of its welfare state in redistributing income, the development of high-income industries like energy production and oil-related activities in many rural areas, and a strong public sector that often dominates the local labour market in rural and remote municipalities (Tapia et al. 2024). Second, income inequalities tend to be higher in urban than in rural municipalities. Apart from some outliers observed in rural Finland and Sweden, most of the municipalities with higher Gini coefficients were located in the largest urban areas in 2022. The violin plot confirms that household income inequalities are generally higher in urban than in rural and intermediate municipalities. The four asterisks above the significance brackets in the violin plot in Figure 7 show that the differences between urban, intermediate and rural municipalities in the Nordic Region are statistically significant at p <= 0.0001. The violin plot also shows the presence of several statistical outliers. Among urban municipalities, outliers tend to show higher than expected levels of inequality (Gini coefficients of 0.4 and higher). Among rural municipalities, there are outliers in both directions - some with Gini coefficients of over 0.3, and a few that approach income equality (Gini coefficients below 0.1).
Figure 7: Household income inequality (Gini coefficient, 2022)
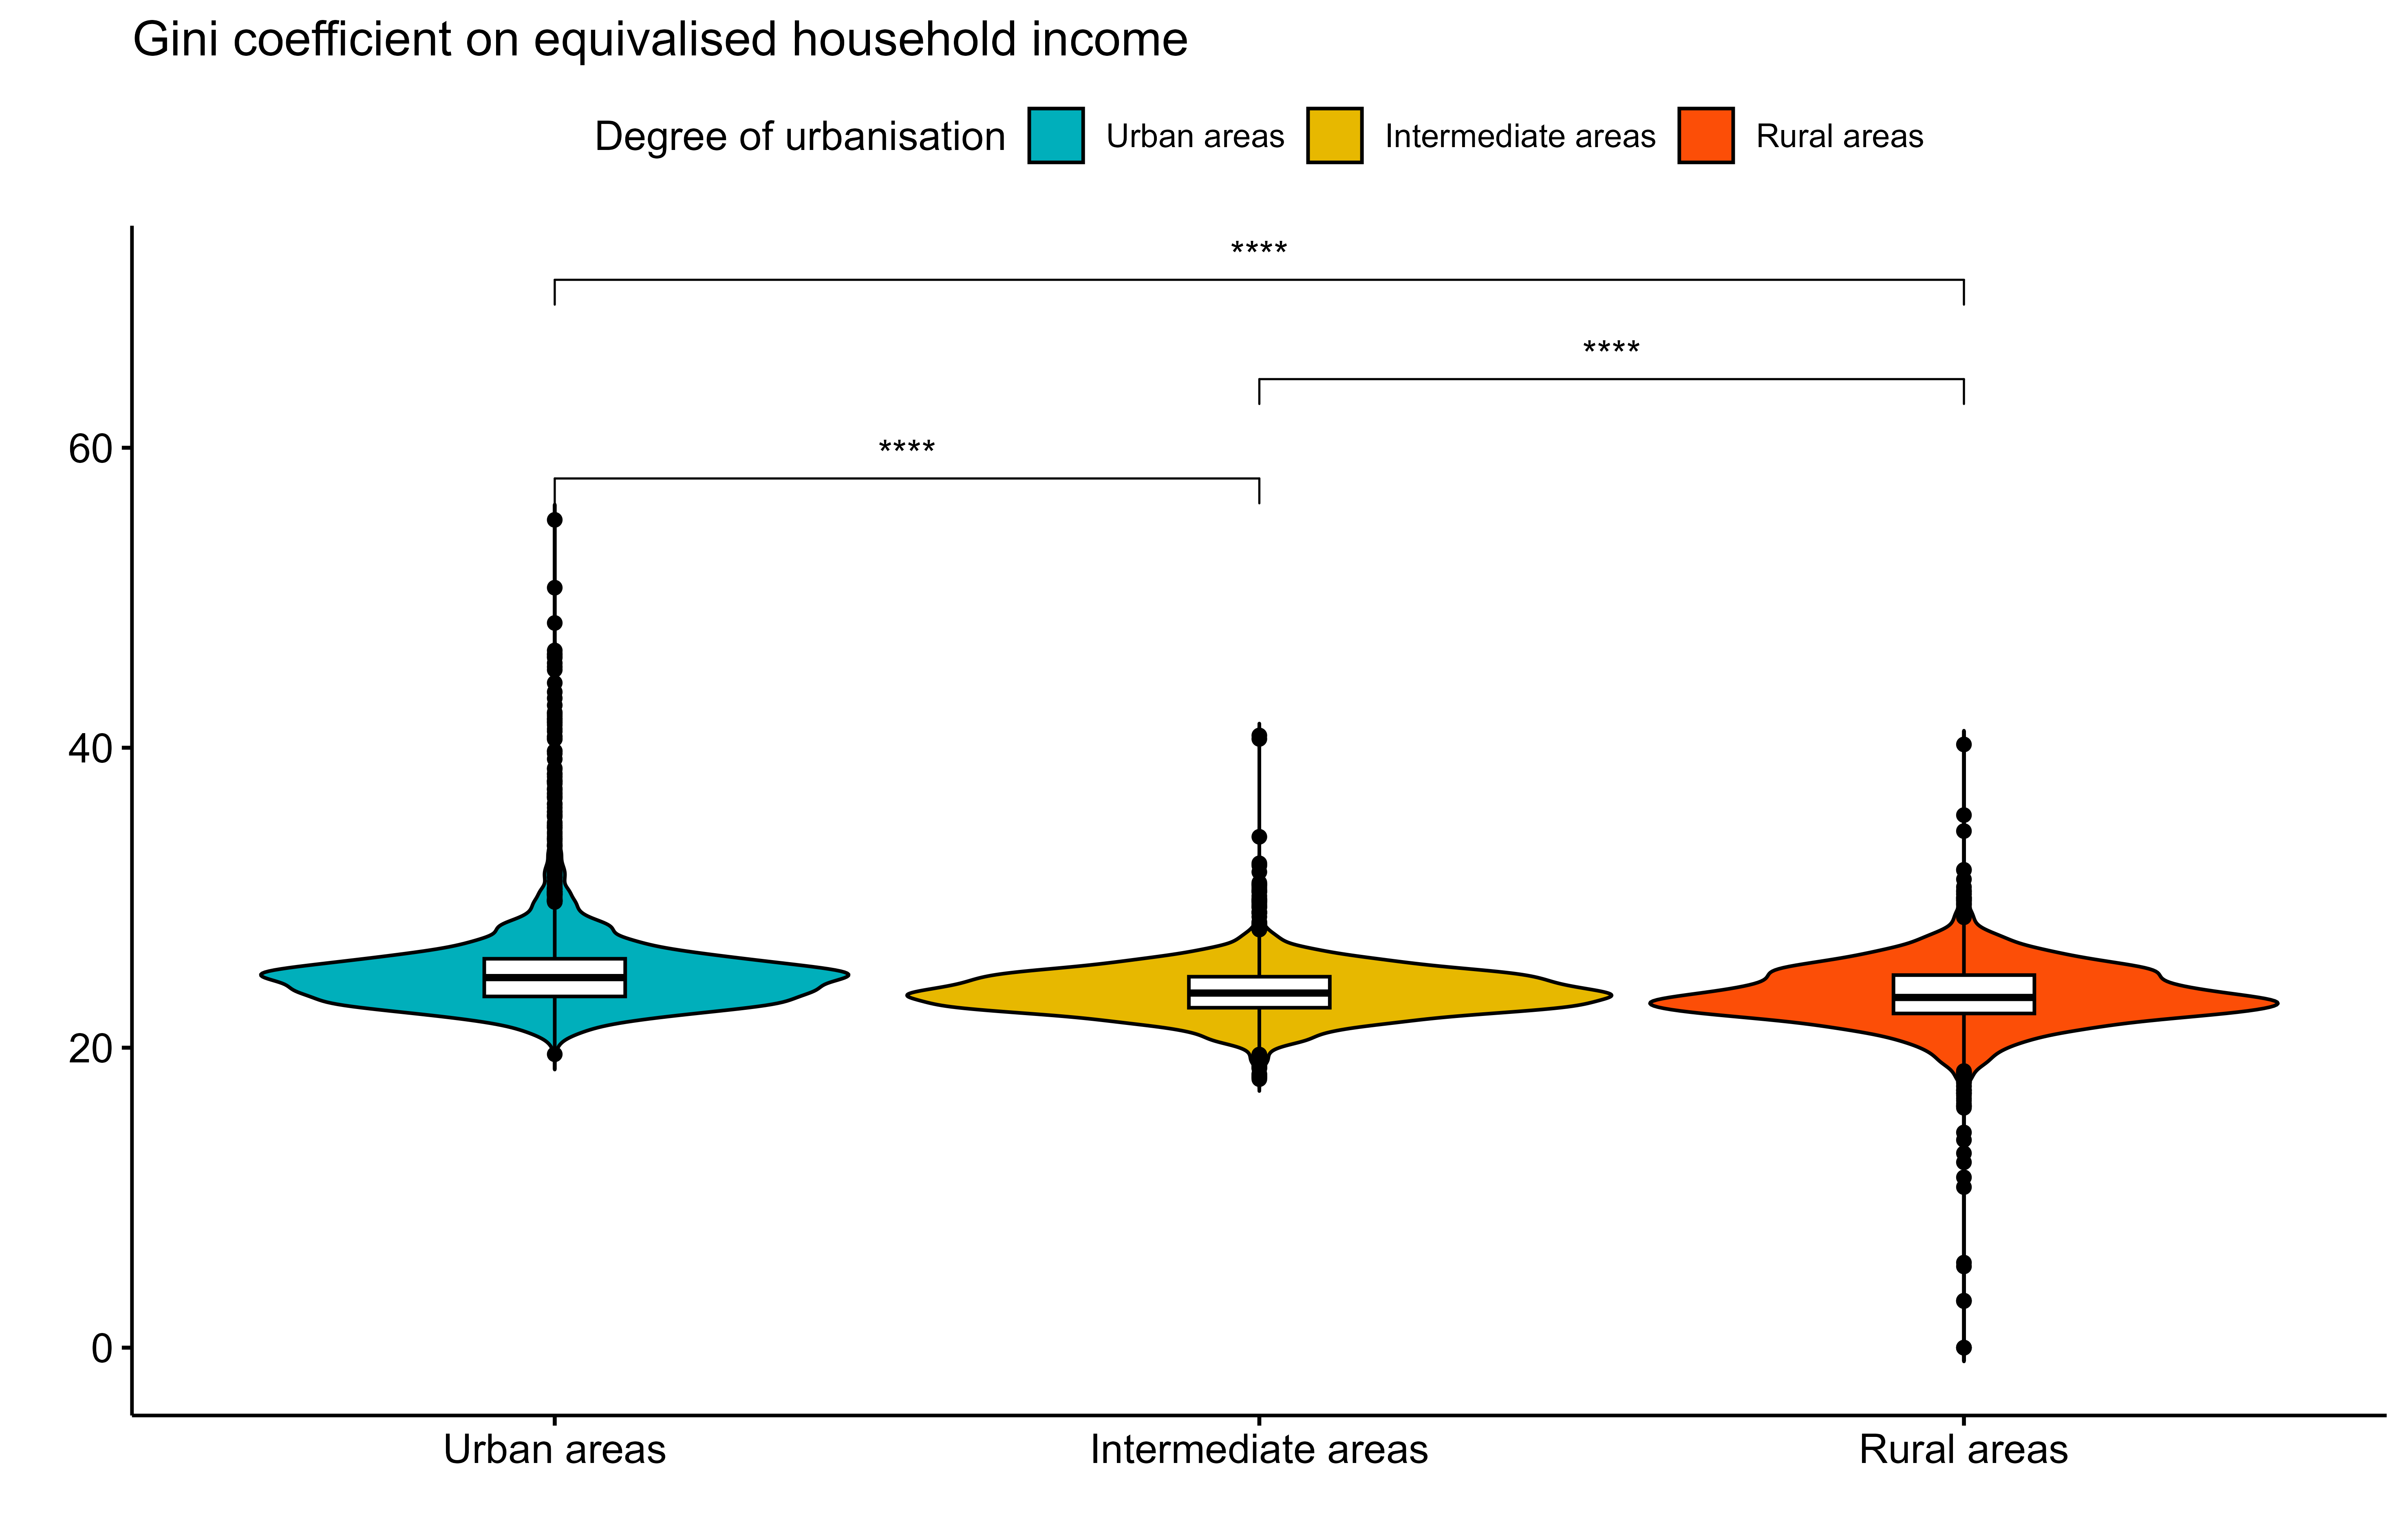
Note: The violin plot does not include Greenland and the Faroe Islands, since they are not part of the urban-rural typology used here (see Annex 1). Iceland is also not included, since data were not available at municipal level.

Map 7: Household income inequality (Gini coefficient, 2022).