Photo: Thomas Richter/Unsplash
Economic sustainability characteristics:
Employment composition, greenhouse gas emissions and green jobs
Stability of regional labour markets
The rolling average of employment composition smooths the inter-annual change rates in the sectoral distribution of employment across NACE sectors over the past four years. The indicator should be interpreted as a relative measure of sectoral employment stability, rather than an indicator of balanced or skewed job distribution. It can highlight structural changes in the sectoral distribution of employment in the Nordic regions.
Map 8 represents the rolling average change rate in employment distribution across 10 NACE sectors in the Nordic Region for 2022, highlighting regional differences in sectoral employment changes during the previous four years
Since the data on sectoral distribution of employment were only available at regional (NUTS3) level, all of the municipalities included in each region share the same value.
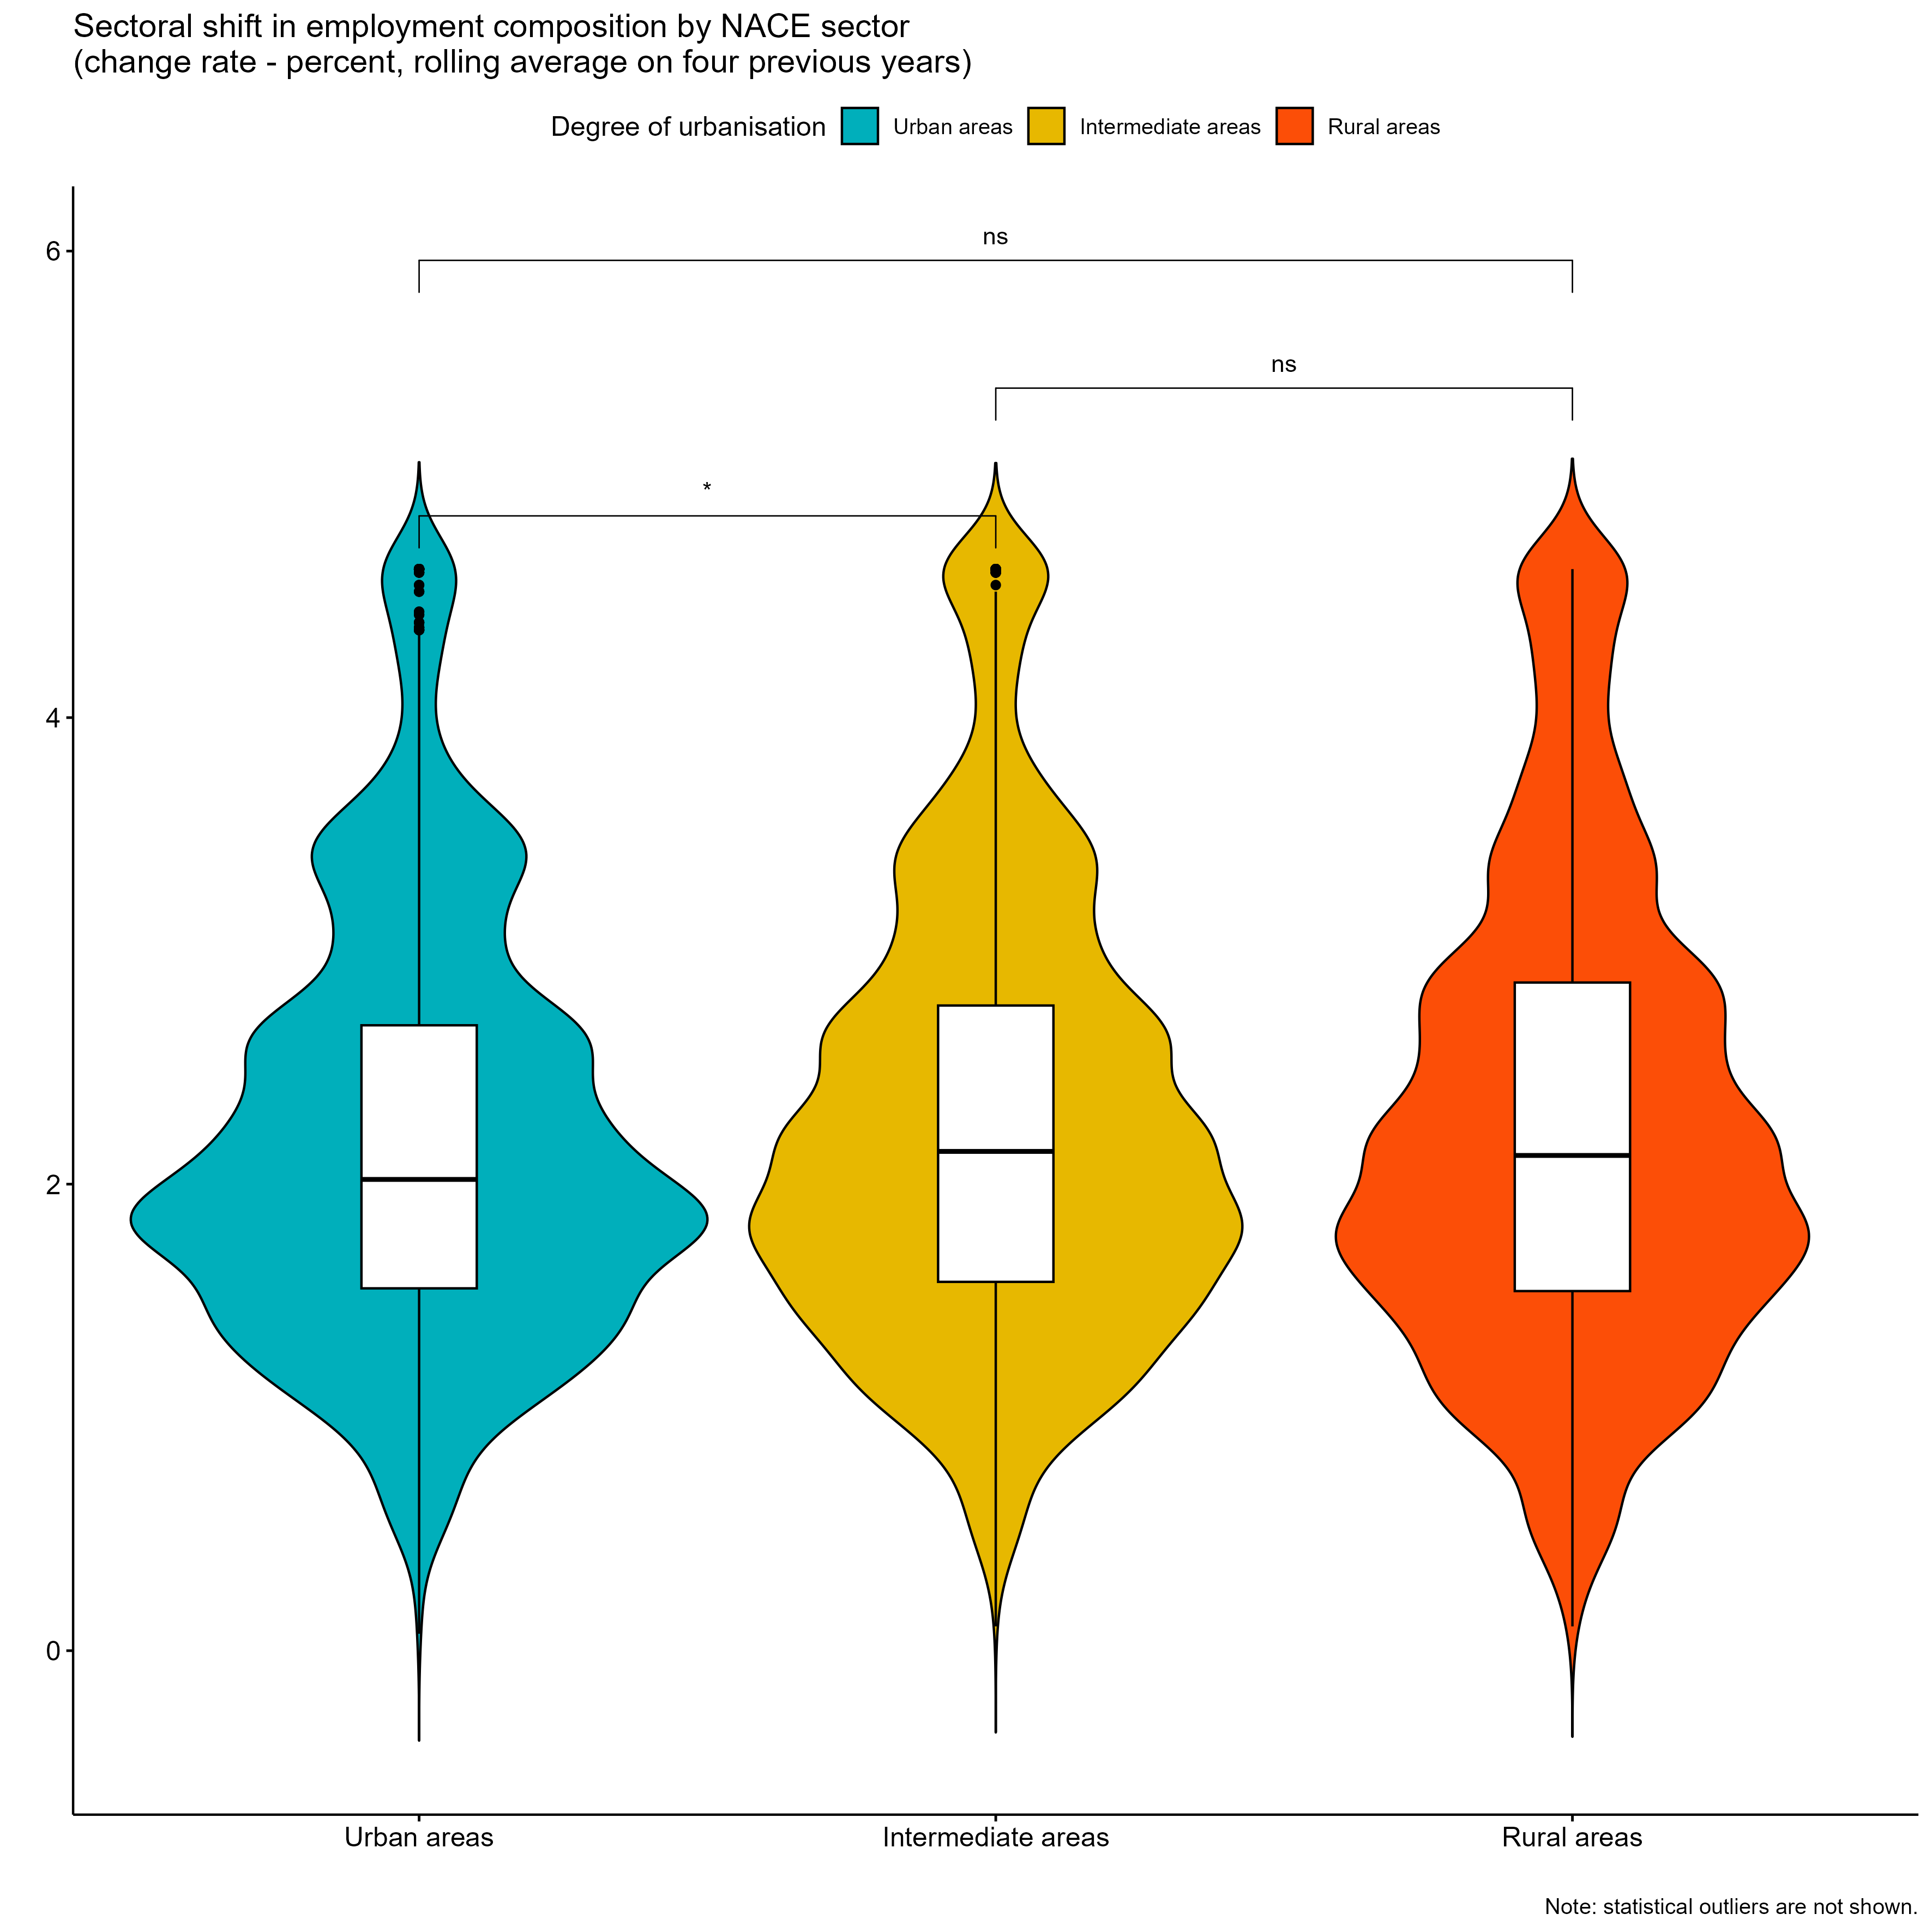
Wilcoxon test results shown above the violin plot in Figure 8 indicate that differences in the change in employment composition between urban and intermediate regions are statistically significant at p <= 0.05. However, differences between urban and rural municipalities, as well as between intermediate and rural municipalities, do not appear to be statistically significant at conventional levels. In other words, spatial differences in the sectoral employment shifts by region and degree of urbanization are less pronounced across the Nordic Region.
Figure 8: Employment composition (2022)
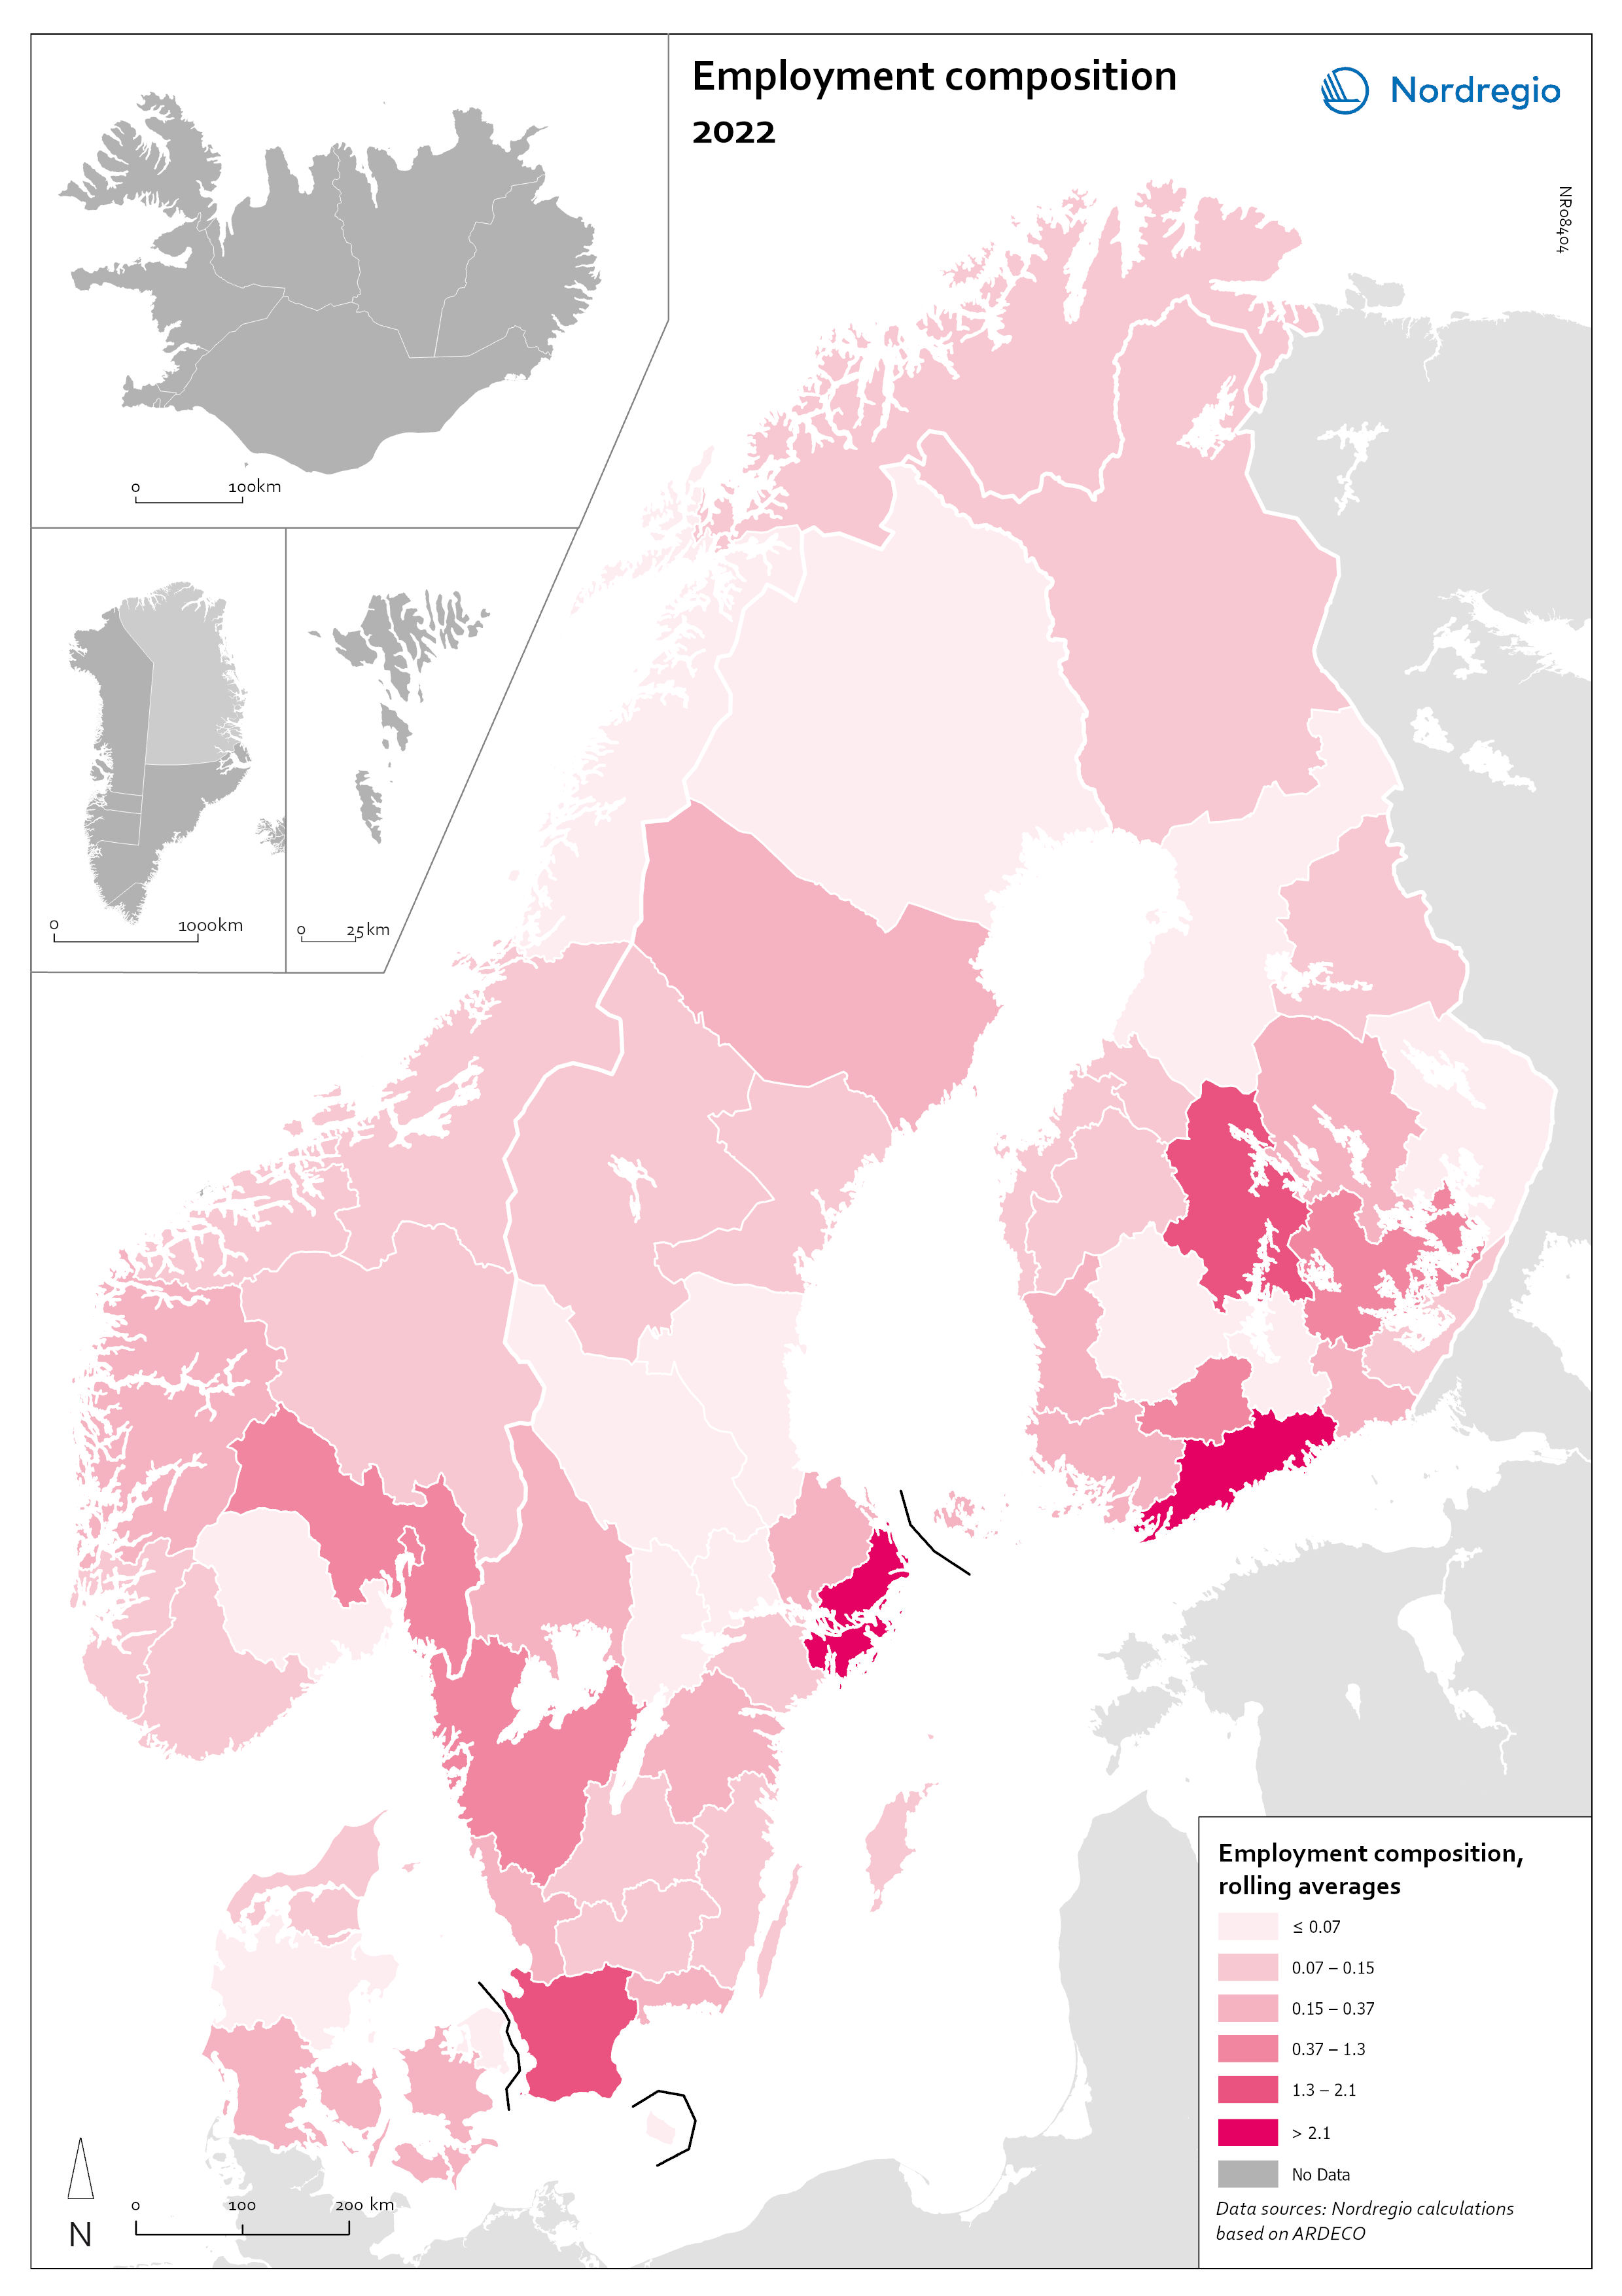
Map 8: Employment composition (2022).
Note: Data on employment composition are only available at regional (NUTS-3) level. Therefore, this map compares Nordic regions. Employment composition data are not available for Iceland, Greenland and the Faroe Islands. Individual municipalities may not always reflect the employment composition registered at regional level.
Greenhouse gas emissions
Map 9 shows greenhouse gas (GHG) emissions per employee in 2022 across the Nordic Region. On average, GHG emissions per employee in the region were 15.7 tonnes, exceeding the EU average of 13.5 tonnes. To estimate emissions at the municipal and regional level, we calculated average emissions per sector and used employment data by sector to estimate emissions per person employed at the municipal level. These results assume uniform GHG emissions for all jobs within the same sector.
Regionally, Åland had the highest emissions per employee at 40 tonnes, followed by Southern Denmark with 31 tonnes, Satakunta in Finland, Iceland with 29 tonnes, and Vestfold og Telemark in Norway with 28 tonnes. In contrast, the Swedish regions of Stockholm (5 tonnes), Blekinge (7 tonnes), and Jönköping (8 tonnes) had the lowest emissions. Åland's high emissions are mainly due to sea transport, which makes up over 70% of its total emissions because of its role as a ferry traffic hub between Sweden and Finland.
Municipalities with high emissions per employee are often dominated by sectors with high emissions, such as transport (e.g., Brøndby, Denmark), agriculture (e.g., Tønder, Denmark), refineries (e.g., Porvoo, Finland), and other industrial processes (e.g., Oxelösund, Sweden). Overall, emissions per employee tend to be higher in rural municipalities (24 tonnes) compared to intermediate municipalities (18 tonnes) and urban municipalities (13 tonnes). The four asterisks above the significance brackets in the violin plot show that the differences in between urban, intermediate and rural municipalities in the Nordic Region are statistically significant at p <= 0.0001. The violin plot also shows the existence of several outliers where average emissions are particularly high. These are municipalities where employment is dominated by activities with particularly high emission intensities.
Figure 9: Greenhouse gas emissions per employee (2022)
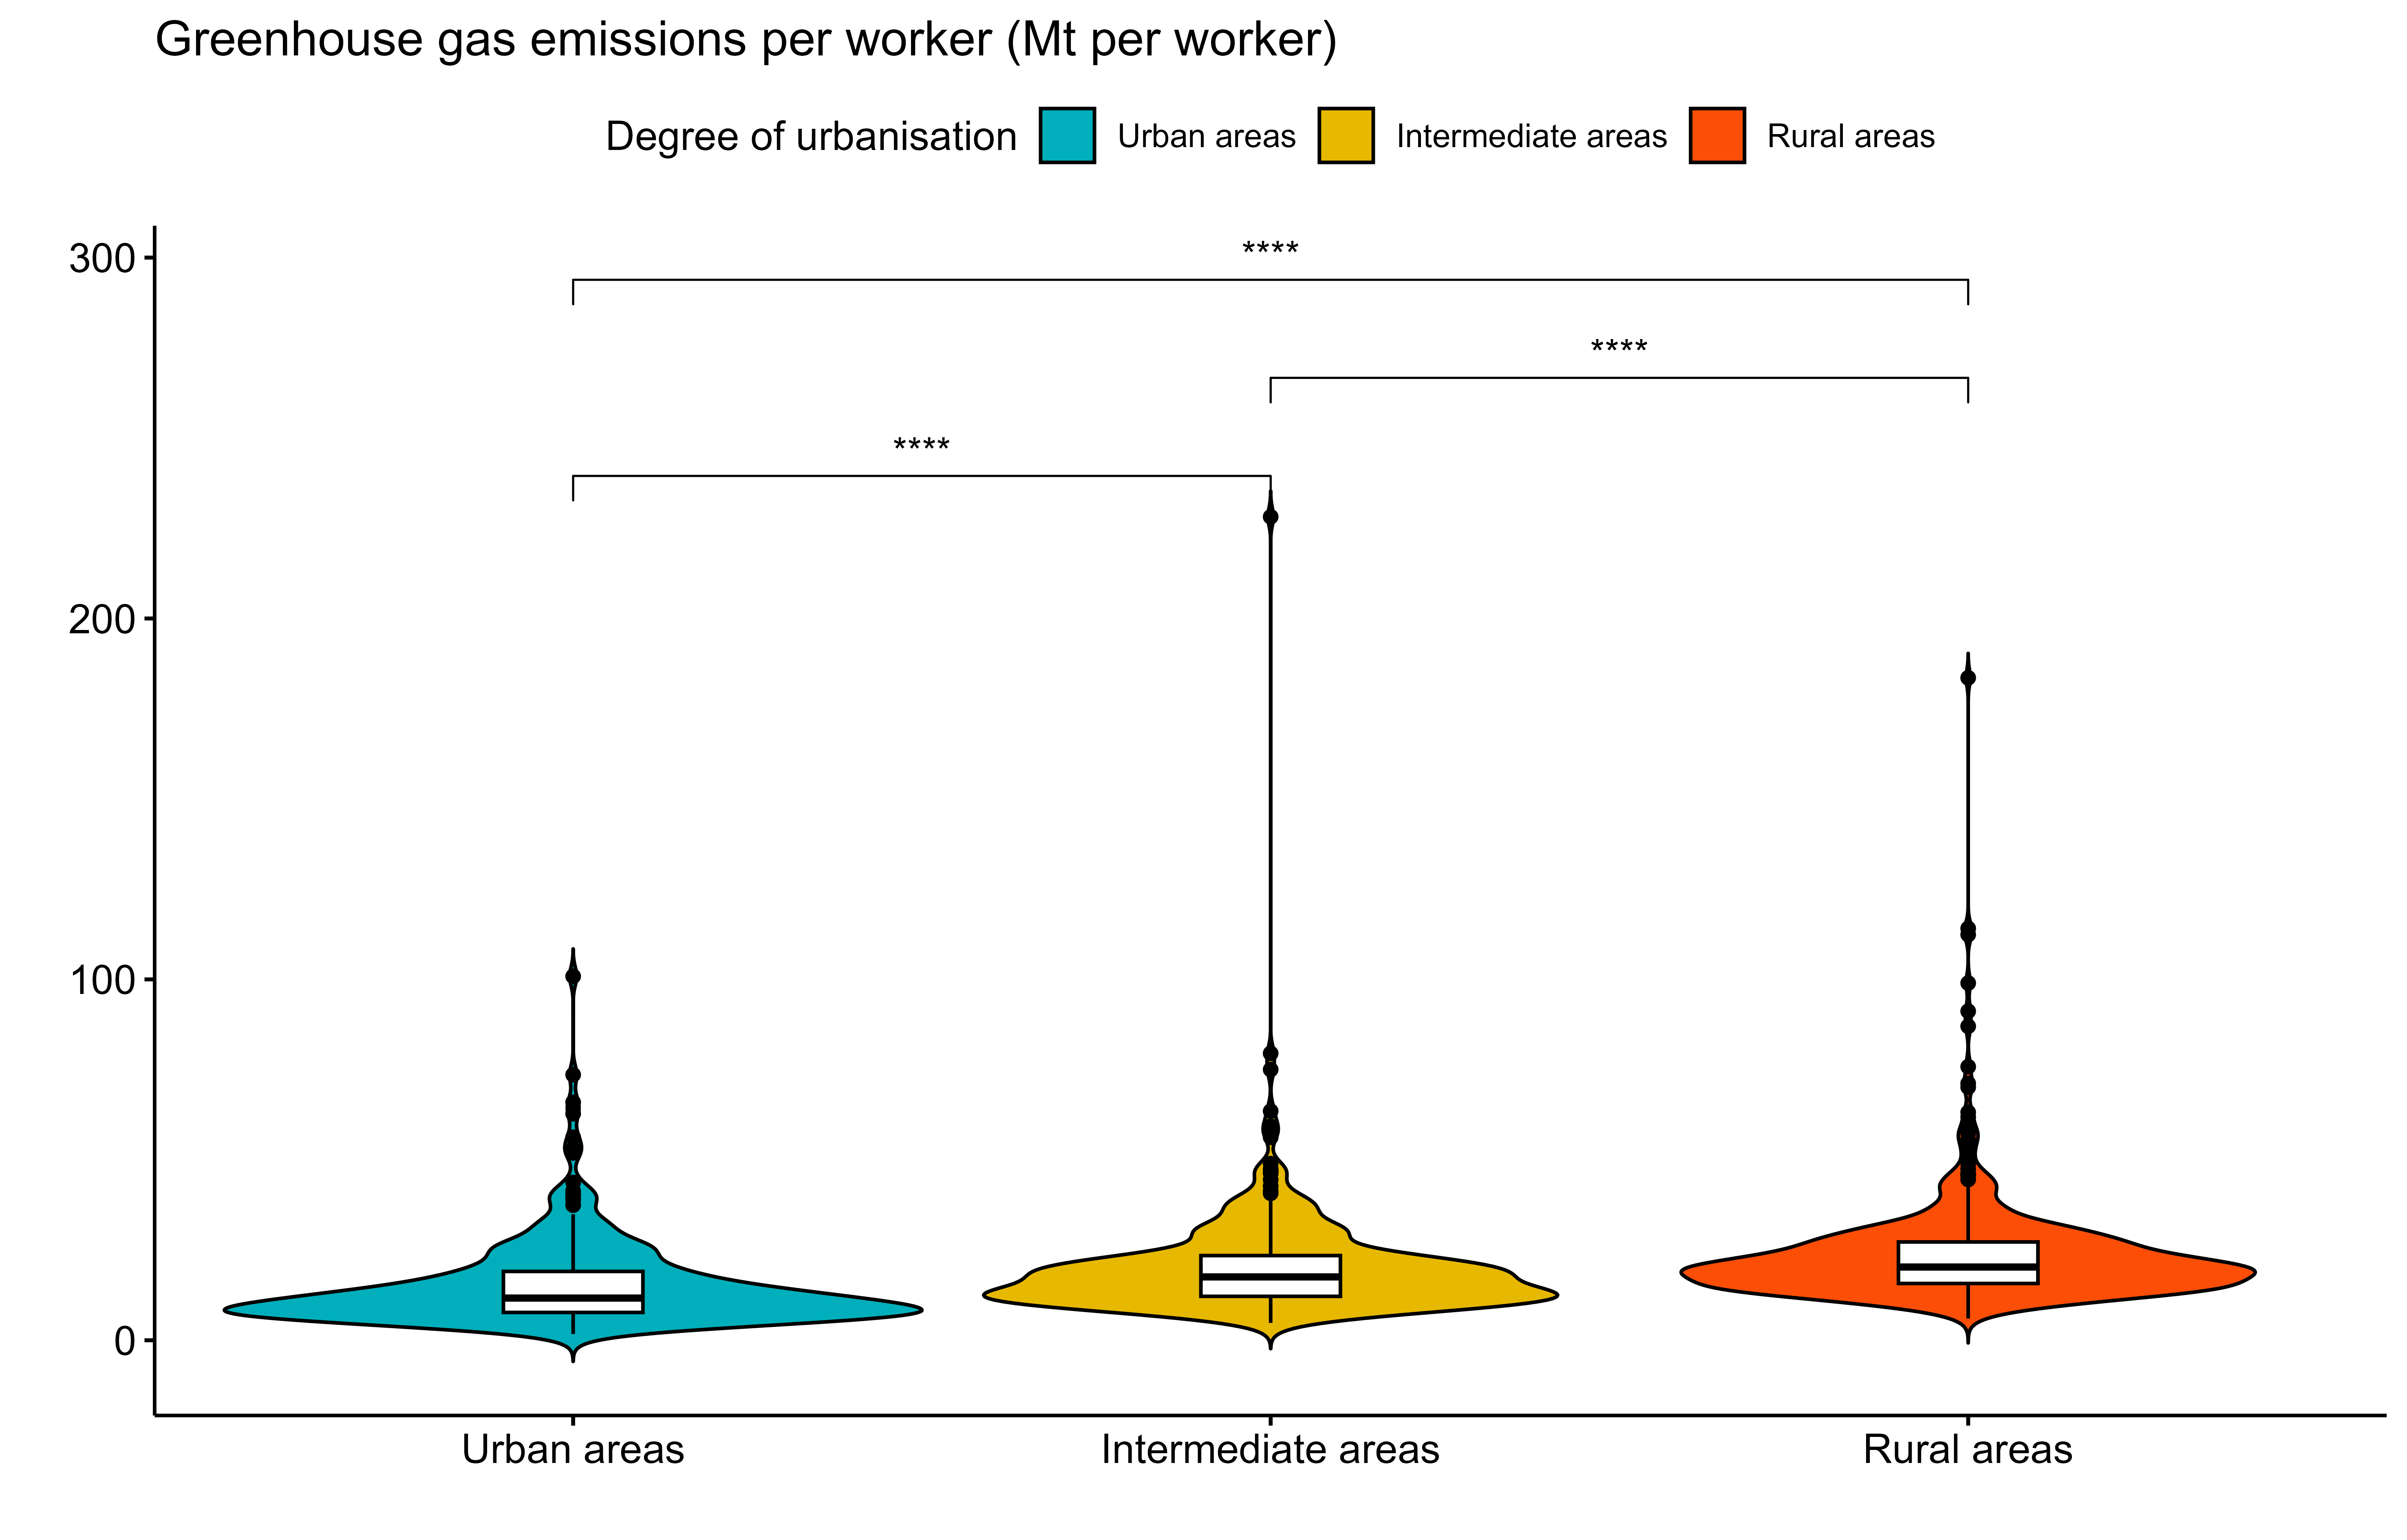
Note: Data were not available for Greenland and the Faroe Islands. The violin plot does not include Iceland, since data were not available at municipal level
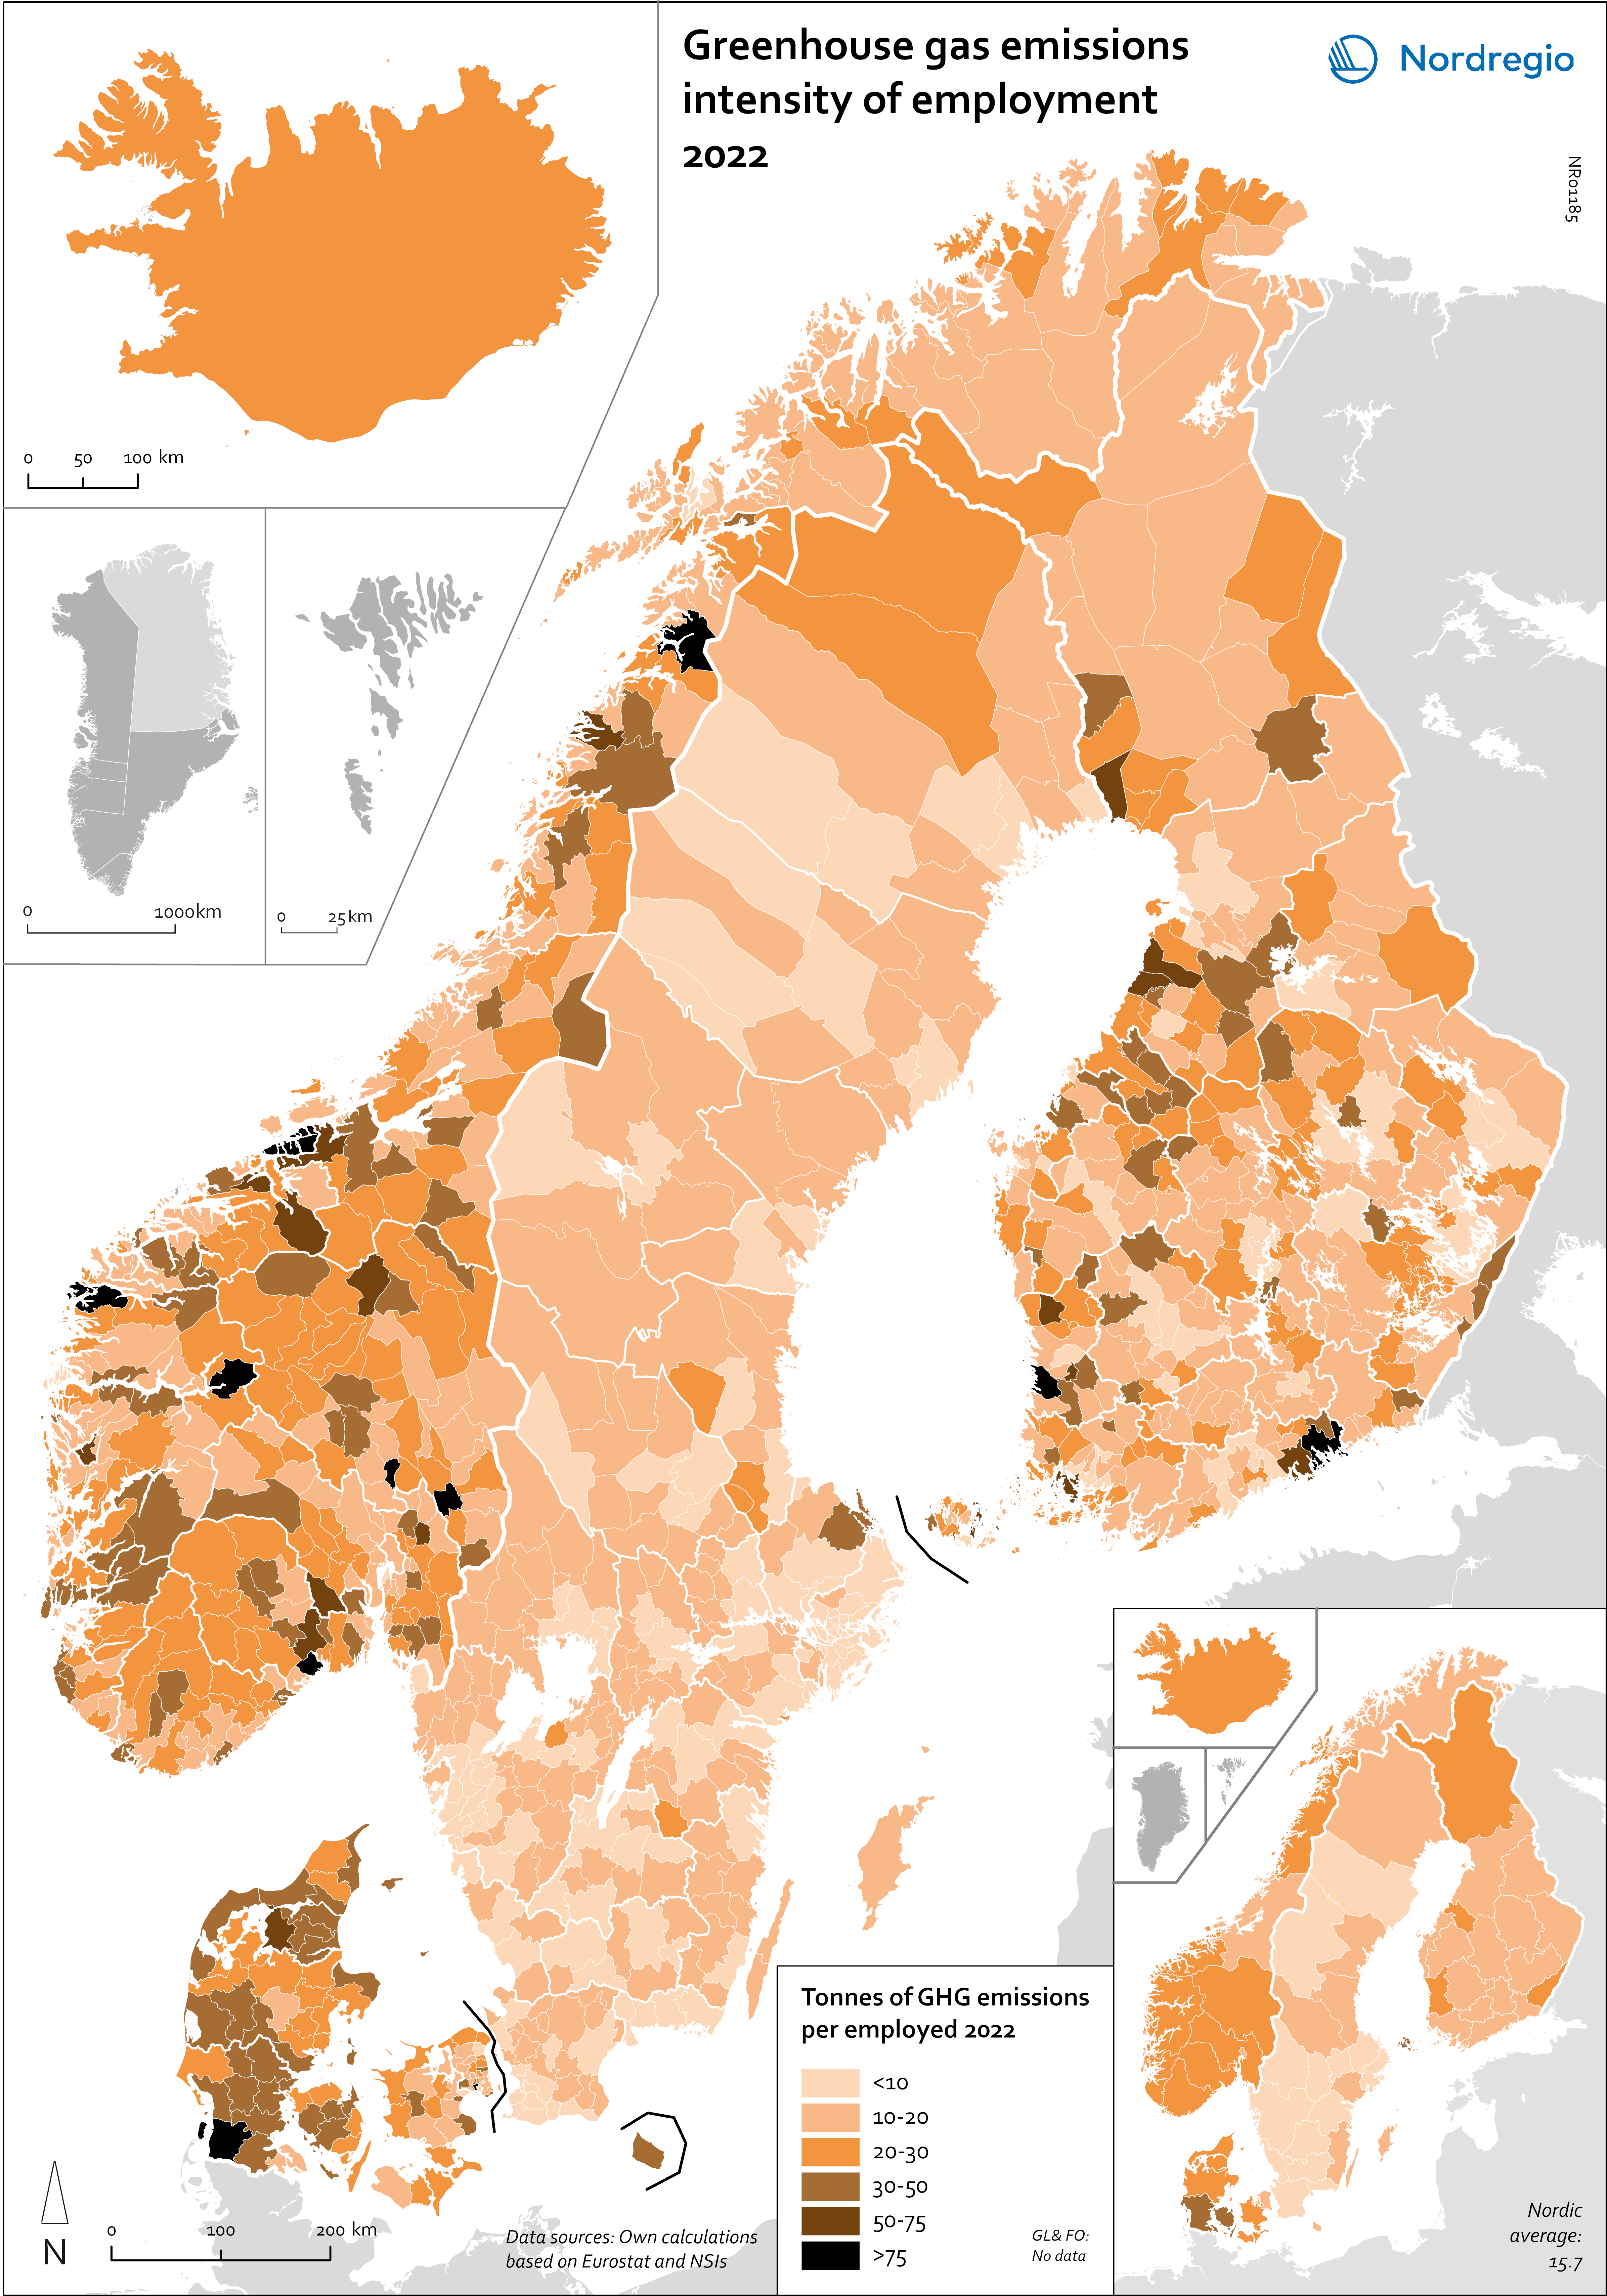
Map 9: Greenhouse gas emissions per employee (2022).
Green jobs
Figure 10 shows the share of green jobs in 2021, as defined by Vona and colleagues (2017) and the OECD (2023). This approach classifies occupations based on green skills and tasks, focusing on roles in engineering, management, monitoring, and science. Using International Standard Classification of Occupations (ISCO) data, 83 out of 437 occupations are classified as green. Harmonized with OECD standards, our analysis identifies green jobs at the municipal and regional levels across the Nordic Region.
Urban municipalities have a higher prevalence of green jobs, averaging 28% compared to 21% in rural municipalities, with capital cities leading the way. Stockholm (30%) and Copenhagen (27%) are among the top areas for green jobs. In Sweden, municipalities like Sundbyberg and industrial hubs such as Burlöv (34%) and Gnosjö (32%) surpass 30% of green jobs. Norway’s leaders include Sandnes (35%), Stavanger (32%), and Bærum (36%), with Rogaland transitioning its skilled oil workforce to green jobs. Finland’s Uusimaa region leads, with municipalities like Espoo (30%) and Uusikaupunki (33%) excelling due to industries embracing sustainability. In Denmark, Allerød (41%) and Copenhagen (30%) top the list, with regional shares ranging from 27% in Hovedstaden to 17% in Sjælland. Municipalities classified as rural and intermediate show comparatively smaller proportions of green jobs. The violin plot in Figure 10 shows that the differences in green jobs between rural, intermediate and urban municipalities are statistically significant at p <= 0.0001.
Figure 10: Share of jobs involving green tasks (2021)
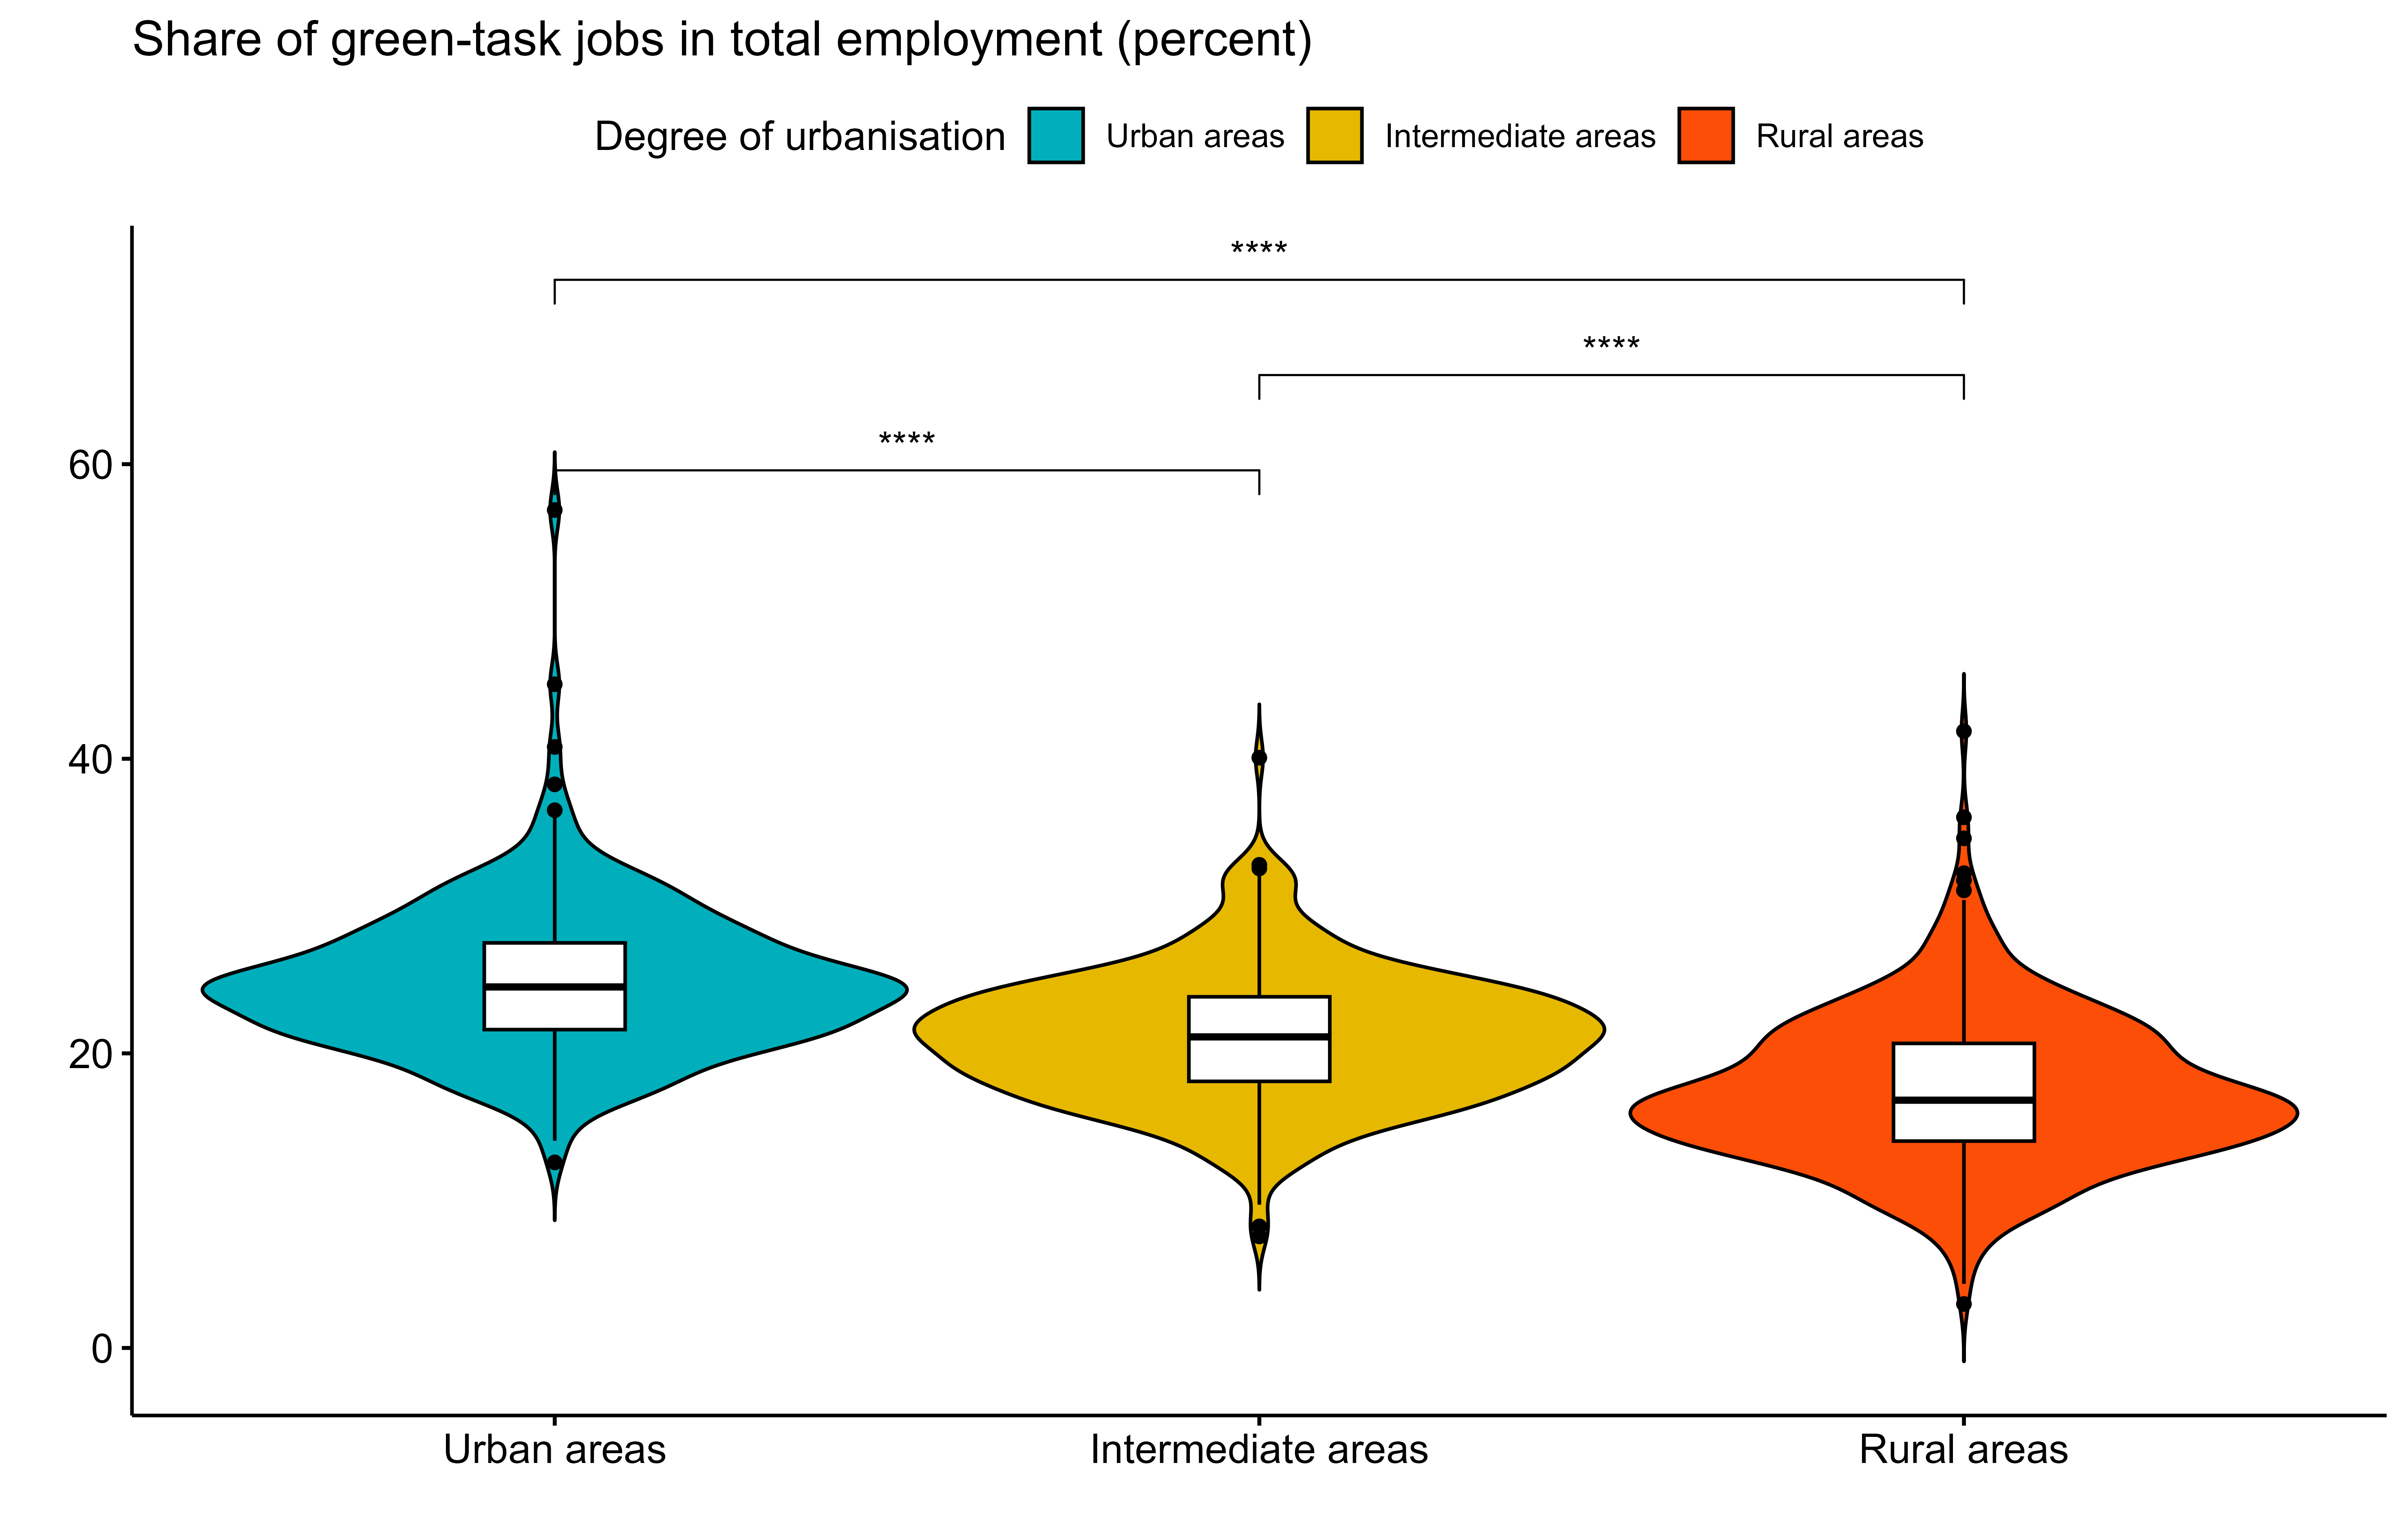
Note: Data were not available for Greenland. The violin plot does not include the Faroe Islands, since they are not part of the urban-rural typology used here (see Annex 1). Iceland is also not included in the violin plot, since data were not available at municipal level.
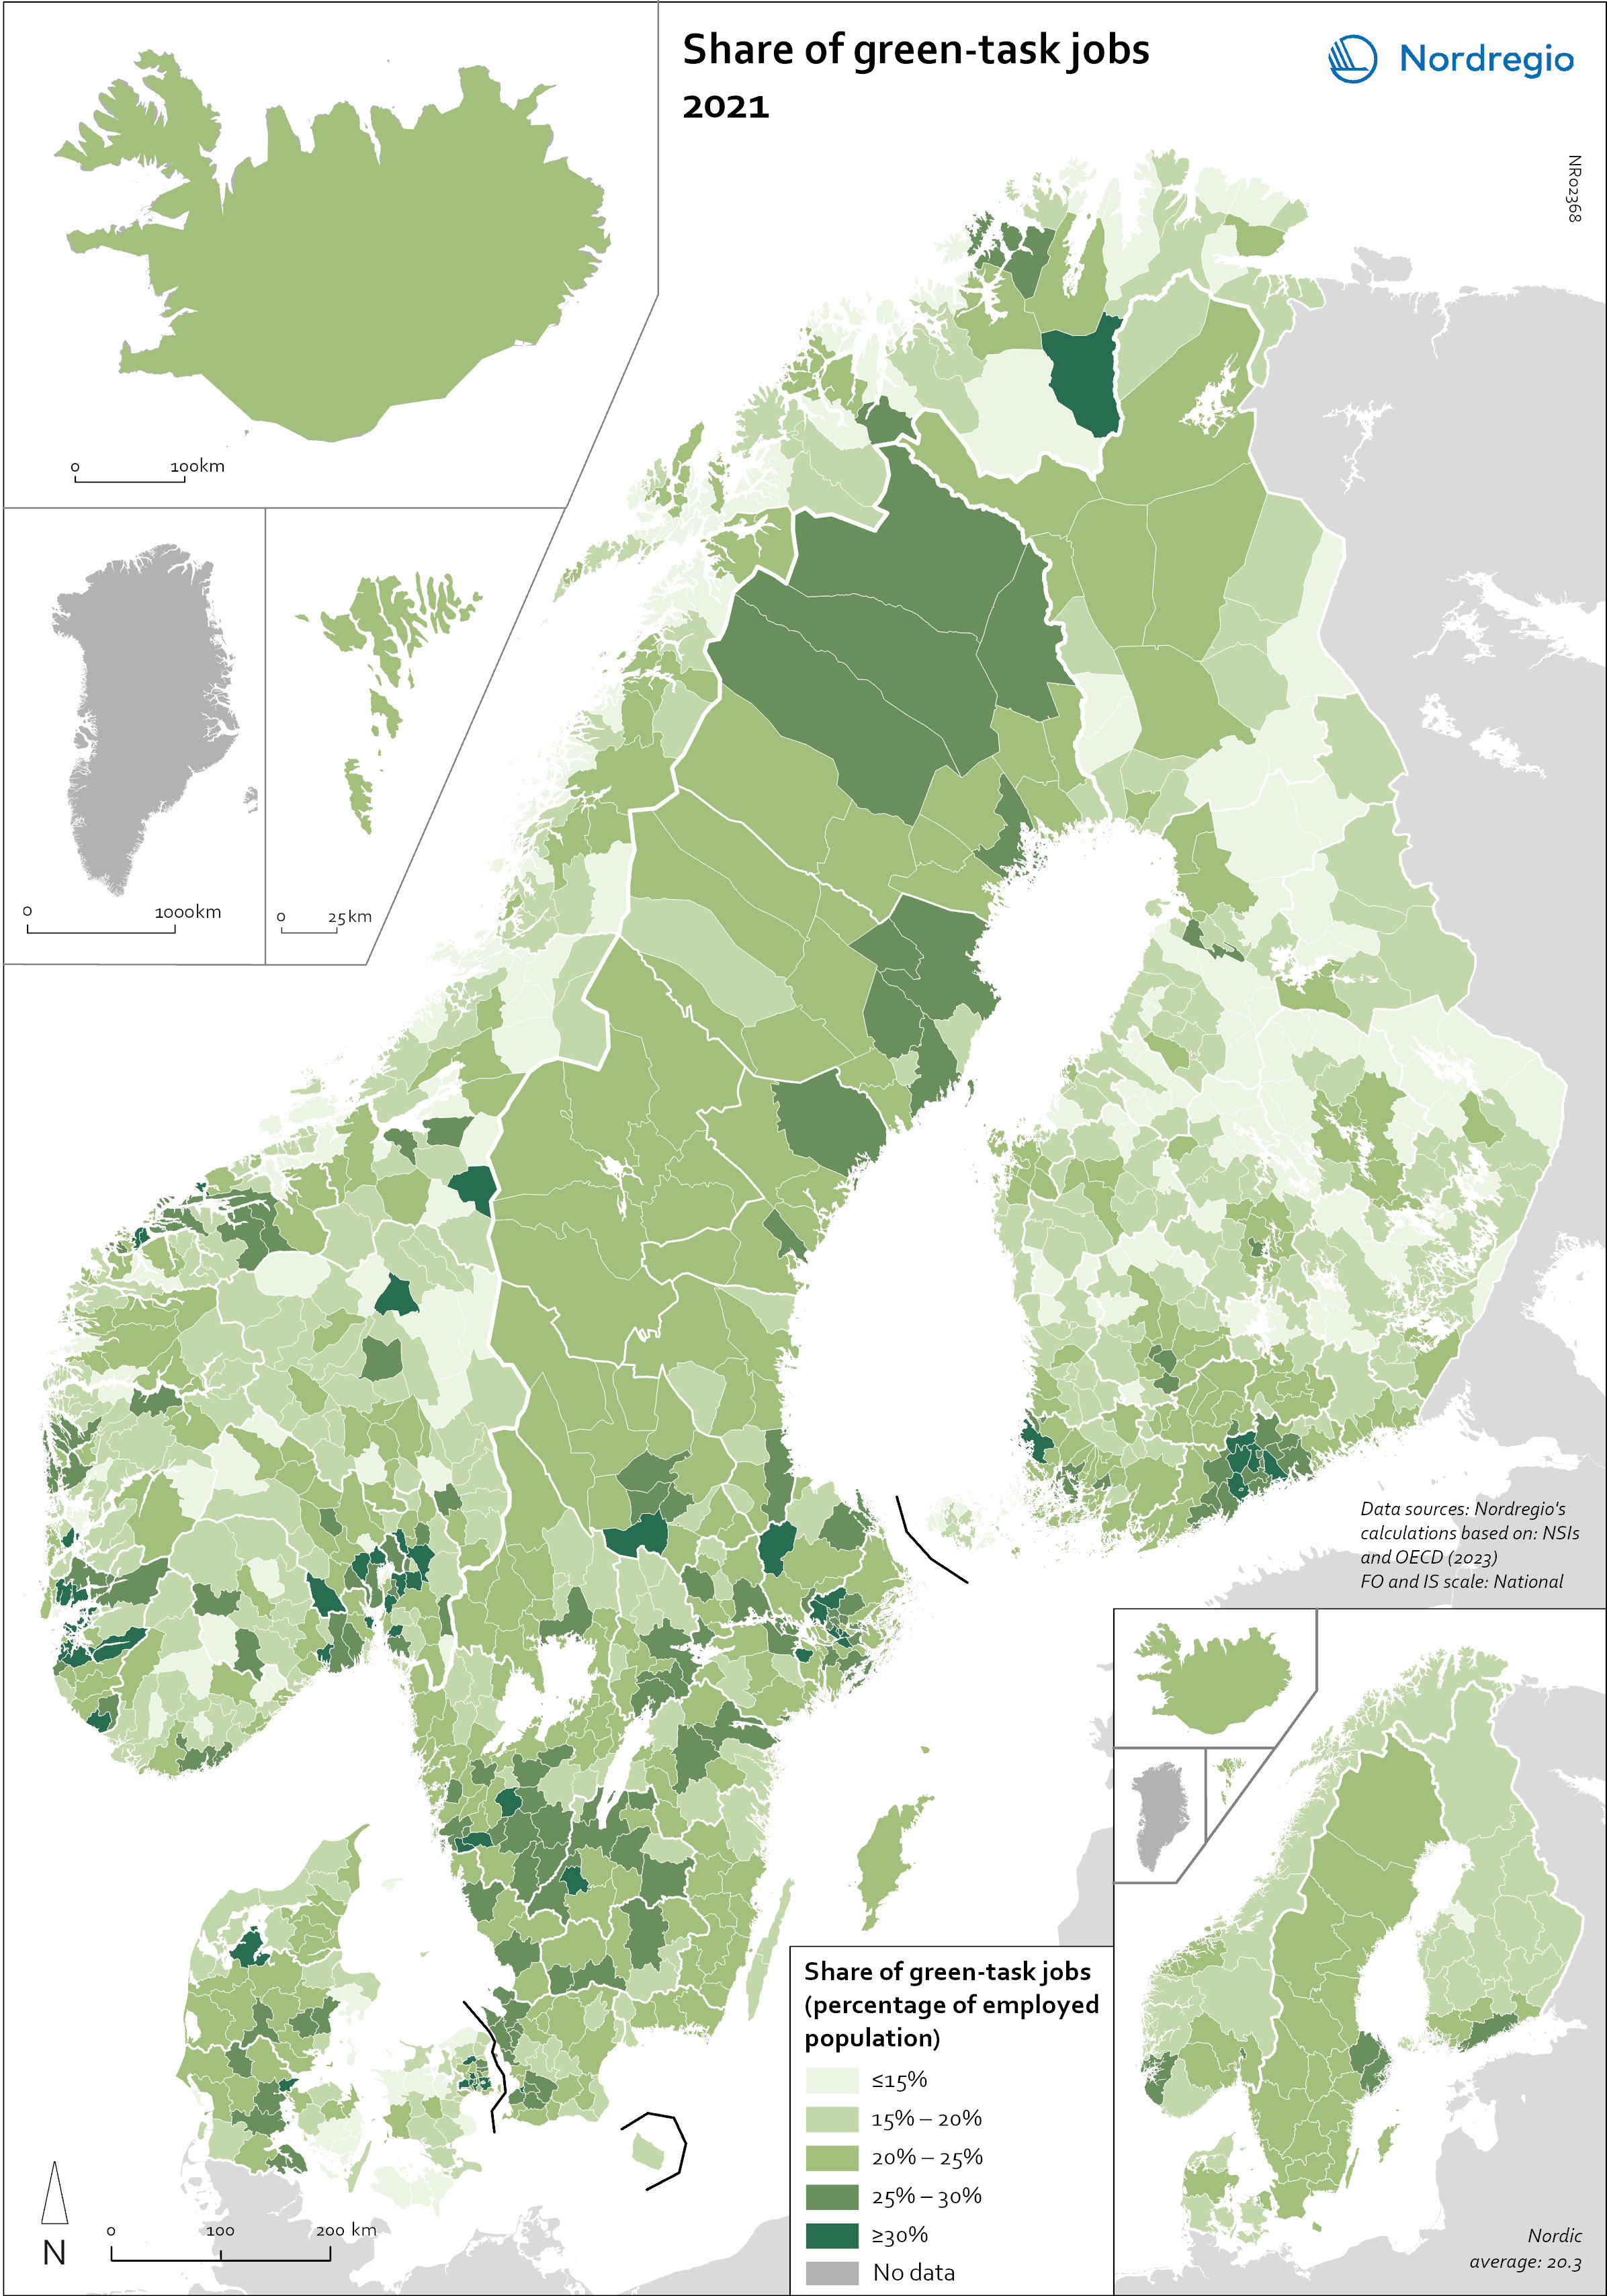
Map 10: Share of jobs involving green tasks (2021).