5. Sectoral employment
Image: Akram Huseyn / unsplash.com
Looking beyond overall labour market performance, changes in the sectoral structure of employment provide insight into how Nordic labour markets are adjusting to economic change.
Figure 11. Labour force composition by sex and industry, 2023.
Note: Due to confidentiality methods used when producing labour and occupational statistics, the number of people in the municipal and/or regional labour force do not always add up to the total labour force, particularly in localities with a low population. For the production of this graph, municipal data were aggregated, which results in some countries’ compontents not adding up to 100%.
Note: Due to confidentiality methods used when producing labour and occupational statistics, the number of people in the municipal and/or regional labour force do not always add up to the total labour force, particularly in localities with a low population. For the production of this graph, municipal data were aggregated, which results in some countries’ compontents not adding up to 100%.
Source: Nordregio calculations based on data from national statistical institutes and Eurostat.
Figure 11 shows labour force composition by sex and industry in the Nordic countries. The graph reveals a strongly gendered pattern across the Nordic labour markets. The clearest gender difference is in public administration, education, health and social work, which together account for over half of women’s employment in the Nordic countries. Men’s employment is more strongly represented in manufacturing, construction and other industrial activities. The contrast with the concentration of women’s employment in public and welfare-related services illustrates that sectoral segregation operates in both directions: women and men remain concentrated in different parts of the economy.
This pattern links back to the productivity and employment growth across industries discussed in the first section of this paper. As industries experience different trajectories of growth, contraction, productivity and churn, existing sectoral segregation means that women and men may be differently exposed to these changes.
Figure 12. Changes in industry shares of employment, 2014–2023 (percentage points).
Source: Nordregio calculations based on data from national statistical institutes and Eurostat.
Source: Nordregio calculations based on data from national statistical institutes and Eurostat.
Figure 12 shows changes in the industry shares of employment between 2014 and 2023. Across the Nordic countries, sectoral employment has followed broadly similar patterns, although the scale of change varies. In line with Figure 2 on employment and productivity growth, employment in agriculture, forestry and fishing has declined across the region, with the largest decrease in Iceland, while manufacturing, wholesale and retail trade and repair of motor vehicles, and transportation and storage have also recorded substantial declines. By contrast, employment in construction, communication and information, and professional, scientific and technical activities has generally expanded across the Nordic countries, pointing to a gradual shift in the sectoral composition of employment. The increase in construction is particularly pronounced in the Faroe Islands. Overall, these common trends suggest that Nordic labour markets are undergoing similar processes of structural change, while differences in the magnitude of sectoral growth and decline reflect varying national and territorial trajectories.
Labour market churn provides a simple measure to capture the pace of this structural change across industries. Sectoral labour market churn is defined as the absolute change in a sector’s share of total employment. Summing the churn across all sectors provides an indicator of the overall extent of employment reallocation between growing and declining industries. Higher churn indicates greater change in the sectoral structure of the national or regional economy (Deming et al., 2024).
Figure 13. Average sectoral labour market churn in Nordic municipalities, 2014–2023 (average absolute change in employment shares across NACE two-digit sectors in Nordic municipalities, aggregated at the NACE one-digit level).
Source: Nordregio calculations based on data from national statistical institutes and Eurostat.
Source: Nordregio calculations based on data from national statistical institutes and Eurostat.
Figure 13 illustrates which sectors have experienced the largest and most spatially widespread labour reallocation in Nordic municipalities in the recent past. In line with the employment trends shown in Figure 2, the largest changes are found in sectors with sizable employment growth such as public administration, education and health and social work. These are followed by construction, wholesale and retail, and agriculture, forestry and fisheries. As welfare-related branches are female-dominated, such prevalent changes suggest that women’s employment is being affected across a broad range of Nordic municipalities. Among male-dominated sectors, construction, which has expanded at the national level, shows a similarly widespread pattern.
By contrast, the ICT sector and professional, scientific and technical activities do not rank as highly in terms of average absolute change in municipal employment shares, despite experiencing a substantial employment increase at the national level (see Figure 2). One possible explanation is that these sectors tend to be more concentrated spatially (Berbert Bruno et al., 2026) meaning that the changes in their employment shares have a pronounced effect in selected municipalities only.
We now turn to how the overall pace of labour reallocation between sectors varies across Nordic municipalities. Map 1 shows substantial spatial variation in labour market churn. Employment structure is changing more rapidly in the northern and peripheral parts of Norway, Sweden and Finland, while slower changes are more common in southern Sweden and Denmark. Finland displays considerable local variation, with high- and low-churn municipalities often located close to one another.
Many municipalities with high churn are small, sparsely populated or relatively specialised economies. In these places, the expansion or contraction of a few industries or major employers can substantially alter the local employment structure. Faster changes in local employment mixes are also observed in several northern resource-based and industrial regions, where investments in mining, energy and manufacturing associated with the green transition have been important drivers of recent economic restructuring. At the same time, other types of regions also experience high churn, suggesting that different processes (such as a broader shift towards services and industrial expansion or decline) may generate similar level of shifts in employment. At the regional level, Kainuu stands out as the region with the highest sectoral labour churn in Finland, reaching levels comparable to those observed in Iceland, the Faroe Islands and Åland. These rapid changes in Kainuu’s sectoral employment structure reflect the combined effects of restructuring, including recent large investments in mining activities, and population decline. Overall, the extent of sectoral employment structure change has been highly uneven spatially in the Nordic Regio. The change has been fastest in many smaller and peripheral labour markets, reflecting both sectoral growth and decline. Importantly, the churn measure alone does not reveal whether restructuring is driven by employment growth or decline.
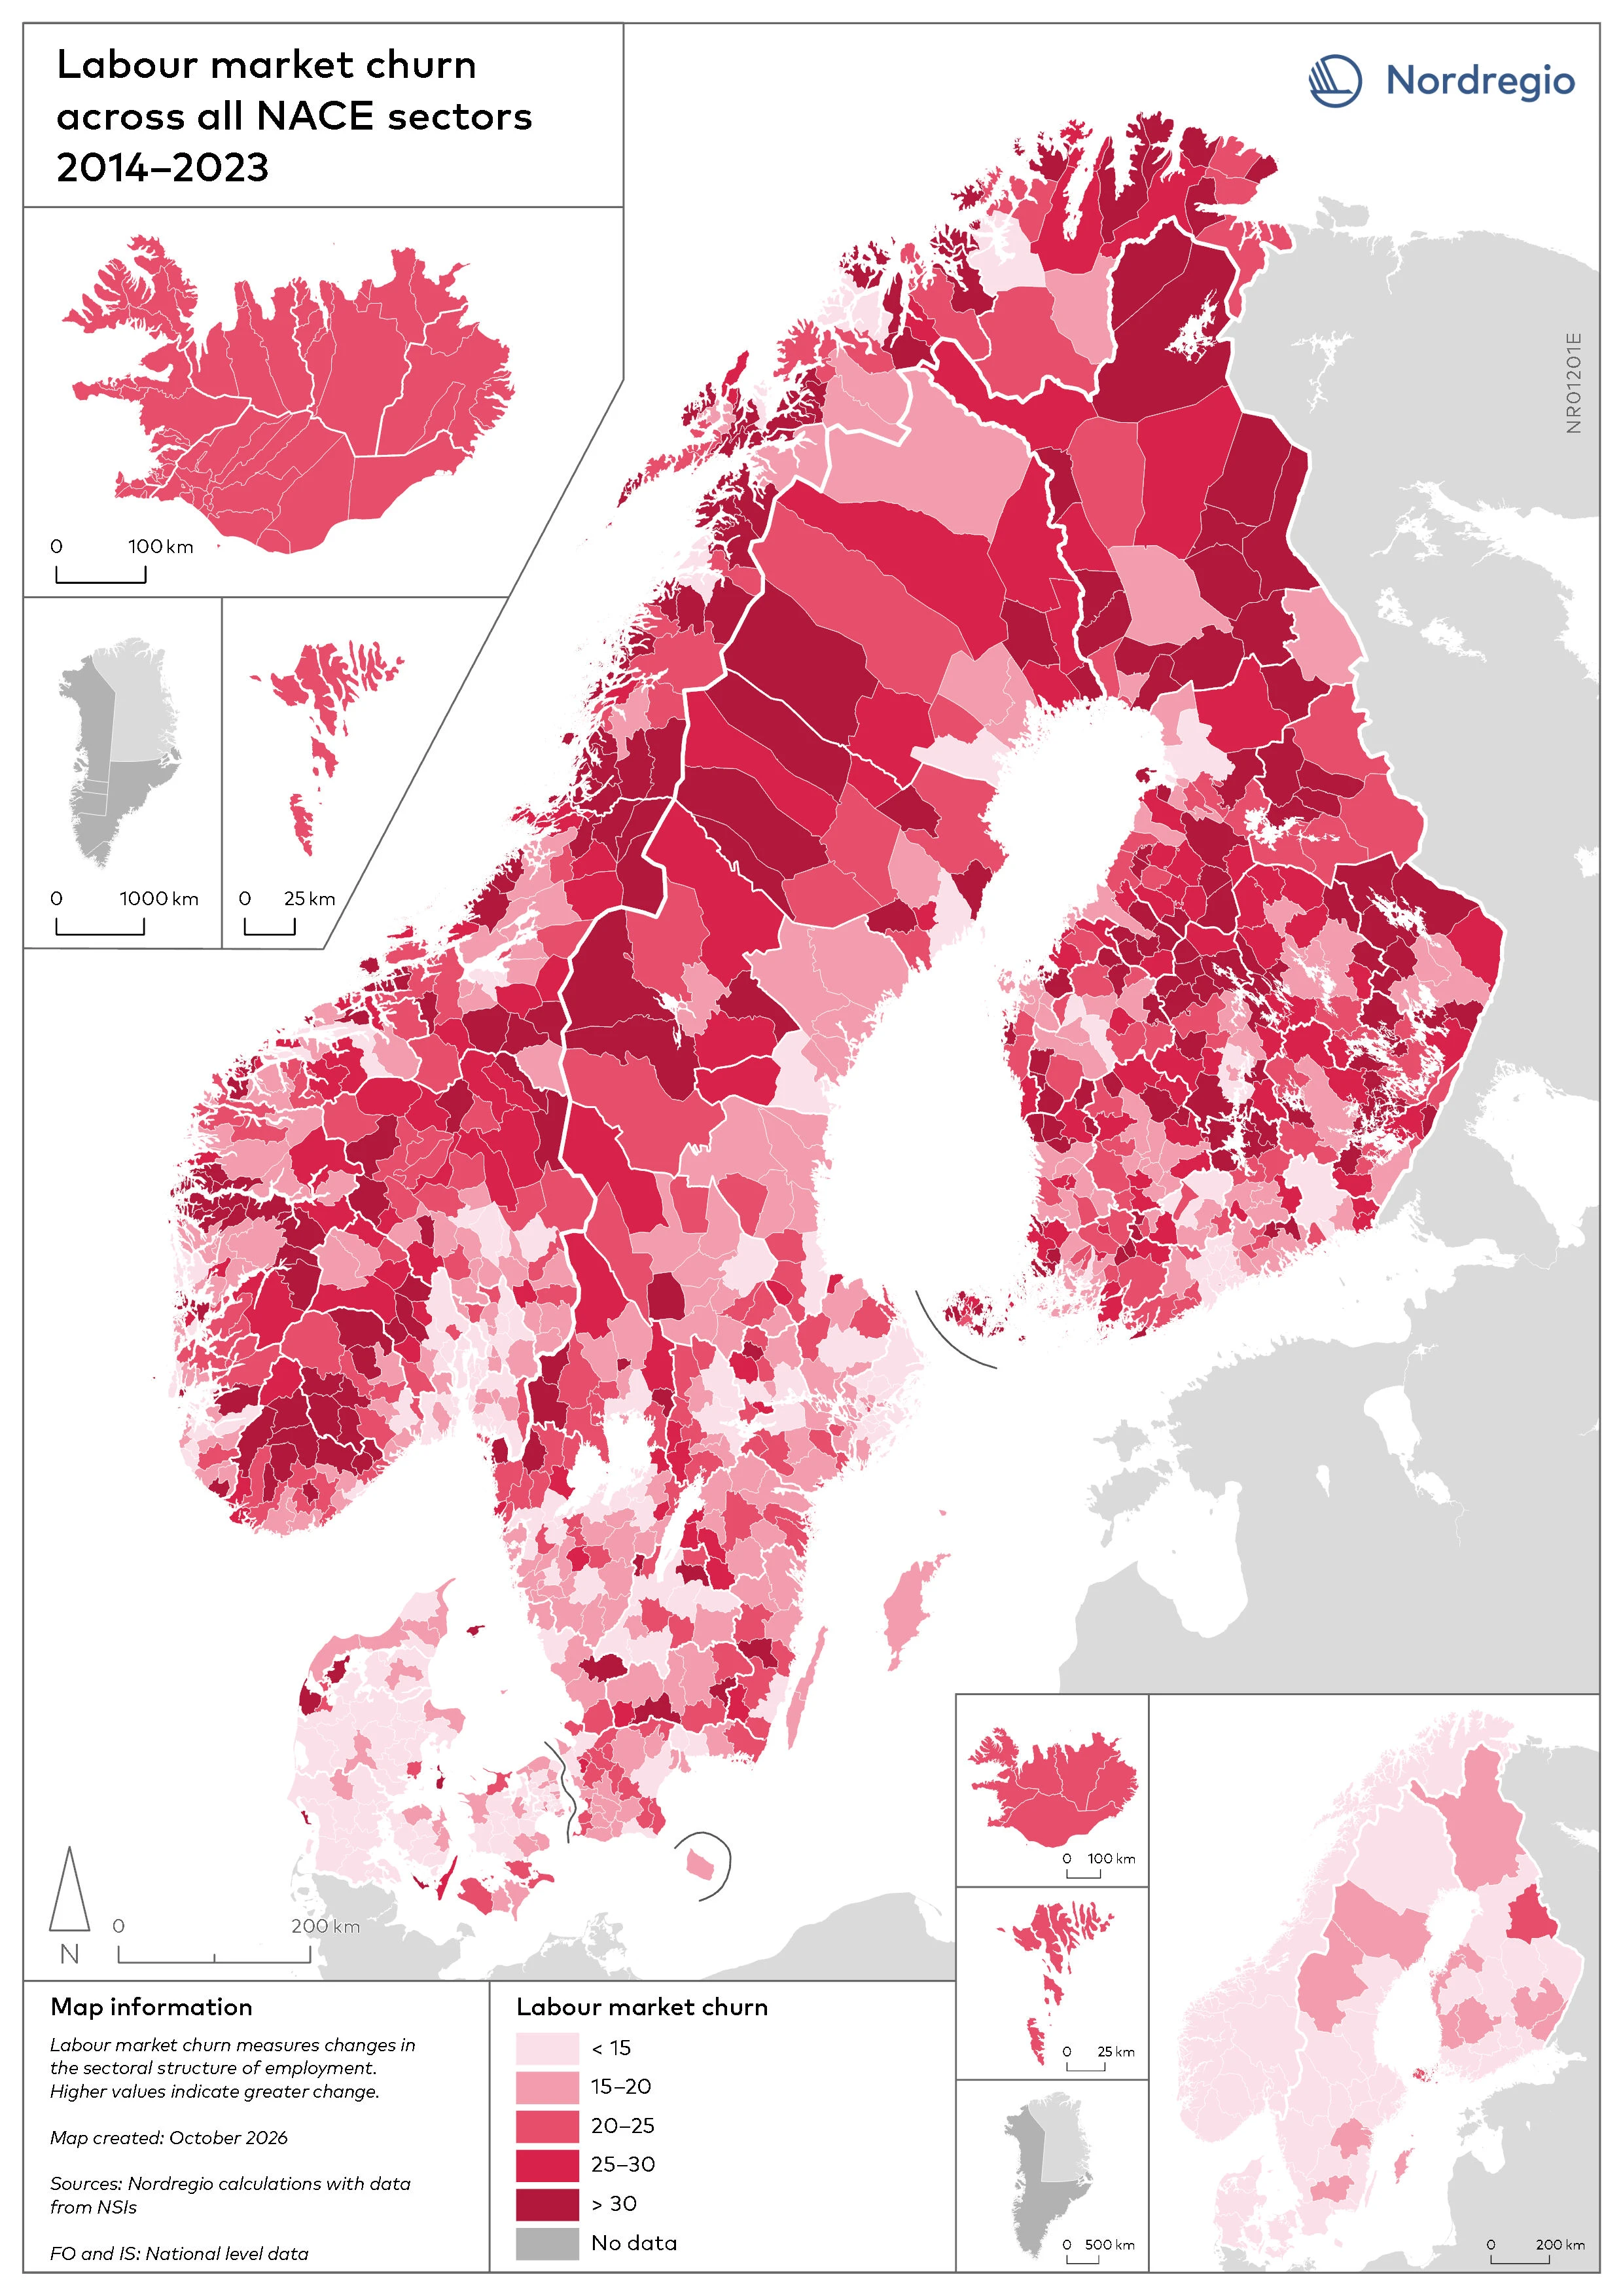
Map 1. Municipal labour market churn across all sectors, 2014–2023.
Note: Churn is calculated as the sum of absolute change in employment shares of all sectors (NACE two-digit level) between 2014 and 2023. Higher churn indicates greater change in the sectoral structure of the local economy.
Source: Nordregio calculations based on data from national statistical institutes. Data for the Faroe Islands and Iceland are at the national level. No data are available for Greenland.
Note: Churn is calculated as the sum of absolute change in employment shares of all sectors (NACE two-digit level) between 2014 and 2023. Higher churn indicates greater change in the sectoral structure of the local economy.
Source: Nordregio calculations based on data from national statistical institutes. Data for the Faroe Islands and Iceland are at the national level. No data are available for Greenland.