4. Can we identify geographies of discontent in the Nordic Region?
Similar to other European countries, the Nordic countries have experienced changes in electoral behaviour over the past decades (Martinez-Toledano and Sodano 2021). In this section, we describe trends in voter turnout and support for populist parties in the Nordic countries, highlighting spatial variations within each country. We distinguish between urban, intermediate and rural municipalities based on a Nordic rural-urban typology developed by Nordregio (see Box 1 and Annex 1 for more detailed information).
Box 1: Nordregio’s rural-urban typology
The urban-rural territorial typology is a new system for classifying Nordic territories into seven distinct categories: inner urban areas, outer urban areas, peri-urban areas, local centres in rural areas, rural areas close to urban areas, rural heartland areas, and sparsely populated rural areas. These categories are based on different degrees of urbanity and rurality. The typology is based on a 1 x 1 km grid system that enables the classification of different types of areas at a detailed territorial level.
Nordregio and Ubigu developed this typology as a new analytical framework to combine different types of data and facilitate a more nuanced understanding of territorial differences across the Nordic countries. The typology includes Denmark, Finland, Iceland, Norway, Sweden and Åland. Due to data limitations, it was not possible to include Greenland and the Faroe Islands.
A recent report by Stjernberg et al. (2024) presents the Nordic typology, along with analyses of territorial and settlement patterns. The typology has also been published online as an interactive digital web-mapping platform, which allows users to zoom in on different areas.
For this policy brief, we use an aggregated version of the typology which groups the seven types of areas into three categories:
- Urban municipalities: Includes municipalities classified as inner urban and outer urban areas.
- Intermediate municipalities: Includes municipalities classified as peri-urban areas, rural areas close to urban areas and some local centres in rural areas.
- Rural municipalities: Includes municipalities classified as rural heartland areas, sparsely populated rural areas and some local centres in rural areas.
Annex 1 provides more information.
In line with Hirschman’s ‘Exit-Voice-Loyalty’ model and its later extensions (see section 2), low voter turnout can be considered as a sign of alienation or indifference towards democratic processes and, therefore, an indicator for discontent (Eyþórsson and Önnudóttir 2017). When considering Europe as a whole, voter turnout has declined since the mid-1980s (Solijonov 2016), but as Figure 1 shows, trends have varied across the Nordic Region.
In Denmark, Norway and Sweden, turnout in national-level elections has fluctuated over time and does not display a clear downward trend. In Finland, turnout reached a high point of 85% during the national-level elections of 1962 and 1966, subsequently declining to 65% in 1999. Since then, turnout has stabilized between 65% and 69%. Iceland and Greenland are the only countries where a clearer recent downward trend in turnout can be observed. In Iceland, turnout has successively declined from a level of around 90% in the mid-1980s to 80% in the most recent elections. In Greenland, turnout declined from around 75% in the 1980s and mid-1990s to 66% in the elections of 2021. In the most recent elections shown in Figure 1, the highest voter turnouts were in the Faroe Islands (89.4%), Sweden (84.2%), Denmark (84.2%) and Iceland (80.1%). Lower participation rates were found in Norway (77.2%), Finland (68.5%), and Greenland (65.9%).
The voter turnout trends shown in Figure 1 hide significant spatial differences within the Nordic countries. This perspective is added in Figure 2, which shows voter turnout in recent national-level elections in each municipality as a percentage point relative to the national average, highlighting differences in participation levels across the Nordic Region. This method removes inter-country differences in participation levels, providing a clearer view of spatial differences. Areas shaded in blue indicate regions where voter turnout exceeded the national average, while red areas represent regions where turnout was below average.
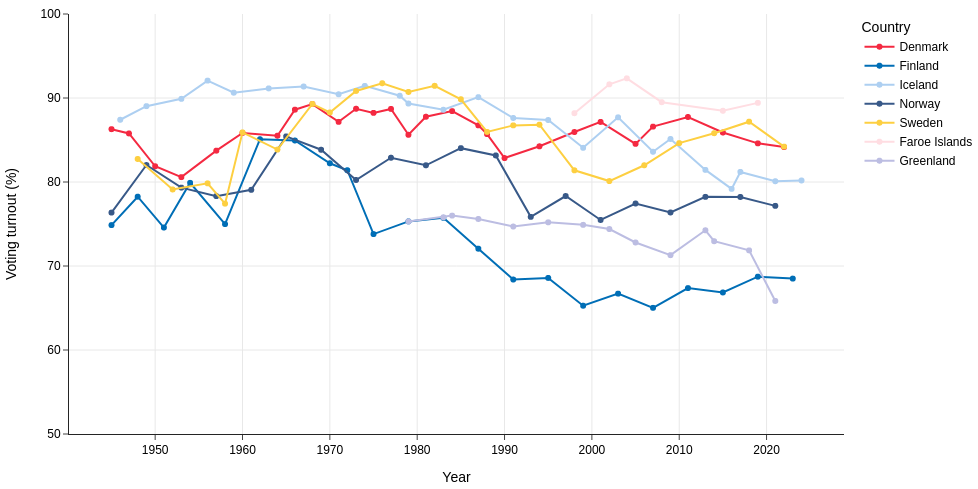
Figure 1: Turnout in national-level elections (1945-2024)
Source: IDEA (n.d.)
Source: IDEA (n.d.)
The map in Figure 2 reveals that urban areas and municipalities near major cities generally showed higher turnout, as seen in the metropolitan areas of Finland and Norway, where turnout generally surpassed the national average. In contrast, rural and sparsely populated areas, particularly in northern Norway, Sweden and Finland, displayed lower voter engagement. Nonetheless, exceptions exist. The inner urban areas of Stockholm and Malmö, as well as some municipalities close to the capital cities, such as Botkyrka (Stockholm) in Sweden and Vantaa (Helsinki) in Finland, had low turnout. Conversely, several rural areas showed higher-than-average turnout. For example, many rural municipalities in southwestern Norway and Ostrobothnia in Finland had among the highest turnout rates in their country. Denmark, Greenland and Iceland exhibit mixed patterns, with some rural areas demonstrating strong voter engagement while others fall below average.
Statistical analyses
The results of the statistical analysis are not shown here but available upon request.
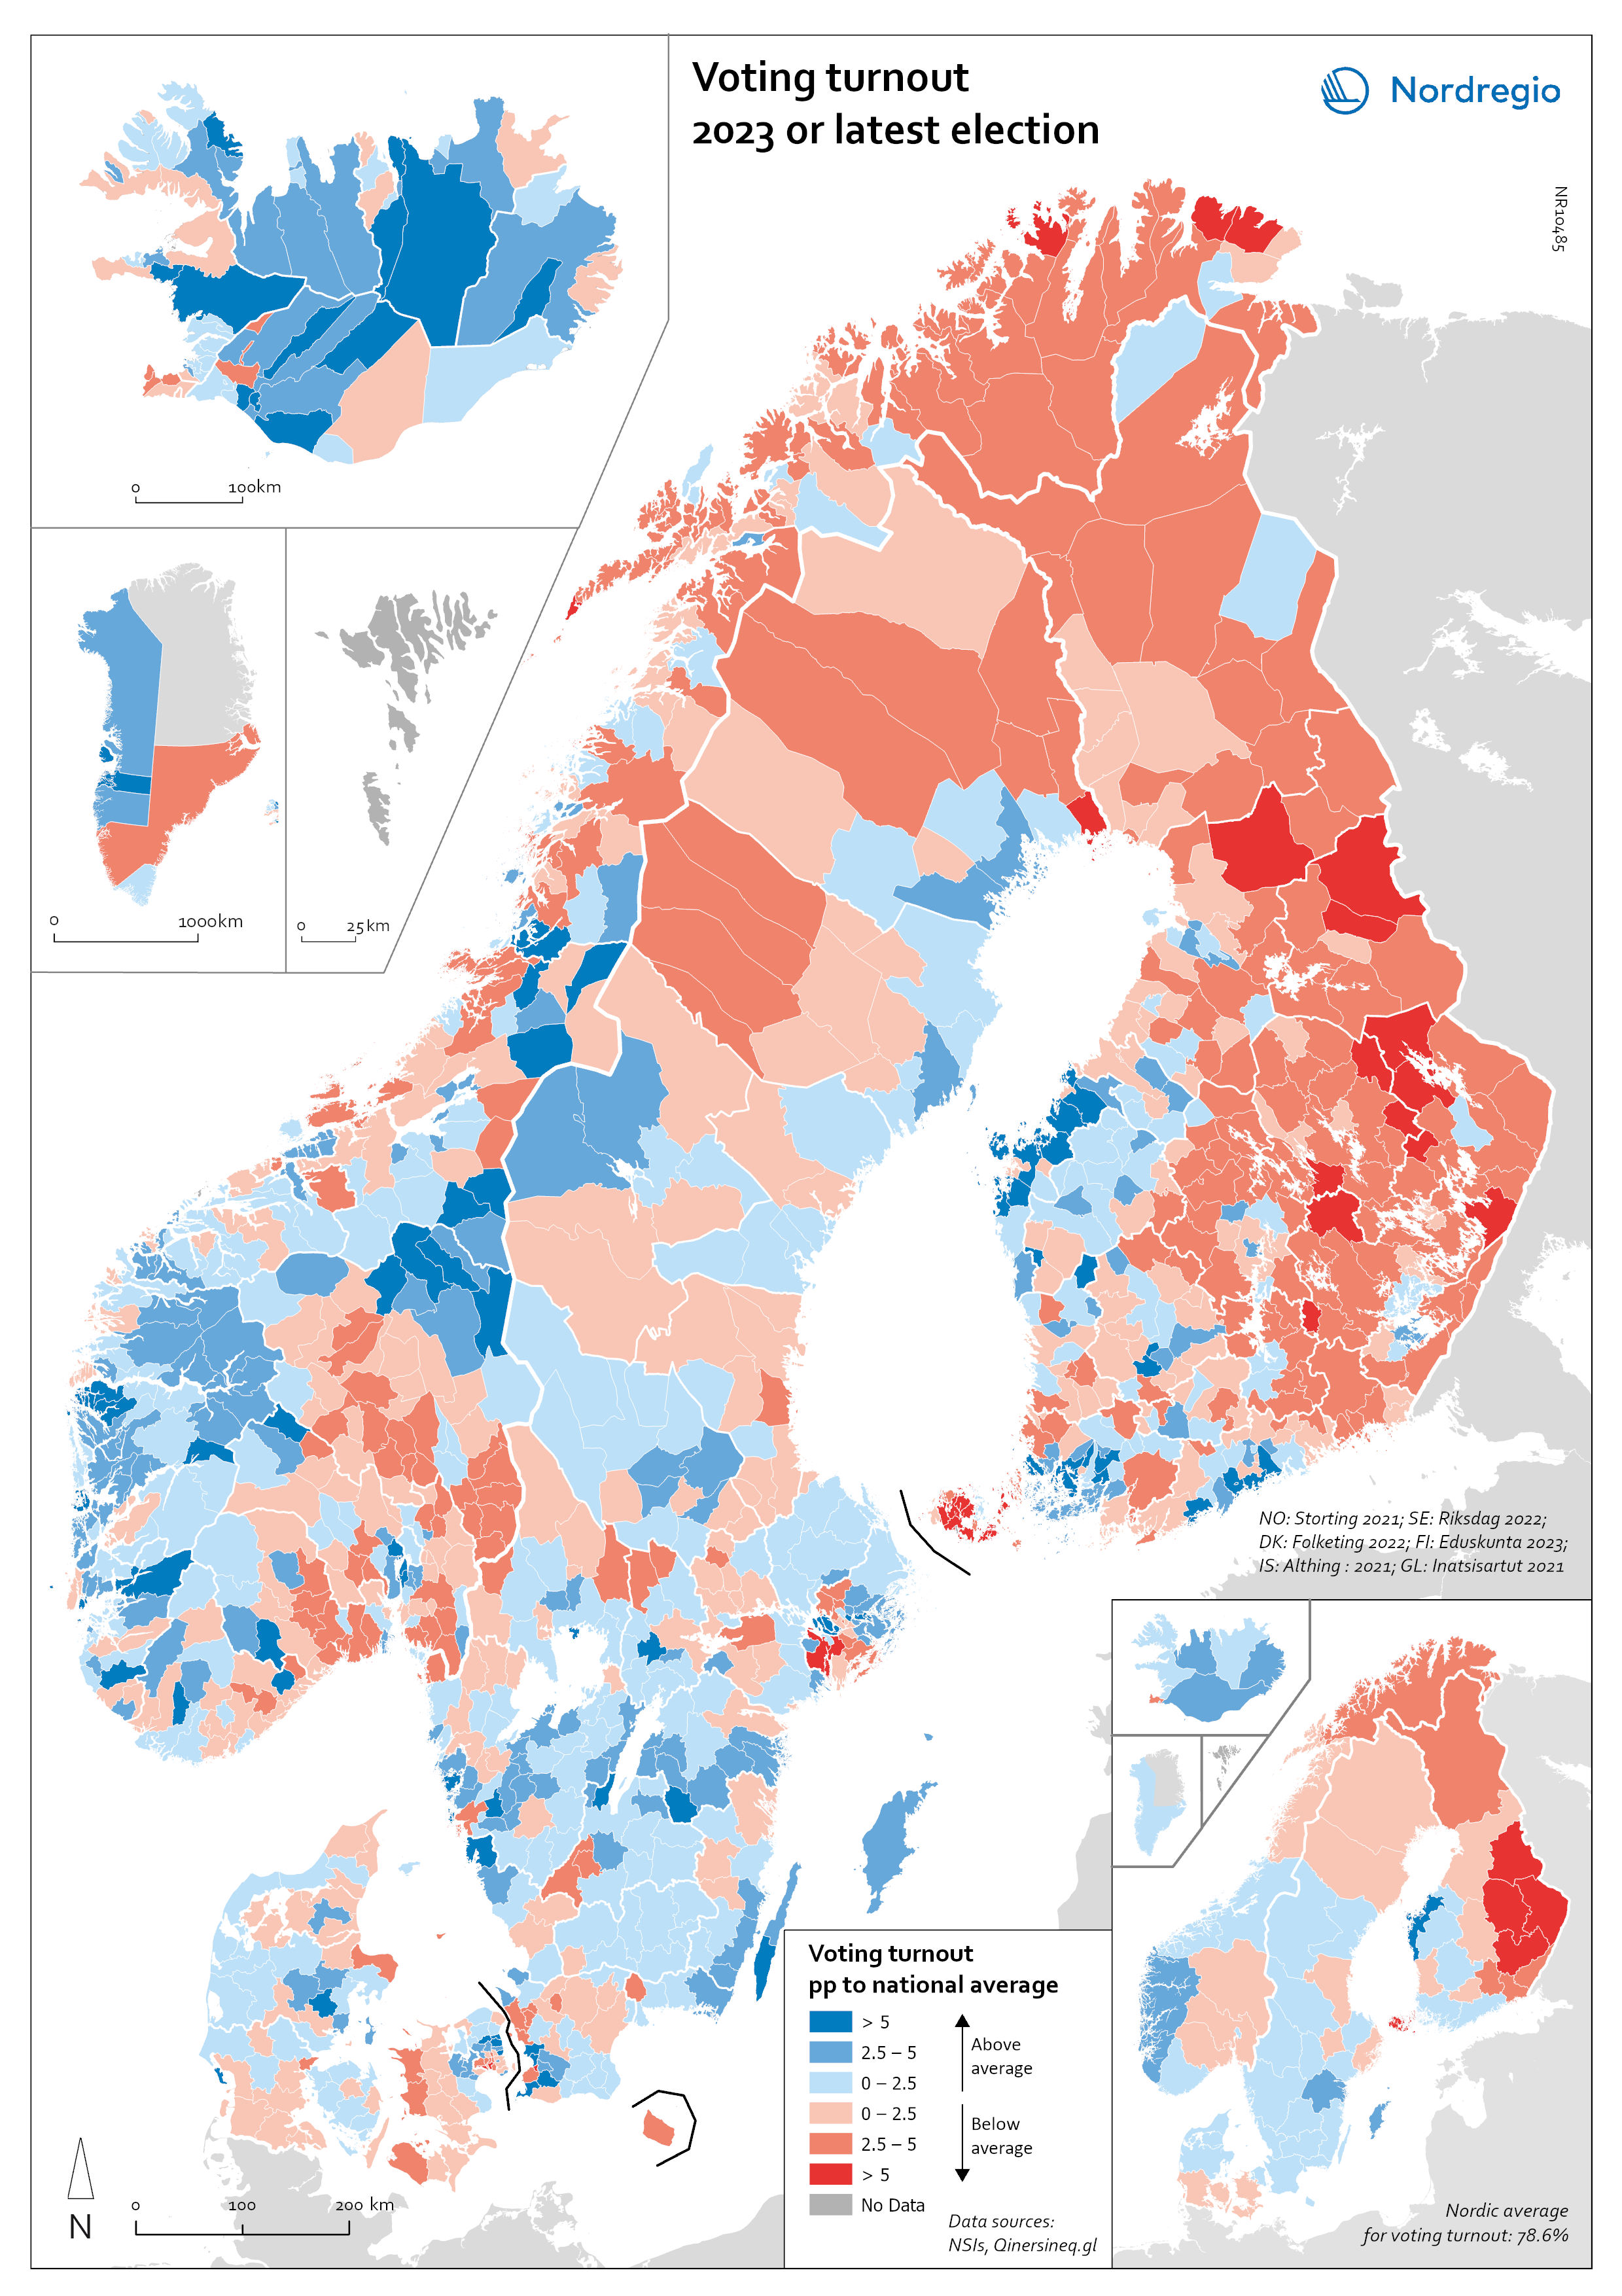
Figure 2: Turnout in national level elections (2023 or latest election prior to this year)
Note: The map compares turnout in national elections in each municipality to the nation-wide average. Municipalities highlighted in blue are those with higher-than-average turnout; municipalities in red have lower-than-average turnout rates. The map shows turnout in the following elections: Stortinget 2021 (Norway), Riksdagen 2022 (Sweden), Folketinget 2022 (Denmark), Eduskunta 2023 (Finland), Althing 2021 (Iceland) and Inatsisartut 2021 (Greenland).
Note: The map compares turnout in national elections in each municipality to the nation-wide average. Municipalities highlighted in blue are those with higher-than-average turnout; municipalities in red have lower-than-average turnout rates. The map shows turnout in the following elections: Stortinget 2021 (Norway), Riksdagen 2022 (Sweden), Folketinget 2022 (Denmark), Eduskunta 2023 (Finland), Althing 2021 (Iceland) and Inatsisartut 2021 (Greenland).
Next, we can consider votes cast for populist parties. To identify such parties in the Nordic Region, we rely on a classification provided by the PopuList project (Rooduijn et al. 2024). This project offers a list of European parties that can be categorized as populist, far-left, and/or far-right. It has been peer-reviewed by approximately 100 academics and has been used in over 600 academic publications (Rooduijn et al. 2023). According to the PopuList project, the following Nordic parties can be considered populist: the Danish Peoples Party and the New Right in Denmark, the Movement Now and the Finns Party in Finland, the Progress Party, the Red Party and Coastal Party in Norway, and the Sweden Democrats in Sweden. In Iceland, the Centre Party, the People’s Party, the Civic Movement and Icelandic Socialist Party are classified as populist. However, since different indicators and data for statistical analyses were not available for Iceland (see section 6), this country was not included in further analyses in our project.
Figure 3 shows the percentage of votes that populist parties have obtained in national-level elections in the Nordic countries over the last 15 years.
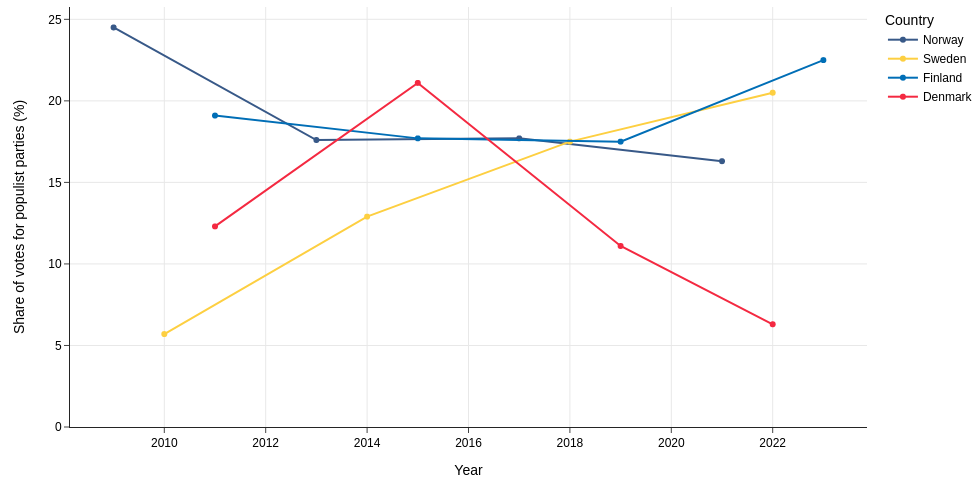
Figure 3: Share of votes cast for populist parties in Nordic national-level elections (2009-2023)
Source: Statistics Sweden [ME0104B6], SSB, [08092], Statistics Denmark [FVPANDEL], Statistics Finland [13sw].
Source: Statistics Sweden [ME0104B6], SSB, [08092], Statistics Denmark [FVPANDEL], Statistics Finland [13sw].
Note: The following Nordic parties are considered populist, based on the PopuList project (Rooduijn et al. 2023): the Danish Peoples Party and the New Right in Denmark, the Movement Now and the Finns Party in Finland, the Progress Party, the Red Party and Coastal Party in Norway, and the Sweden Democrats in Sweden.
In Finland, the 2011 election saw the breakthrough of the Finns Party, when it achieved 19.1% of the votes. Similar election results were achieved in 2015 when the party joined the coalition government under Prime Minister Juha Sipilä. The party achieved around 18% of the votes during elections in 2017 and 2019 and then reached their strongest result in the parliamentary elections of 2023 with around 20% of the votes, making it the second strongest party. The Movement Now party achieved around 2.3% of the votes during parliamentary elections in 2019 and 2023. (Salo 2022)
In Norway, the Progress Party achieved its best election result in 2009, winning close to 23% of the votes in the national parliamentary elections. In 2013, the Social Democrats, who had held power for eight years, lost the parliamentary elections to a centre-right coalition. The Progress Party entered government for the first time as part of the coalition, marking a turning point in the party’s electoral success (Bjerkem 2016). During the latest elections in 2021, the Progress party obtained close to 12% of the votes, less than the 15% it had obtained in 2017. The Red party and the Coastal Party, also classified as populist by the PopuList project, are smaller parties that achieved less than 5% of the votes in the most recent elections.
In Sweden, the 2010 election is often viewed as a turning point, as the Sweden Democrats entered parliament for the first time with 5.7% of the votes. The 2014 election saw them double their share of the vote to 13%, which meant that none of the traditional political blocs was able to form a majority. In the 2022 election, they reached 20.5% (Jylhä et al. 2019). Finally, election behaviour has proven slightly more complex in Denmark. The Danish People's Party garnered 21% of the vote in 2015, with most of its support coming from rural areas. By the 2019 elections, however, the party’s agenda had been partly adopted by other parties, and the People’s Party lost support. The New Right is a smaller party that achieved less than 4% of the votes during the most recent national-level elections (Sørensen and Svendsen 2023).
Overall, in the four Nordic countries, only Sweden saw a consistent increase in the share of votes cast for populist parties during the 15-year period considered here. In Finland, a noticeable increase in the populist vote share was only evident in the most recent election. In Norway and Denmark, the populist vote share has declined in recent elections, in the case of Denmark after a high in the national elections of 2015. These national-level trends again mask considerable diversity in voting behaviour at the local level.
Figure 4 shows the percentage of votes cast for populist parties in recent national-level elections, compared to the national average. At the regional level, above-average support for populist parties is prevalent in most parts of Sweden and Finland, except for areas such as Österbotten in Finland and Gotland, Stockholm, and Västerbotten in Sweden, where support falls below national averages. Southern Sweden, especially Skåne and Blekinge, shows strong backing for populist parties. In Finland, urban regions like Uusimaa demonstrate lower populist support compared to Satakunta and Etelä-Pohjanmaa. Denmark displays a more balanced distribution, with stronger populist support in southern regions like Syddanmark and lower support in urbanized areas around Copenhagen and Aarhus. In Norway, rural and coastal regions such as Møre og Romsdal and Nordland show stronger populist support, while urban centers like Oslo and Vestland exhibit below-average backing.
Statistical analyses
The results of the statistical analysis are not shown here but available upon request.
In both cases, whether considering voter turnout or votes cast for populist parties, people living in urban areas appear to show the lowest levels of public discontent as expressed through electoral behaviour.
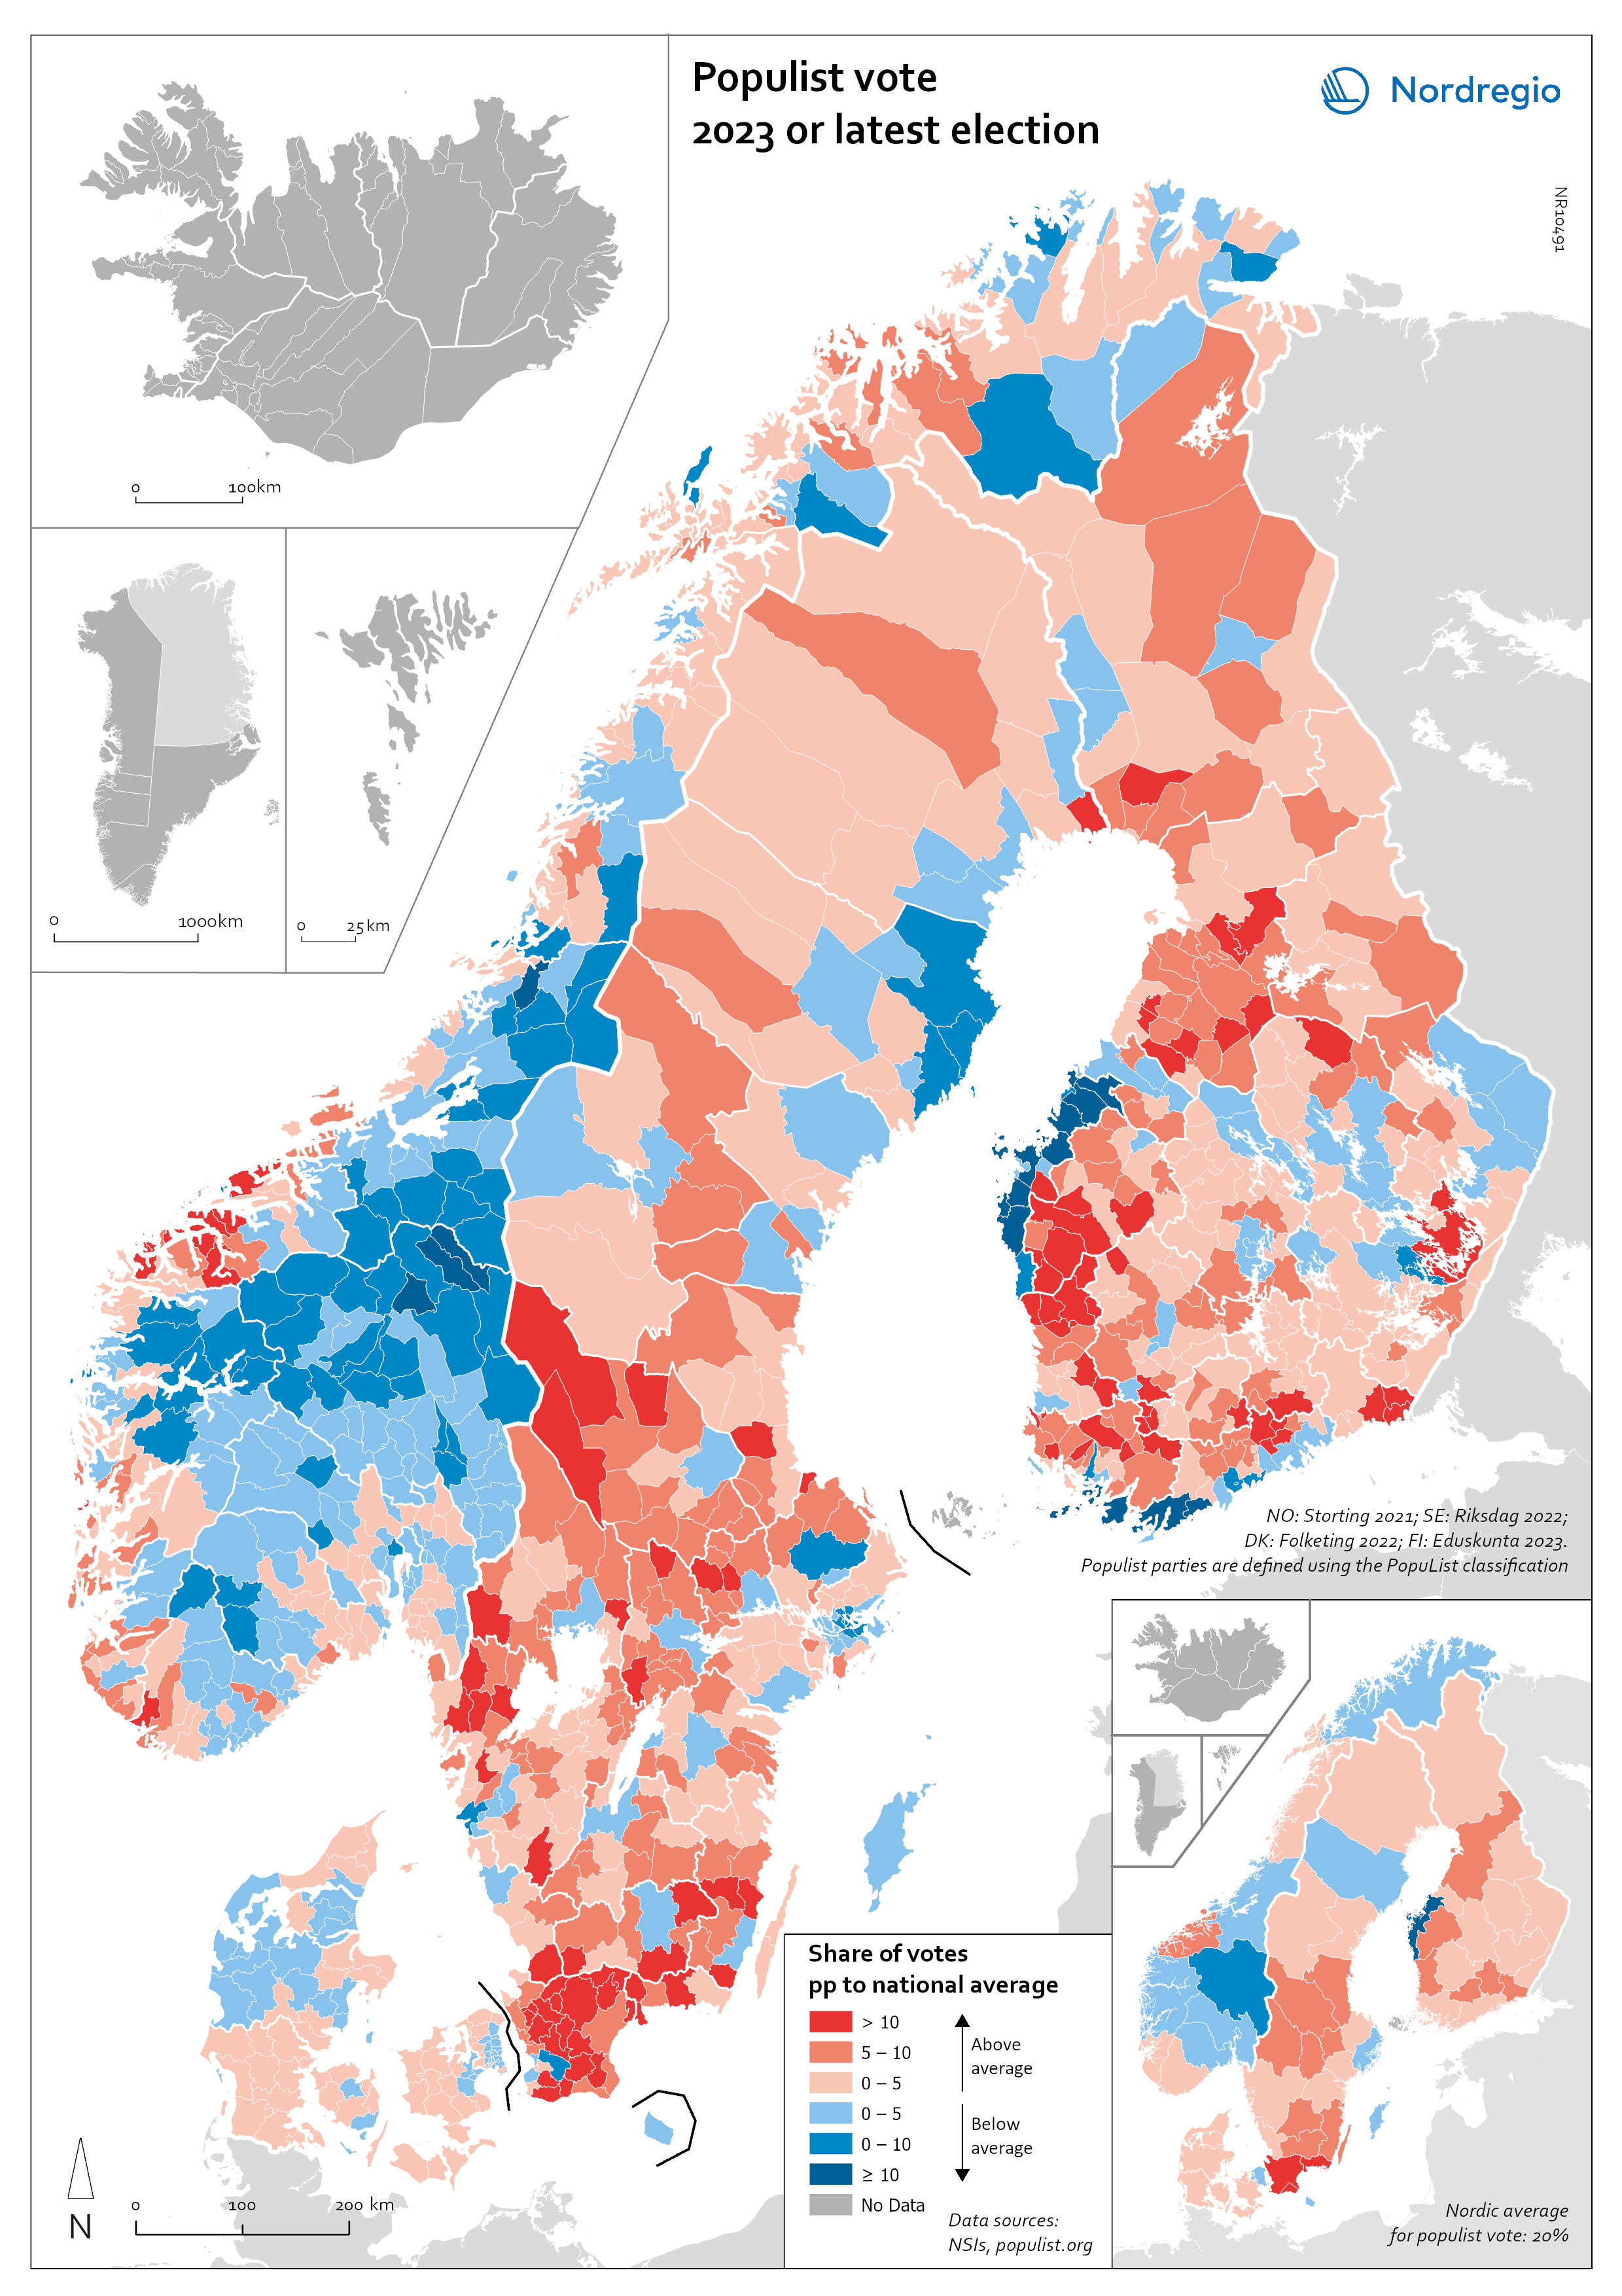
Figure 4: Votes for populist parties in national level elections (2023 or latest election before this year)
Note: The map compares the share of votes cast for populist parties in national elections in each municipality to the nation-wide average. Municipalities highlighted in blue are those have below-average votes for populist parties; municipalities in red are above average. Based on the PopuList project, the following parties are classified as populist: The Danish Peoples Party and the New Right (Denmark), Movement Now and the Finns Party (Finland), Progress Party, Red Party and Coastal Party (Norway) and the Sweden Democrats (Sweden). pp in the map legend stands for percentage points.
Note: The map compares the share of votes cast for populist parties in national elections in each municipality to the nation-wide average. Municipalities highlighted in blue are those have below-average votes for populist parties; municipalities in red are above average. Based on the PopuList project, the following parties are classified as populist: The Danish Peoples Party and the New Right (Denmark), Movement Now and the Finns Party (Finland), Progress Party, Red Party and Coastal Party (Norway) and the Sweden Democrats (Sweden). pp in the map legend stands for percentage points.
Related project publication:
Chilvers, M., Sánchez Gassen, N., Lundgren, A. and Tapia C. (2024): Geographies of discontent in the Nordic Region? A conceptual overview. Nordregio Working Paper 2024:1, Stockholm: Nordregio. Available at: https://norden.diva-portal.org/smash/get/diva2:1862660/FULLTEXT01.pdf