Photo: Nuno Marques, unsplash.com
2. Long-term strategies for reducing greenhouse gas emissions
While not all Nordic countries are members of the European Union (EU), all of them are committed to EU climate policies and targets. This chapter describes the key climate goals and policy instruments at the EU level and their implications for climate policy-making at the national level in the Nordic countries. The chapter continues with a description of current climate goals in the Nordic countries and illustrates the success of those policies in curbing Nordic greenhouse gas emissions and greening the energy mixes of the Nordic countries.
2.1. The EU climate and energy policy framework
EU-wide climate targets and policy objectives for the period from 2021 to 2030 are defined in the 2030 Climate and Energy Framework that was introduced by the European Council on 23/24 October 2014 (EU Council 2014). Under this framework, the EU as a whole is committed to:
- cutting territorial greenhouse gas emissions by at least 40% by 2030 and by 80-95% by 2050 (compared to 1990 levels).
- achieving at least 27% renewable energy as a share of EU-wide gross final energy consumption.
- attaining an improvement in energy efficiency of at least 27%.
In December 2018, the EU made the latter two targets more ambitious. The amended Renewable Energy Directive ((EU) 2018/2001) established a new binding renewable energy target for the EU for 2030 of at least 32%. The amended Energy Efficiency Directive ((EU) 2018/2002) defined a headline EU energy efficiency target for 2030 of at least 32.5%, compared to projections of the expected energy use in 2030. Both targets were set to be revised upwards in a revision planned for 2023 (EU 2018a, 2022).
In December 2019, the newly elected European Commission proposed to increase the ambition level and presented a set of policy proposals, commonly referred to as the ‘European Green Deal’. It defined the goal of making the EU climate-neutral by 2050 and argued for the need to tighten the intermediate targets for 2030. In line with the European Green Deal, in December 2020 the European Council endorsed a target of a net domestic reduction in emissions of at least 55% by 2030, as compared to 1990. A new European Climate Law (Regulation (EU) 2021/1119) was adopted and published in the Official Journal of the European Union in July 2021. It established the legally binding target for the EU institutions and member states of reducing emissions by 55% by 2030 and the goal of achieving climate neutrality in 2050 (EU 2021).
In 2021, the European Commission adopted a series of legislative proposals called the ‘Fit for 55’ legislative package (EC 2021a). It aims to set Europe on a realistic path to becoming climate-neutral by 2050, including the following proposals for the period until 2030:
- Attaining the EU greenhouse gas emission reduction target of 55% compared to 1990 levels.
- Increasing the share of renewable energy in the Union’s gross final energy consumption to 40%.
- Increasing the target for improvement in energy efficiency to 36% for final energy consumption and 39% for primary energy consumption.
The war in Ukraine prompted European actors to increase ambition levels still further. In May 2022, the European Commission launched the REPowerEU plan. Its goals are to save energy, diversify sources, and speed up the transition to a fully renewable energy system. Among other targets, the REPowerEU plan aims to raise the EU-wide renewable energy production target for 2030 even further from 40% to 45% of gross final energy consumption (EC 2022a).
The Fit for 55 package and its policy components are currently in the final stages of negotiation between the European Council and the European Parliament. Trilogues got underway in July 2022 and concluded with a provisional political agreement on 18 December 2022. The first parts of the Fit for 55 package were formally adopted in March 2023 (European Council 2023a, European Parliament 2023).
Overall, the EU and its member states have tightened the targets for curbing greenhouse gas emissions and the overall ambition level for EU climate policies by adopting the European Climate Law and the most recent policy packages. Due to the legally binding character of the 2030 and 2050 targets that were enshrined in the European Climate Law, the EU institutions and member states are bound to take necessary action. That includes the Nordic countries. Norway and Iceland are not member states of the EU but have aligned their national climate goals to the EU, meaning that their national climate policies will contribute to achieving EU climate targets too.
2.2. The structure of EU climate policy
European climate policies are implemented through three key instruments, namely the EU Emissions Trading System (ETS), the Effort Sharing Regulation (ESR), and the Land Use, Land Use Change and Forestry (LULUCF) Regulation.
2.2.1. The EU Emissions Trading System
The EU Emissions Trading System (EU ETS) is the world’s first and largest carbon market, on which emission rights are traded across international borders (EC 2022b). The ETS is a market-based scheme designed to make large industrial facilities pay for the greenhouse gases emitted by their installations. Currently, the EU ETS covers power plants, large industrial factories, and CO2 emissions from aviation within the European Economic Area (EEA). It represents roughly 40% of all CO2 emissions within the EU and the EEA.
The EU ETS is regulated under Directive 2003/87/EC and operates in all EU member states, as well as Iceland, Liechtenstein, and Norway. The EU ETS operates as a cap-and-trade system. That means that installations under the EU ETS are subject to a Community-wide emissions limit that decreases over time (a cap), and that economic actors can buy or receive emissions allowances, which can also be traded on the market (a trade). The limit on the total number of available allowances ensures that they have a value. After each year, a given installation must surrender enough allowances to cover each ton of CO2 that is actually emitted, otherwise sanctions are imposed (EC 2022b). In practice, if an installation reduces its emissions, it can keep the spare allowances to cover its future needs or else sell them to another installation that is short of allowances.
The EU ETS has been deployed in various phases (Figure 1). The first two phases (2005-2008 and 2008-2013) were marked by a large number of free allowances and demand-and-supply mismatches. That caused permit prices to remain at low levels deemed inconsistent with the EU’s long-term vision for a climate-neutral economy by 2050 (Carlén and Kriström 2020). The two more recent phases (2013-2021 and 2021-2024) were accompanied by an increase in the share of auctioned rather than allocated allowances and by several other changes of rules, in particular the creation of a Market Stability Reserve (MSR) to absorb unused allowances. That led to a substantial reduction in the emissions allowance surplus and a subsequent surge in permit prices, as clearly shown in Figure 1 (Carlén and Kriström 2020; Bua et al. 2021).
Figure 1. Historical changes in ETS allowance prices (Carbon Emissions Futures)
Source: Fusion Media Limited
Source: Fusion Media Limited
Since the introduction of the EU ETS in 2005, emissions under the scheme have decreased by 41%. In the Nordic countries alone, ETS emissions have declined by around 42% in Denmark, 35% in Sweden, and 33% in Finland between 2012 and 2020 (Figure 2). Emissions increased in Iceland and Norway during this period due to a recovery in international oil prices – which affected oil-related activity in Norway – and an increase in aluminium production in Iceland. As part of the Fit for 55 Package, the EU institutions have adopted a new target to reduce emissions from the EU ETS sectors by 62% by 2030, compared to 2005 levels. To reach this target, the European Commission proposed a one-off reduction in the overall emissions cap by 117 million allowances, and a steeper annual emission reduction of 4.2%, instead of 2.2% per year under the current system (EC 2021b). All Nordic countries must contribute by speeding up the reduction of greenhouse gas emissions to reach this goal.
Figure 2. Verified greenhouse gas emissions under the ETS Directive (2003/87/EC)
Source: Own, based on EU ETS Union Registry databasex
Source: Own, based on EU ETS Union Registry databasex
Under the new Fit for 55 framework, the Council and European Parliament also agreed to include maritime shipping emissions within the scope of the EU ETS, with a gradual introduction of obligations for shipping companies to surrender allowances, namely 40% for verified emissions from 2024, 70% for 2025, and 100% for 2026. Moreover, the Council and European Parliament agreed to gradually end free allowances for sectors vulnerable to carbon leakage covered by the new Carbon Border Adjustment Mechanism (CBAM) – cement, aluminium, fertilisers, electric energy production, hydrogen, iron, and steel, as well as some precursors and a limited number of downstream products.
Targets have also been tightened for the aviation sector. Under the EU ETS, all airlines operating intra-European flights (including departing flights to the United Kingdom and Switzerland), are required to monitor, report, and verify their emissions, and to surrender allowances against those emissions. Like any other installation registered in the ETS system, airlines receive tradeable allowances covering a certain level of emissions from their flights per year. However, the system has involved a large share of free allowances (>82%) since its adoption. Under the Fit for 55 Package, EU institutions agreed to gradually phase out free emission allowances for the aviation sector as follows, to reach full auctioning by 2027: 25% in 2024, 50% in 2025, and 100% from 2026. The Icelandic government has reached an agreement with the EU to delay these rules for Iceland due to its geographical location and dependence on air transport. Under the agreement, Icelandic aircraft operators are to receive free emission allowances up to and including 2026.
In the scope of the Fit for 55 framework, the European Council and Parliament also decided to create a new, separate emissions trading system for specific sectors currently outside the EU ETS. The new system will start in 2027 and is to apply to distributors that supply fuels to the buildings sector, road transport sector, and certain industrial sectors where the scope of the system was extended to other fuels. While the new system forms part of the ETS legislation, in practice it affects emissions in the ESR sector (see below). Part of the revenues from auctioning under the new system will be used to support vulnerable households and micro-enterprises through a dedicated Social Climate Fund that was formally adopted in April 2023 (European Council 2023b).
The cap-and-trade setup of the ETS system – under which market actors trade a fixed and declining quantity of emission allowances defined at EU level – is intended to allow the system to find the most cost-effective solutions to reduce emissions. In principle, it requires no significant government intervention. Nonetheless, some governments of EU member states have used additional policy instruments to reduce emissions in sectors covered by the ETS system to an even greater extent than required by EU emissions targets. Norway, for example, has set a carbon tax on petroleum extraction and domestic aviation on top of the ETS quota price (Golombek and Hoel 2023). It has been argued that such national measures and instruments undermine the reasoning behind the ETS system in principle, namely letting the market find the most cost-effective way to achieve the target set by the cap (Golombek and Hoel 2023).
2.2.2. Effort Sharing Regulation
Sectors outside the EU ETS are covered by a number of policy mechanisms, the most important being the Effort Sharing Decision under Regulation (EU) 2018/842 (ESR). The EU ESR covers activities such as domestic transport, housing, agriculture, small industries, and waste management, which together account for around 60% of total territorial EU greenhouse gas emissions. All EU member states, as well as Iceland and Norway, have committed themselves to applying the ESR.
The 2030 Climate and Energy Framework of 2014 determined that sectors of the economy covered by the ESR must reduce emissions by 30% by 2030 compared to 2005 levels (European Council 2014). However, whereas the ETS sector adopts a common European target, the ESR sector relies on domestic targets. Such binding yet flexible
Member states can, for example, bank and borrow part of their annual emission allocations from the following year and buy and sell allocations to other member states. In addition, countries can compensate excess annual emissions with net removals from LULUCF (up to a combined quantity of 280 MtCO2eq). Moreover, the ESR allows nine countries, including the three Nordic EU members, as well as Iceland and Norway, to use a limited amount of ETS allowances for offsetting emissions in the effort-sharing sectors for the period 2021 to 2030. The allowances are deducted from the amounts that would normally be auctioned under the EU ETS.
As things stood at the time of modelling (January 2023), currently committed ESR targets for 2030 in the Nordic countries – expressed as percentage reductions from 2005 levels – are as follows:
- Denmark: -39% (EU ESR)
- Finland: -39% (EU ESR)
- Iceland: -29% (Action Plan 2020)
- Norway: -45% (Action Plan/White paper 2021)
- Sweden: -40% (EU ESR)
However, on 27 March 2023 the European Council ratified a preliminary agreement with the European Parliament to endorse more more ambitious greenhouse gas emission reduction targets (European Council 2023c). Under this recent agreement, each Nordic member will be committed to more ambitious national targets as follows:
- Denmark: -50% (EU burden sharing)
- Finland: -50% (EU burden sharing)
- Sweden: -50% (EU burden sharing)
Iceland and Norway are also likely to make their national targets more ambitious by means of a specific Decision of the EEA Joint Committee. However, at the time of writing (April 2023) the new targets have not yet been set.
Figure 3 shows the verified greenhouse gas emissions by the ESR sectors for the 2005-2020 period (solid line), as well as the annualised targets for the 2021-2030 period set out under Implementing Decision (EU) 2020/2126 and EEA Joint Committee No 269/2019 (thinner dotted line). The plot also shows a tentative reduction trajectory towards the new ESR targets agreed under the Fit for 55 package, as defined in a new Proposal for a Regulation (EU) 72/22 amending Regulation (EU) 2018/842 (thicker dashed line).
The 2030 targets for Iceland and Norway assume a 50% reduction, and the annualised reduction trajectories for all countries have been assumed to follow a linear reduction trajectory.
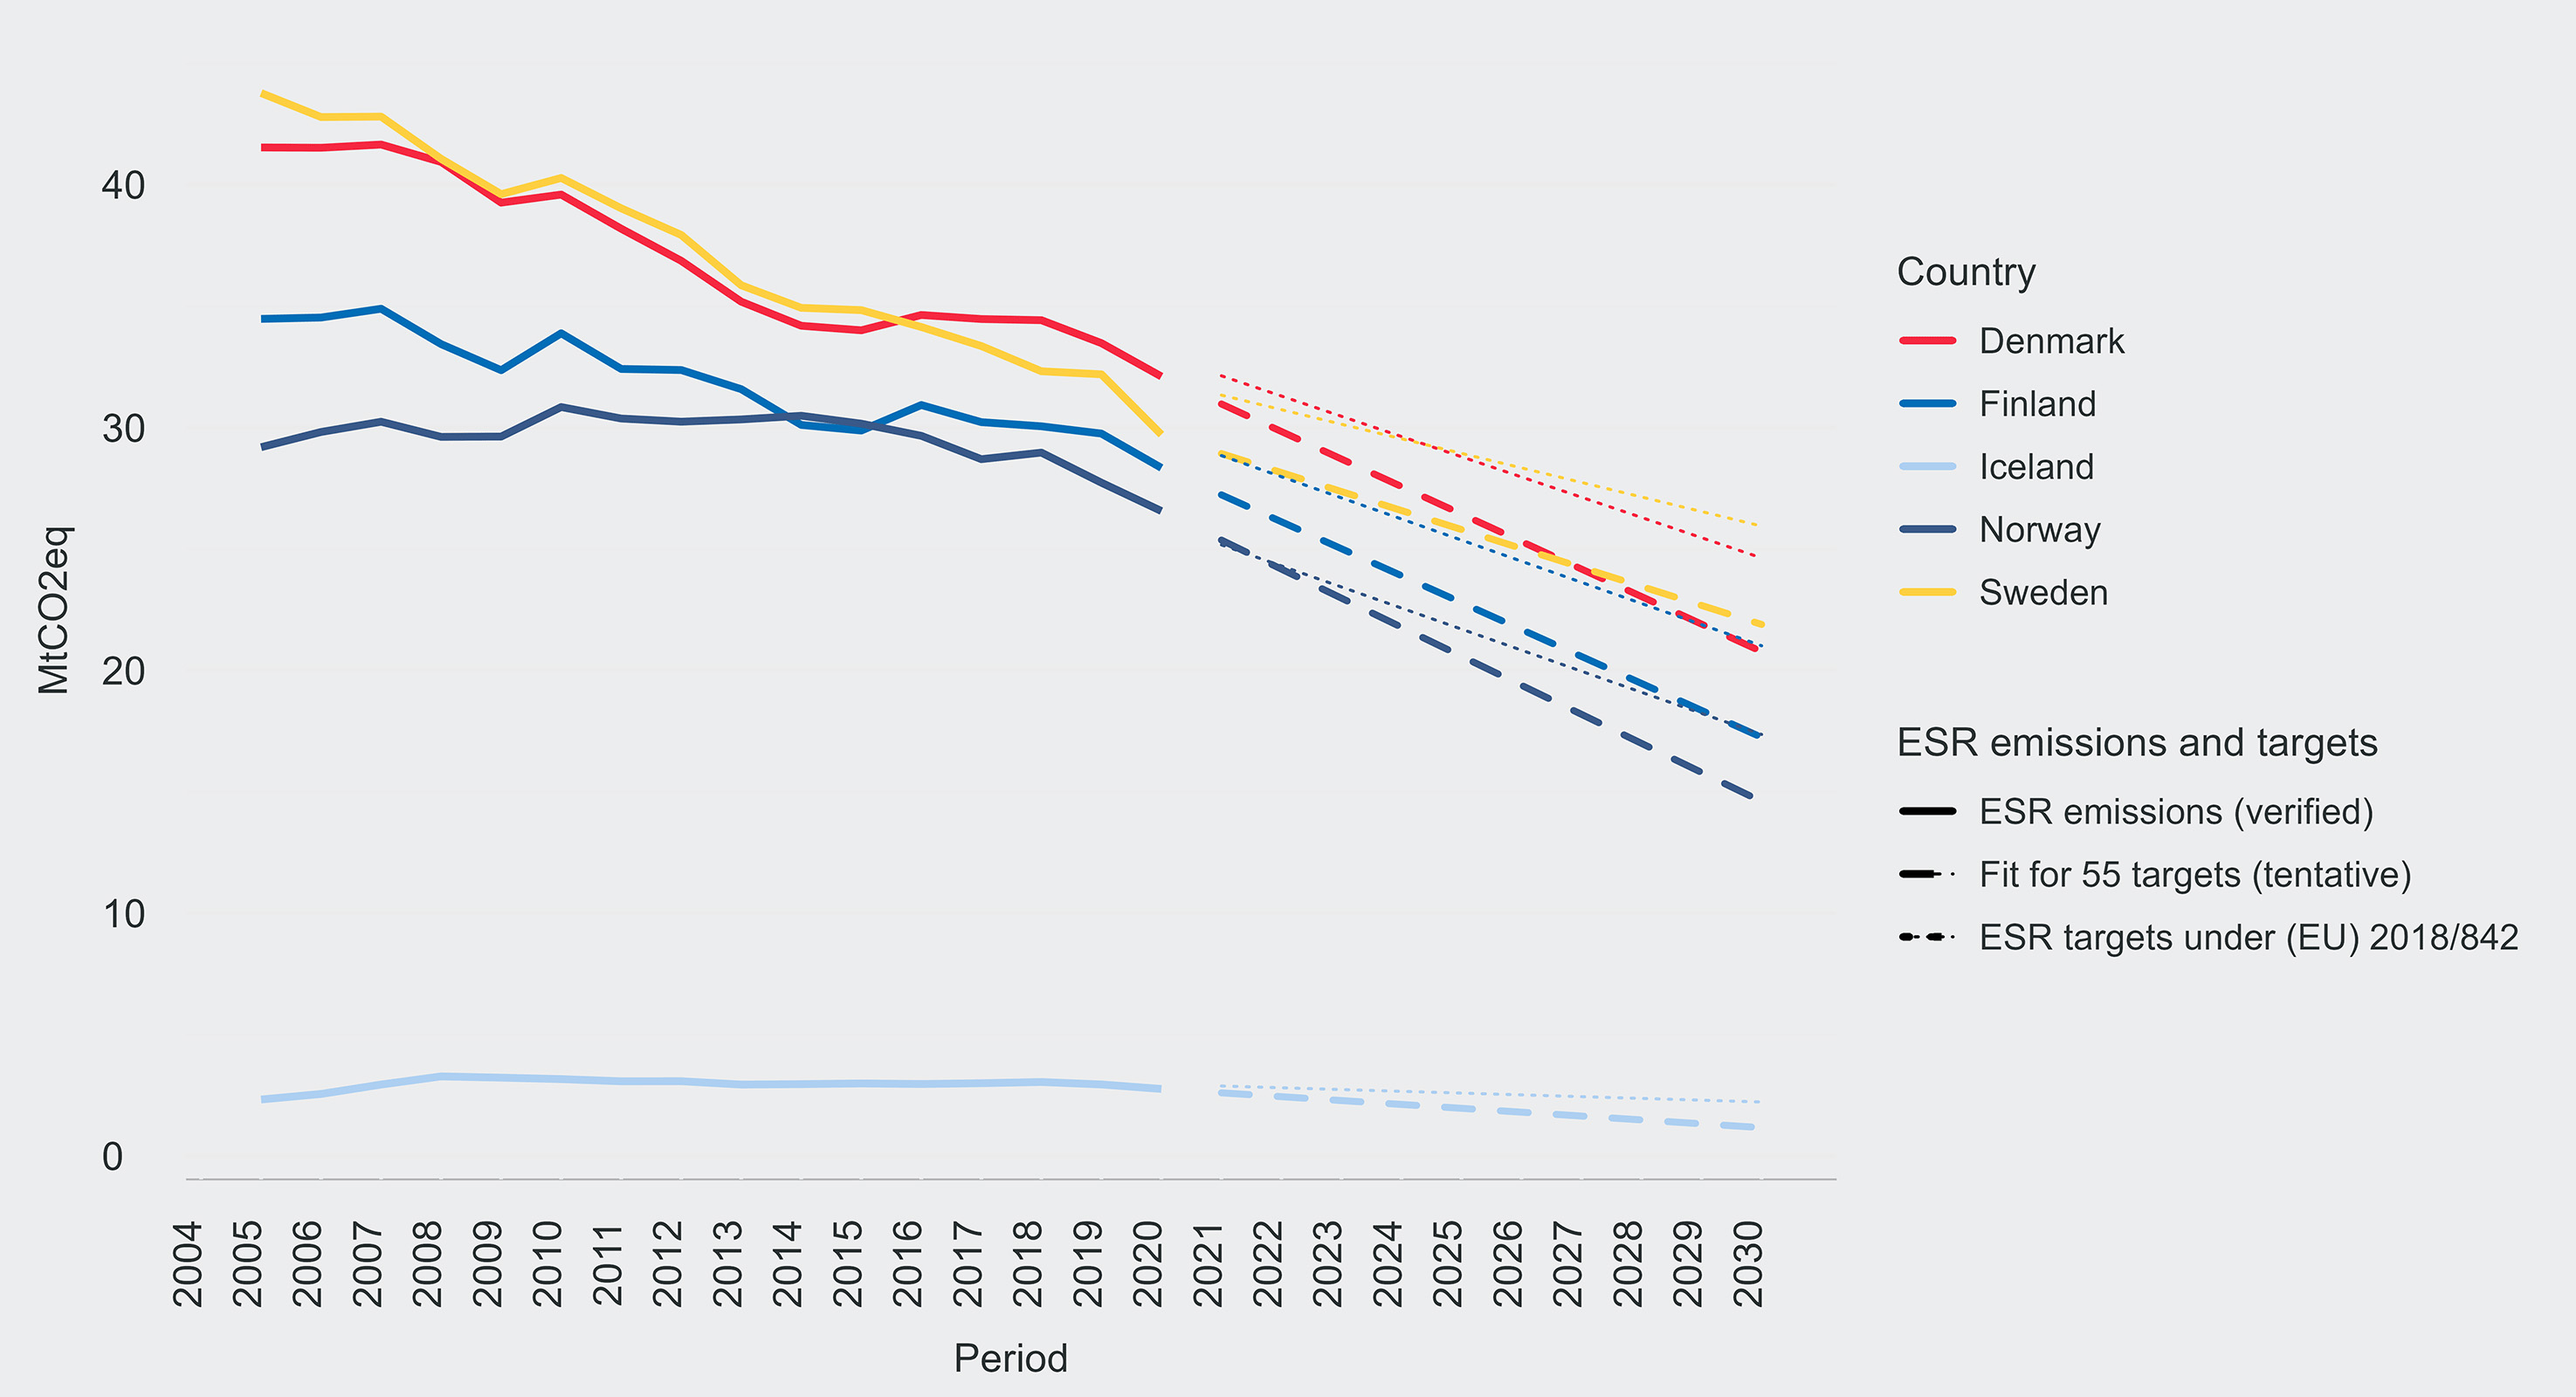
Figure 3. Total greenhouse gas emissions and targets covered by the Effort Sharing Decision
Source: Own based on EEA EU Emissions Trade System (ETS) database; Eurostat, env_air_gge (verified emissions); Implementing Decision (EU) 2020/2126; Decision of the EEA Joint Committee No 269/2019 (current targets as of March 2023); Proposal for a Regulation (EU) PE-CONS 72/22 (tentative targets under Fit for 55)
Source: Own based on EEA EU Emissions Trade System (ETS) database; Eurostat, env_air_gge (verified emissions); Implementing Decision (EU) 2020/2126; Decision of the EEA Joint Committee No 269/2019 (current targets as of March 2023); Proposal for a Regulation (EU) PE-CONS 72/22 (tentative targets under Fit for 55)
Under the Fit for 55 package, the EU member states and other participating countries are responsible for achieving the new, more ambitious national targets through domestic policy instruments and at the same time making the transition as efficient as possible while not increasing social inequalities. In other words, while the targets are fixed, national governments are responsible for adopting policies to successfully achieve them, with the rules allowing for considerable flexibility. For instance, member states can bank and borrow part of their annual ESR emission allocations from the following year, as well as buy and sell allocations to other member states.
However, ESR flexibility rules are somewhat constrained by concurrent EU-wide regulations that limit member states’ ability to freely decide on the pathways to take towards reducing emissions under the ESR scheme. An important example is the new mandatory emission reduction target for new cars and vans, which will set an upper limit on the emissions produced by car manufacturers. Under the new rules set by the proposed regulation (PE-CONS 66/22), all new cars sold in the EU must be emissions-free by 2035. The regulation also sets an intermediate goal of reducing CO2 emissions from new cars by 55% by 2030, compared to 2021 levels. In addition, a legislative proposal under the Fit for 55-package establishes a new ETS system for fuels used in the building sector, road transport sector and some industrial sectors currently not covered by the EU ETS, with a suggested start date of 2027 or 2028 (see above). Such regulations place some limits on EU member states’ leeway to implement national policies for reaching their ESR emission reduction targets.
2.2.3. Emissions covered by the Land Use, Land Use Change and Forestry Regulation
The Land Use, Land Use Change and Forestry (LULUCF) Regulation (EU) 2018/841 lays down the rules for the accounting of CO2 emissions and removals from all forms of natural or seminatural land cover, including wetlands but excluding agriculture (EU 2018b). This regulation was extended to Iceland and Norway by incorporation into the EEA Agreement by Joint Committee Decision No 269/2019, which entered into force on 11 March 2020 (EEA Joint Committee 2019). Under this regulation, emissions from LULUCF are to be entirely compensated by an equivalent accounted removal of CO2 from the atmosphere through targeted action in the sector. This is known as the ‘no-debit’ rule. Based on the no-debit commitment, the LULUCF Regulation is to generate no less than -225 MtCO2eq of net GHG removals for the EU as a whole by 2030.
In the 2030 Climate Target Plan, the European Commission proposed to increase the annual carbon removals goal through LULUCF management to -310 MtCO2eq removals by 2030, aimed at achieving ‘climate neutrality’ in the combined land use, forestry, and agriculture sector at the EU level by 2035 (EC 2021c). The new overall EU-level objective of 310 million tonnes of carbon dioxide equivalent (MtCO2eq) equivalent of net removals in the LULUCF was ratified by all parties and formally adopted by the Council on 27 March 2023 (European Council 2023b). For the 2026-2030 period, each member state will have a binding national target consistent with the newly agreed net greenhouse gas removal target for 2030.
Similar to the ESR system, emissions uptake obligations are defined at the EU level for the various member states, but it is up to the national governments to decide on how to reach those targets. Member states can also trade net-uptake certificates with one another and can link their work in the ESR and LULUCF sectors. As such, ESR quotas may be used to cover underperformance in the LULUCF sector and, conversely, LULFC certificates may be used to compensate for deficits in the ESR sector.
To summarise, the Fit for 55 package increases climate policy ambitions at the EU level substantially. Once the various policies and instruments become legally binding, practically all sectors and industries will be covered by an emissions trading system or other type of regulation. The goal of the various policies will be to lower greenhouse gas emissions in the EU and contribute to the goal of making the EU climate-neutral by 2050. In the context of the increasingly ambitious EU policy framework, national climate policies remain important to achieving nationally defined emission reduction targets, especially in the ESR and LULCF sectors. The following section provides a comparison of current national climate laws and goals in the Nordic countries.
2.3. The Nordic climate policy framework
All of the Nordic countries have aligned their climate change mitigation efforts with those approved at EU level. Nonetheless, the Nordic countries have a tradition of going beyond what is strictly required by EU climate goals (Flam and Hassler 2023). That is reflected clearly in current emission reduction targets approved at the national level (Table 1):
In Denmark, the Climate Act (Lov om klima) aims to reduce total territorial emissions by 70% by 2030, in comparison to 1990. Climate neutrality is to be achieved by 2050, i.e. remaining greenhouse gas emissions are to be absorbed by natural carbon sinks in its own territory.
Denmark’s grand coalition government, led by Mette Frederiksen, has announced plans to reach climate neutrality by 2045, i.e. five years earlier than previously planned.
At the Nordic level, the Nordic national governments confirmed their commitment to ambitious climate goals in 2019 by adopting the Nordic Vision 2030. This key steering document for Nordic cooperation sets the goal of the Nordic Region being the most sustainable and integrated region in the world in 2030. This includes a commitment to promote the transition towards carbon neutrality.
These ambitious targets reflect how climate change mitigation ambitions remain higher than those agreed at the EU level in most of the Nordic countries, even if the new Fit for 55 targets have substantially reduced the gap between the Nordic and overall EU climate goals (Flam and Hassler 2023). Under the current national climate laws, several Nordic countries aim to achieve carbon neutrality between 2035 and 2045, whereas the EU ambition remains to become a climate-neutral continent by 2050. The more ambitious Nordic climate goals will not be reached by relying solely on EU policies and regulations (Liski and Vehviläinen 2023). Additional national instruments and policies are required to make the intended progress in curbing emissions. As described in this chapter, those measures should most usefully apply to sectors falling under the ESR and LULUCF fields.
Table 1. Climate laws and long-term targets in the Nordic countries
Climate policy | Climate goals Carbon neutrality means that the amount of emitted CO2 emissions is compensated by an equal amount of CO2 being removed from the atmosphere, e.g. through carbon sinks. Climate neutrality defines the goal of net zero emissions not only for CO2, but also for other types of greenhouse gases. | Responsible ministry/national authority | |
Denmark | Climate Act/ Lov om klima LOV nr 965 af 26/06/2020 |
| Ministry for Energy, Utilities, and Climate |
Finland | Climate Change Act/ Ilmastolaki/ Klimatlag 423/2022 |
| Ministry of the Environment (responsible for the Medium-Term Climate Change Policy Plan) Ministry of Economic Affairs and Employment (responsible for the Long-Term Climate Change Policy Plan) |
Iceland | Climate Change Act/ Lög um loftslagsmál 2012 nr. 70 29. júní |
| Ministry of the Environment, Energy, and Climate |
Norway | Climate Law/ Lov om Klimamål (LOV-2017-06-116-60). Last revised 2022 |
| Ministry of Climate and Environment |
Sweden | Climate Law/ Klimatlag SFS 2017:720 |
| Ministry of Climate and Enterprise Swedish Environmental Protection Agency |
2.4. Long-term emissions trajectories and energy mixes in the Nordic countries
Despite the coordinated climate policy action, the Nordic countries still paint a very different picture from one another when it comes to emission patterns and energy mixes. These factors shape the nature of climate ambitions, with respect to climate neutrality or carbon neutrality, and the proposed timing for reaching the agreed goals in each country. It is therefore important to shed light on differences in emission patterns and energy mixes in the Nordic countries to understand not only the purpose of climate policies in each country, but also their potential economic, social, and territorial impacts.
2.4.1. Territorial greenhouse gas emissions by source sector
This section presents an overview of the decarbonisation trajectories of each of the Nordic countries, considering emission sources. The analysis covers the 1990-2019 period and focuses on all types of territorial greenhouse gas emissions, excluding LULCF and memo items
In the gas emissions inventories submitted to the UNCCC, countries are asked to report emissions from international aviation and marine bunkers and multilateral operations, as well as CO2 emissions from biomass, under a Memo Items category. These are not accounted for in the calculation of total greenhouse gas emissions. For example, CO2 emissions from the combustion of biomass fuels are reported as a memo item and are therefore not included in the total emissions from fuel combustion. Calculations of these emissions are generally based on the accounting methods and emission factors set out in the EMEP/EEA air Pollutant Emission Inventory Guidebooks (EMEP/EEA, 2007, 2013, and 2019).
Sectors
■ Waste management
Figure 4. Greenhouse gas emissions in the Nordic countries, by source sector
Source: Eurostat (env_air_gge)
*Excluding Land-Use Change and Foestry and memo items, but including international aviation and navigation
Source: Eurostat (env_air_gge)
*Excluding Land-Use Change and Foestry and memo items, but including international aviation and navigation
Most of the Nordic countries were successful in reducing industrial emissions during the 1990-2019 period. The Fuel combustion in energy industries sector made a leap forward in terms of emission abatement in several of the countries. In Denmark, for example, this sector reduced greenhouse gas emissions by 17.5 MtCO2eq between 1990 and 2019. That represents a 67% reduction, which was achieved mainly as result of a large increase in wind power generation, which replaced carbon-intensive coal and gas power (IEA 2017). Progress in Finland and Sweden was also substantial in this sector (-1.7 and - 2.7 MtCO2eq, equivalent to a 14% and a 17% decrease, respectively). Thanks to the abundance of renewable energy sources – mostly hydro and geothermal –, emissions in the Fuel combustion in energy industries sector are negligible in Iceland, where house heating was converted almost entirely from oil to geothermal during the 1970s and 1980s. In Norway, however, emissions in this sector increased by 7.8 MtCO2eq (a 108% rise) due to the toll of oil production. Upstream oil and gas activities, comprising exploration, production, transportation, processing, and vessel loading, account for a significant proportion of those emissions (Hall 2020).
Due to its own financial reliance on oil production boosted by the high international demand for oil, Norway has so far prioritised nature-based solutions as its fundamental decarbonisation strategy. The strategy has been developed domestically – through its own forestry sector – and abroad – through accredited programmes in developing countries contributing to abating emissions and preserving natural carbon sinks (Hall 2020).
Emissions in the Fuel combustion in manufacturing industries and construction sector also declined over the 1990-2019 period in all of the Nordic countries. Emission cuts ranged from a 76% decrease in Iceland to a 15% reduction in Norway. In Iceland, the reduction was driven by the switch from oil to electricity as a power source in manufacturing industries, particularly at fish meal plants. The largest absolute reduction was in Finland (-6.8 MtCO2eq, a 51% decrease). Here, the key factors were the increased use of biofuels in the forest industry and outsourcing of power plants from industry to the energy sector (Statistics Finland 2022). In Sweden, emissions from manufacturing industries and construction fell by 37% between 1990 and 2019 (-4.0 MtCO2eq), as fossil fuels were replaced by electricity or biomass (Ministry of Environment 2019).
Progress in the Industrial processes and product use sector was mixed. During the 1990-2019 period, Denmark and Norway managed to reduce their emissions in this sector by 14% and 38%, respectively, while emissions in Finland (2%) and Sweden (6%) did not undergo substantial change. In Iceland, greenhouse gas emissions from industrial processes increased by 122% between 1990 and 2019, particularly during the years 2006 to 2008, when emissions from industrial processes doubled. The metal industry – mainly aluminium smelting and ferroalloys production – accounts for the largest proportion of those emissions. In a global context, however, the absolute increase in Icelandic industrial processing emissions is modest (1.1 MtCO2eq). Moreover, as stressed by Weber and Søyland (2020), the low-carbon energy inputs used by Iceland’s industry offset the more carbon-intensive processes that would occur if these processes were performed elsewhere in the world. That is because all primary energy used to produce electricity comes from renewable sources, in particular hydro and geothermal (see Section 2.4.2).
Emissions from fuel combustion in commercial, institutional, and residential buildings account for the largest share of the emissions included in the Other fuel combustion sectors. These emissions lessened significantly in all of the Nordic countries thanks to the increased use of district and electric heating in residential, commercial, and public buildings (Statistics Finland 2022). In Sweden, for instance, oil-fired combustion furnaces used for heating purposes in the residential sector have been replaced on a massive scale by district heating and electric heat pumps (Ministry of Environment 2019). Emission cuts in this sector range from a 78% decrease in Sweden (-8.7 MtCO2eq) to a 35% reduction in Iceland (-0.3 MtCO2eq), thanks to continued development of geothermal heating.
Looking at the development of greenhouse gas emissions in the 1990-2019 period, agriculture is the sector where the attainments of the countries are more similar. In Denmark, emissions declined by 13% (-1.8 MtCO2eq). In Iceland, Finland and Sweden, emission reductions in this sector were in the environment of 11% and 12%, while in Norway emissions in the primary sector declined by 6%.
Progress in transport, including international aviation and navigation, has been limited and unevenly distributed. In a Nordic comparison, only Sweden (-3.1 MtCO2eq) and Finland (-0.8 MtCO2eq) managed to reduce greenhouse gas emissions in the transport sector between 1990 and 2019 (-15% and 7%, respectively). In Iceland, the increase of emissions in the transport sector was as high as 71% (0.4 MtCO2eq), driven by the boom in tourism that started around the year 2013. In Denmark, domestic emissions in 2019 were 22% higher than in 1990 (2.3 MtCO2eq), while in Norway the increase during this period was 27% (2.7 MtCO2eq). The international transport memo items also show a contrasting performance. As long-distance tourism became more popular during the time period considered here, the emissions from international aviation increased substantially in all of the Nordic countries, ranging from a 336% rise in Iceland (0.7 MtCO2eq) to a 77% increase in Denmark (1.4 MtCO2eq). In Iceland emissions from international aviation increased particularly rapidly during the 1990-2020 period. That development was driven by tourism. In particular, international tourist visits to Iceland have increased considerably during the last two decades, resulting in more flights to and from the country. After a single unbridled period of growth during the first two decades of 21st century, the influx of international tourists to Iceland came to a full stop due to the COVID-19 pandemic (Norlén et al. 2022, Ch. 10). That resulted in a sharp decline of emissions in this sector in 2020, while the 2021 figures already anticipated a post-pandemic boom. Emissions from international navigation decreased in Denmark, Finland, and Norway (by 26%, 43% and 53%, respectively), but increased in Iceland (632%) and Sweden (196%).
Emissions in Other fuel combustion sectors that are ‘not elsewhere classifiable’ (n.e.c.) represent a very small proportion of total emissions in all countries, with Finland being the only exception. Here, the subcategory covers emissions from non-specified consumption of fuels and statistical corrections of fuel consumption, including fuels for military use and emissions from pipeline transport. These emissions decreased by 31% compared to 1990 levels (Statistics Finland 2022).
In order to reach the ambitious climate goals at national and European levels that were described in previous chapters, transport is one of the main sectors where emissions need to be reduced. Looking across the Nordic countries, this sector continues to account for a large share of emissions, meaning that progress in abating emissions would have a large impact. This sector also falls under the Effort Sharing Regulation (ESR) and is therefore a policy area where the national governments of the Nordic countries have greater influence on how to achieve European climate targets. In later sections of this report, we will therefore focus, among other things, on this sector and analyse the impacts of climate policies aimed at abating emissions originating from transport.
2.4.2. Energy consumption and energy mixes
The emissions trajectories described in the previous section are closely related to those illustrated in Figure 5, which shows the evolution of primary energy consumption
The share is higher if primary energy is calculated using a 'direct method', which does not take account of the intrinsic inefficiencies of energy production from fossil fuels.
Figure 5. Primary energy consumption by source in the Nordic countries (1990-2021)
Source: Our World in data and BR Statistical Review of World Energy
*Note: “Other renewables” includes geothermal, biomass and waste energy
Source: Our World in data and BR Statistical Review of World Energy
*Note: “Other renewables” includes geothermal, biomass and waste energy
As illustrated in Figure 5, since the 1990s the share of renewable and non-fossil fuels in the Nordic energy mix has increased steadily. In 2021, the largest share of the primary energy consumed in Iceland and Norway comes from renewable energy, in particular hydropower (73% and 67% of total electricity consumption, respectively). In Iceland other renewables, in particular geothermal energy, also accounted for a significant share of the primary energy consumed in 2021 (12%). In Sweden hydropower (31%) is supplemented by wind (12%), biofuels (3%), solar (1%), and other renewables (2%). In Denmark, the contributions of wind (26%), solar (2%), and other renewables (6%) are more substantial than in the other Nordic countries. In Finland wind (7%) and hydro (14%) produce the largest proportion of renewable energy consumed locally. Liquified biofuels represent 2% of primary energy consumption, whereas other renewables, in particular biomass, constitute an even larger proportion of the total primary energy consumed in Finland (5%). Nuclear energy plays a major role in Sweden (22%) and Finland (21% of primary energy consumption).
In most countries, the expansion of renewable energy and nuclear power has gone hand in hand with a proportional decrease in fossil fuel consumption (coal, gas, and oil). Measured in absolute terms, between 1990 and 2021 the use of fossil fuels decreased by 89.2TWh (down 45%) in Denmark, by 69.6TWh (-32%) in Finland, by 90.2TWh (-34%) in Sweden, and by 1.2TWh (-14%) in Iceland. By contrast, the amount of primary energy from fossil fuels consumed in Norway increased substantially during the same period (20.5TWh; up 15%).
Regardless of past trends, coal, oil, and gas still make a major contribution to primary energy consumption structures in the Nordic countries. That is particularly so in Denmark (oil: 45%, gas: 14%; coal: 8%), Finland (oil: 33%, gas: 7%; coal: 11%), and Sweden (oil: 25%, gas: 2%; coal: 3%), but, to a lesser extent, also in Norway (oil: 19%, gas: 8%; coal: 2%), and Iceland (oil: 15%). The figures imply that, even if major progress has been achieved in terms of renewable energy production, substantial decarbonisation challenges remain in all Nordic countries due to fossil-based energy mixes (Sweden, Finland, and Denmark), oil production (Norway), and industrial processing (Iceland). In the simulations presented later in this report, we will focus on one such decarbonisation strategy and model the macro-economic and socio-economic impacts of phasing-out all remaining coal-fired electricity in the Nordic Region.