Photo: Julius Ysl, unsplash.com
5. The effects of Nordic greenhouse policies: percentage deviations from the no-policy baseline
This chapter presents simulation results for the effects on the Nordic economies of the greenhouse policy shocks described in Section 4. The results are mainly expressed as percentage deviations in 2030 from the no-policy baseline described in Section 4.2. For example, the first result in Table 8 means that real household consumption in Denmark in 2030 is 1.32 per cent lower with the climate policies in place than it would be without the policies.
To present the results, we have first calculated the contribution of the Nordic policies to greenhouse abatement. We then describe macro effects and industry output effects at the national level, followed by labour-market effects at the national and regional levels. Finally, we look at effects on the costs of living for households classified by urban, intermediate, and rural location and income decile in the Nordic countries.
5.1. Carbon dioxide equivalent emission effects
Table 5 and Table 6 show differences and percentage differences between baseline (no policy) CO2eq emissions in 2030 and emissions in 2030 with the greenhouse policies in place. Looking at those tables, we see that our simulated policies generate significant reductions in emissions from combustion of coal in Denmark, Finland, and Sweden. In Denmark and Finland, the phase-out of coal and peat-fired electricity is the major contributor. In Sweden, the main factors are the reduction in the use of coal per unit of output in petroleum and coal products, and reduction in the output of petroleum and coal products.
The simulated policies generate increased emissions from combustion of gas in Denmark, Finland, and Norway. That is explained by an increase in output of gas-fired electricity (see Section 5.3, Table 10, industry 30). In Sweden, gas-fired electricity contracts, leading to reduced emissions from combustion of gas. In Iceland there is almost no use of gas.
Table 5. Policy-induced change in CO2 eq. emissions in 2030 (Kt)
Denmark | Finland | Iceland | Norway | Sweden | |
Combustion of: | |||||
Coal | -3070 | -10888 | 20 | -74 | -4903 |
Gas | 954 | 1934 | 0 | 338 | -157 |
PetrolCoalPrds | -1249 | -6514 | -105 | -3806 | -17331 |
Activity in: | |||||
Forestry & land | 0 | 0 | 0 | 0 | 0 |
Other | 59 | -627 | 26 | -668 | -1591 |
Total (net)* | -3306 | -16095 | -59 | -4210 | -23982 |
* Includes LULUCF
Table 6. Policy-induced percentage change in CO2 eq. emissions in 2030
Denmark | Finland | Iceland | Norway | Sweden | |
Combustion of: | |||||
Coal | -80.4 | -65.4 | 2.5 | -1.6 | -50.3 |
Gas | 13.7 | 40.0 | 1.7 | 2.2 | -7.0 |
PetrolCoalPrds | -5.5 | -29.9 | -9.2 | -20.9 | -58.0 |
Activity in: | |||||
Forestry & land | 0.0 | 0.0 | 0.0 | 0.0 | 0.0 |
Other | 0.4 | -4.0 | 0.8 | -3.4 | -8.2 |
Total (net)* | -6.3 | -35.6 | -0.4 | -10.1 | -97.6 |
* Includes LULUCF
In all countries, Tables 5 and 6 show reductions in emissions from combustion of petroleum and coal products. That is explained by two factors: increased biofuel shares of motor fuels and decreased use of motor fuels associated with uptake of EVs. We assume no change in the emissions from forestry and land use.
Policy-induced changes in emissions in the ‘Other’ category are relatively small. They reflect changes in the industrial composition of output. The main contributor to the positive entry for Denmark is an expansion of the output of crops (see Section 5.3, Table 10, industry 1,), which generates emissions through soil disturbance. In the case of Finland, Sweden, and Norway, the contraction in the output of petroleum and coal products reduces activity-based emissions from this industry. In Iceland, expansion of ferrous and non-ferrous metals (industries 20 and 21, Table 10) increases activity-based emissions from these industries.
The first two rows of Table 7 present index numbers for 1990 and 2019 representing gross greenhouse emissions from the Nordic countries. By gross, we mean emissions excluding carbon sequestration in forests and emissions associated with changes in land use. The third row, calculated from the first two, shows the percentage changes in emissions between 1990 and 2019. Row 4 gives baseline emission indexes for 2030, assuming no further greenhouse policies. The entries in row 4 were calculated using baseline growth projections for gross CO2eq emissions (see Appendix 1, Table 10). Row 5 shows estimated policy-induced percentage reductions in gross emissions (see Table 6). Row 6 gives the emission indexes with the simulated policies, calculated by applying the percentages in row 5 to the indexes in row 4. Row 6 can be compared with row 7, which shows emissions targets. These are either official targets for 2030 or have been interpolated from targets announced for later dates. Comparison of rows 6 and 7 indicates that attainment of the 2030 targets for Denmark, Finland, Norway, and Iceland will require policies beyond those that we have examined. In the case of Sweden, implementation of its ambitious biofuel targets would take it below its 2030 greenhouse target.
Table 7. Gross
This measure of emissions is referred to as gross because it does not include emissions from LULUCF.
Denmark | Finland | Iceland | Norway | Sweden | ||
1 | Emissions index 1990 | 1 | 1 | 1 | 1 | 1 |
2 | Emissions index 2019* | 0.65 | 0.77 | 1.46 | 1.01 | 0.73 |
3 | Percentage change from 1990 to 2019 | -34.65 | -23.29 | 45.74 | 1.36 | -26.52 |
4 | Emissions index for the no-policy baseline 2030 | 0.72 | 0.86 | 1.64 | 1.15 | 0.88 |
5 | Percentage deviations in 2030 due to greenhouse policies | -6.72 | -27.36 | -1.12 | -7.23 | -39.12 |
6 | Emissions index in 2030 with greenhouse policies in place | 0.67 | 0.62 | 1.62 | 1.07 | 0.54 |
7 | Emissions index target for 2030** | 0.45 | 0.57 | 1.29 | 0.82 | 0.63 |
* Source: Eurostat (env_air_gge): https://ec.europa.eu/eurostat/web/products-datasets/-/env_air_gge
** Source: European Environmental Agency. EEA greenhouse gas projections – data viewer: https://www.eea.europa.eu/ds_resolveuid/DAS-235-en
5.2. Macro effects at the national level
Table 8 shows results for national macro variables. The big picture is that the greenhouse policies described in Section 4 will have moderate macroeconomic costs for the Nordic countries. Due to these policies, their real GDP in 2030 will be reduced by between 0.18 per cent and 1.31 per cent; their real wage rates will be reduced by between 0.68 per cent and 2.64 per cent; and their real household consumption levels will be reduced by between 0.59 per cent and 1.51 per cent. These negative macroeconomic effects should be assessed in the context of baseline growth. For example, the greenhouse-related reduction in real GDP for Sweden of 1.31 per cent means that real GDP will grow by 19.9 per cent between 2019 and 2030, rather than by 21.5 per cent (see the baseline growth projections in Table 2).
Table 8. Macro effects (%) in 2030 of greenhouse policies in Nordic countries
Denmark | Finland | Iceland | Norway | Sweden | ||
1 | Real household consumption (C) | -1.32 | -1.27 | -0.59 | -1.14 | -1.51 |
2 | Real investment (I) | 0.11 | -0.06 | 0.00 | 0.21 | -0.05 |
3 | Real government consumption (G) | -1.32 | -1.26 | -0.59 | -0.93 | -1.43 |
4 | Real GNE (combination of C, I, G) | -1.01 | -1.00 | -0.49 | -0.74 | -1.13 |
5 | Export volumes (X) | -1.2 | -2.66 | 0.63 | -2.61 | -2.75 |
6 | Import volumes (M) | -1.36 | -2.83 | 0.06 | -1.23 | -2.34 |
7 | Real Gross Domestic Product (GDP) | -0.73 | -1.16 | -0.18 | -1.22 | -1.31 |
8 | Aggregate employment | 0.00 | 0.00 | 0.00 | 0.00 | 0.00 |
9 | Average real wages | -0.76 | -2.15 | -0.70 | -0.68 | -2.64 |
10 | Aggregate capital stock | -0.65 | -0.10 | 0.00 | 0.00 | 0.00 |
11 | GDP price index | -0.81 | -0.02 | -0.59 | -0.19 | -0.00 |
12 | Consumer Price Index (CPI) | -0.20 | 0.06 | -0.18 | -0.45 | 0.16 |
13 | Export price index | -0.40 | 1.52 | -0.18 | 1.86 | 1.74 |
14 | Import price index | 0.93 | 0.67 | 0.39 | 0.34 | 0.31 |
15 | Population | 0.00 | 0.00 | 0.00 | 0.00 | 0.00 |
16 | Welfare | -0.99 | -0.72 | -0.29 | -0.38 | -0.91 |
As will become apparent in the detailed explanation, the results in Table 8 depend on the following assumptions:
- greenhouse policies do not affect aggregate national employment in the Nordic countries in 2030. We assume that wage rates (rather than employment) adjust in the long run to accommodate productivity and cost changes caused by greenhouse policies.
- greenhouse policies do not affect nominal exchange rates. To the extent that these policies require changes in the competitiveness of the Nordic economies, this is achieved through changes in domestic price levels. This is a technical assumption that does not affect the results for industry outputs and other real variables.
- aggregate investment in each Nordic country during the period from 2019 until the start of 2030 is not affected by greenhouse policies. That means that aggregate capital in each Nordic country at the beginning of 2030 is unaffected by greenhouse policies, apart from the early scrapping of coal-fired electricity generation capacity.
- investment/capital ratios at the aggregate level in each Nordic country in 2030 are unaffected by greenhouse policies. We therefore assume that business confidence in 2030 is independent of greenhouse policies. Together with our previous assumption concerning aggregate capital, our investment assumption for 2030 means that greenhouse policies are assumed to have very little effect on investment in 2030.
- greenhouse policies do not affect the ratio of nominal private consumption to nominal GDP in the Nordic countries or the ratio of real public consumption to real private consumption. We therefore assume that the costs of greenhouse policies are shared equally between the public and private sectors.
With these assumptions in mind, in the following points we explain these results in Table 8, starting with the real GDP deviations in row 7:
Real GDP deviations (row 7, Table 8)
The real GDP results can be understood via the stylised equation:
(4.1)
real GDP = F (NR, K, L, Tech, Eff)
In this equation, real GDP is determined as a function of the use of natural resources (NR), the use of capital (K), the use of labour (L); technology or productivity (Tech); and efficiency (Eff), which refers to the ability of the market to allocate resources in ways that optimise the aggregate value of production. Using this stylised framework, Table 9 decomposes the real GDP deviations from row 7 of Table 8 into four parts.
Labour (L) is omitted from this breakdown because we assume that the greenhouse policies have no effect on aggregate employment in 2030; see row 8 of Table 8
- reduced oil production (reduced use of natural resources). This is important for Norway and to a lesser extent Denmark. It does not affect the other three countries.
- capital loss. This arises from early scrapping of coal-fired electricity generation capacity. That effect is mainly pronounced in Denmark. By 2019, the other Nordic countries had very little coal-generated electricity so their real GDP in 2030 is barely affected by our assumption of a 90% phase-out of remaining capacity.
- deterioration in production technology. This arises from our assumption that the shift towards biodiesel increases the cost of providing motor fuels. That is simulated as a technological deterioration or a reduction in output per unit of input in creating motor fuels.
- efficiency or dead-weight losses. Efficiency losses arise when consumers are induced to switch from high-taxed products to lower taxed products. That occurs in the current simulation because households switch from petroleum and coal products (very highly taxed) to electricity (taxed at lower rates than petroleum).
Table 9. Breakdown of GDP effects: percentage contributions
Use of natural resources (oil) | Capital loss (coal) | Production efficiency (Petrol prods) | Dead-weight losses (switch to electricity) | Real GDP | |
Denmark | -0.24 | -0.21 | -0.02 | -0.25 | -0.73 |
Finland | 0.00 | -0.02 | -0.80 | -0.35 | -1.16 |
Iceland | 0.00 | 0.01 | 0.00 | -0.19 | -0.18 |
Norway | -0.45 | -0.01 | -0.38 | -0.39 | -1.22 |
Sweden | 0.00 | 0.03 | -0.91 | -0.42 | -1.31 |
Using Table 9, we can see that the real GDP loss for Iceland is small for the following reasons:
- Iceland does not produce oil and suffers no reduction in its use of natural resources;
- Iceland does not produce coal-fired electricity and suffers no capital loss;Table 9 shows tiny capital contributions for Iceland, Sweden and Norway despite capital deviations of zero in row 10, Table 8. This is a numerical quirk explained by differences between the baseline and policy runs in the capital shares in GDP.
- Iceland produces very little motor fuel and consequently suffers almost no deterioration in economy-wide production technology; and
- households in Iceland allocate a relatively low budget share to petroleum products so the switch towards electricity causes a relatively small efficiency loss.
By contrast, Sweden has a relatively large GDP loss due to this country's large switch to biofuels (see columns (1) and (2) of Table 3), which is reflected in Table 9 by a high entry in the production efficiency column.
Real private and public consumption (rows 1 and 3, Table 8)
Real private and public consumption fall relative to real GDP (row 7, Table 8) in four of the Nordic countries. Norway forms an exception. In our simulation, we assume that the value of private consumption in each region changes in line with the value of the region’s GDP. Consequently, the value of private consumption in each nation changes approximately in line with the value of the national GDP. In real terms, private consumption at the national level falls relative to GDP in four of the Nordic countries because the price of private consumption rises relative to the price of GDP in those countries (rows 11 and 12, Table 8). Public consumption is assumed to change in line with private consumption in real terms in each region and this relationship is approximately maintained at the national level. Real public consumption at the national level therefore falls relative to real GDP in the four countries. In Norway’s case, the price of private consumption falls relative to the price of GDP. As a result, real national public and private consumption rise relative to real GDP in Norway.
Terms of trade (the movement in export prices relative to import prices, rows 13 and 14, Table 8) are a key determinant of movements in the price of private consumption relative to the price of GDP. A deterioration in the terms of trade (a reduction in the export/import price ratio) causes the price deflator for Gross National Expenditure (GNE, a combination of private consumption, public consumption, and investment) to rise relative to the price deflator for GDP. That is because GNE includes imports but not exports, whereas GDP includes exports but not imports. Within the scope of GNE, the price deflator for private consumption rises in all countries relative to the other components: both public expenditure and investment are labour-intensive and, as will be explained shortly, real wages fall. The terms-of-trade deterioration for Denmark and Iceland is driven by an increase in the price of their imported petroleum products. We assume that Nordic countries insist on environmental improvements in their imported motor fuels, causing an increase in the import price of motor fuels that broadly matches the increase in the cost of domestically produced motor fuels. Both Denmark and Iceland import considerable petroleum products relative to their exports of these products. Both countries therefore suffer a terms-of trade decline. That, together with the increase in the price of private consumption relative to the other components of GNE, is sufficient to explain the increases for these two countries in the price of private consumption relative to the price of GDP.
Finland, Sweden, and in particular Norway export more petroleum products than they import. Consequently, they each have an improvement in their terms of trade, implying a reduction in the price of GNE relative to the price of GDP. Nevertheless, in the case of Finland and Sweden the private consumption price index rises relative to the price of GDP. The explanation is that the increase in the price of private consumption relative to the other components of GNE is sufficient to leave private consumption prices elevated relative to the price of GDP, even though the price of GNE falls relative to the price of GDP. For Norway, the reduction in the price of GNE relative to the price of GDP outweighs the effect of the increase in the price of private consumption relative to the prices of the other components of GNE, leaving the price of GDP elevated relative to the price of private consumption.
Real wages (row 9, Table 8)
Real wages fall in all regions primarily because we assume a ‘deterioration in technology’ in the production of motor fuels, reducing the value of the marginal product of labour in terms of GDP units. The fall in real wages relative to baseline is then accentuated in all countries except Norway because we use consumer prices (rather than the GDP prices) to deflate nominal wages.
Welfare (row 16, Table 8)
In calculating changes in welfare, we include changes in most components of household consumption. However, we leave out the increase in electricity consumption and the reduction in motor fuel consumption associated with the uptake of electric cars. We also omit the increase in expenditure on electrical equipment associated with the installation of household charging stations. The reduction in expenditure on motor fuels outweighs the increase in expenditures on electricity and charging stations. Omitting these three items implies a better utility (welfare) outcome than the outcome for real household consumption.
The easiest way to explain the omission of greenhouse-related changes in expenditure on electricity, motor fuels, and electrical equipment is by way of an example. If expenditure on electrical equipment needs to increase by 25 per cent due to the installation of charging stations, then a 25 per cent increase in consumption of electrical equipment should generate no additional utility. Only consumption increases beyond those required for charging stations can be thought of as generating extra utility. The technical details of how welfare changes are calculated are set out in Appendix 1.
GDP deflator (row 11, Table 8)
The movements in price deflators for GDP are negative, indicating that the Nordic greenhouse policies cause real devaluation (it should be recalled that we assume no movement in nominal exchange rates, cf. the second bullet point at the beginning of this section). The starting point for understanding this aspect of the results is the equation:
real GDP - real GNE = X - M
i.e. the difference between real GDP and real GNE is the real trade balance (real exports less real imports).
As already described, real private and public consumption fall relative to real GDP in all Nordic countries except Norway. However, we assume that the movements in investment are small, resulting in an increase in investment to real GDP in all Nordic countries. That is sufficient to convert the decline in consumption relative to GDP for Finland and Sweden into increases in real GNE relative to real GDP. Thus, for Finland and Sweden, together with Norway, there must be a decrease in X-M. For Denmark and Iceland, X-M must increase, reflecting reductions in real GNE relative to real GDP.
In Denmark’s case, there is a direct negative effect on exports through reduced international demand for Danish oil. Nevertheless, X-M must increase. That is facilitated by real devaluation, i.e. by a reduction in the Danish price level (price of GDP, row 11, Table 8) relative to that of the rest of the world. For Iceland, there is little direct negative effect on exports. Exports are stimulated by the small real devaluation necessary to increase X-M. Although imports become more expensive, there is a small positive effect on import volumes (row 6, Table 8). That arises from high use of imported inputs by export-oriented industries.
For Sweden and Norway there are direct negative effects on exports. In the case of Norway, that occurs through contraction in demand for oil. For Sweden, the diversion of forestry products into motor fuels causes cost increases and export reductions for paper and wood products. Cost increases for motor fuels are also an important direct negative for Sweden’s exports. These direct negatives for Norway and Sweden’s exports are sufficient to require a reduction in import volumes (M), despite the reduction in X-M. The required reductions in M are achieved via small real devaluations (small declines in the GDP price deflators for Norway and Sweden, row 11, Table 8).
In Finland’s case, the export-to-import ratio rises slightly (rows 5 and 6, Table 8). That is contrary to expectations because we know that X-M must fall. Closer inspection of our results reveals that X-M does indeed fall. It emerges that for Finland, X is sufficiently greater than M that a 2.66 per cent reduction in X (row 5, Table 8) outweighs a 2.83 per cent reduction in M (row 6, Table 8), that is:
Δ(X — M) = -0.0266*X+0.0283*M<0
As in Sweden’s case, there is a direct negative impact on Finland’s exports of paper and wood products through diversion of forestry products into motor fuels and through export-reducing cost increases in motor fuels. Although there is very little real devaluation (Finland’s GDP deflator falls by only 0.02 per cent), Finland’s real imports fall by 2.83 per cent, reflecting the reduction in economic activity and the import intensity of Finland’s motor fuels industry. A 2.83 per cent reduction in imports, together with the direct negative export effects, is sufficient to generate the required decrease in X-M, with almost no real exchange rate movement.
5.3. Industry effects at the national level
Table 10 shows the effects in 2030 of the Nordic greenhouse policies on industry outputs at the national level. For some industries, the results in Table 10 stem directly from special treatments in the formulation of the policy shocks. For other industries, the results come mainly via macro effects.
Table 10. Effects on industry* output (%) in 2030 of greenhouse policies in Nordic countries
Denmark | Finland | Iceland | Norway | Sweden | |
1 Crops | 0.77 | -3.65 | -3.86 | 1.21 | -6.12 |
2 Livestock | 0.42 | -0.34 | -1.34 | 0.58 | -0.25 |
3 ForestryLogs | 8.30 | 27.29 | 0.48 | 96.02 | 61.55 |
4 FishingAqua | NA | -0.55 | -1.92 | 1.24 | -5.02 |
5 Coal | -78.87 | -58.02 | NA | -14.19 | -11.92 |
6 Oil | -33.60 | -26.87 | NA | -20.81 | NA |
7 Gas | 9.05 | 14.14 | NA | 10.23 | NA |
8 OthMining | 1.68 | -1.81 | 1.29 | 0.93 | -1.23 |
9 FoodBevTob | 0.31 | -0.52 | -0.97 | 0.53 | -0.59 |
10 Textiles | 1.32 | -0.93 | 0.87 | 1.70 | -3.93 |
11 Apparel | 0.49 | -0.22 | -0.62 | 1.20 | -3.85 |
12 LeatherPrd | 0.45 | -0.39 | -0.08 | 0.54 | -4.11 |
13 WoodProds | 4.10 | -4.79 | 0.82 | -1.13 | -6.63 |
14 PaperProds | 2.40 | -3.35 | 0.33 | 0.83 | -5.27 |
15 PetrolCoalP | -5.51 | -22.26 | NA | -17.11 | -37.58 |
16 ChemicalProds. | 17.18 | -7.83 | 6.69 | -0.25 | -15.90 |
17 Pharmaceutical | 2.14 | -1.41 | -1.15 | -0.32 | -1.05 |
18 RubberPlas | 3.11 | -0.10 | 0.75 | 0.54 | -0.85 |
19 NonMetMinProds | 1.76 | 0.06 | 1.12 | -0.23 | -1.88 |
20 FeMetals | 6.91 | 0.58 | 2.50 | 4.33 | -2.71 |
21 NonFeMetals | 2.61 | -1.22 | 4.13 | 3.04 | -0.24 |
22 FabriMetals | 1.27 | 0.07 | -0.19 | 2.48 | 0.39 |
23 Computer & optics | 0.80 | 0.21 | -0.28 | 0.74 | 0.99 |
24 ElectricEqp | 2.00 | 1.59 | 3.09 | 3.90 | 1.36 |
25 MachineNEC | 0.80 | 0.43 | -0.53 | 1.23 | 0.54 |
26 MotorVehicle | 0.52 | 0.42 | -0.74 | 0.79 | 0.54 |
27 OthTransEqp | 1.11 | 1.30 | -0.69 | 1.79 | -0.05 |
28 FurnitRepair | 0.59 | -0.58 | -0.56 | 0.14 | -0.09 |
29 ElecCoal | -88.72 | -87.90 | NA | NA | NA |
30 ElecGas | 65.51 | 4.42 | NA | 12.04 | -18.48 |
31 ElecOther | 102.94 | -38.50 | NA | 18.32 | -24.82 |
32 ElecHydro | NA | 15.82 | 1.98 | 4.19 | 4.31 |
33 ElecNuc | NA | 14.83 | NA | NA | 3.12 |
34 ElecDist | 2.73 | 0.69 | 1.98 | 3.39 | 0.69 |
35 GasSupDist | 1.17 | NA | NA | 4.99 | -3.62 |
36 Water | -0.03 | -0.73 | -0.14 | -0.09 | -0.66 |
37 Construction | 0.16 | -0.23 | 0.01 | 0.22 | -0.18 |
38 Wholesale & retail | 0.50 | -0.49 | -0.13 | 0.18 | -0.63 |
39 AccomFood | -1.06 | -0.49 | -0.31 | -0.35 | -0.58 |
40 LandTransprt | 0.96 | -0.67 | -0.32 | 0.25 | -1.08 |
41 WaterTrnsprt | -0.80 | -3.16 | 0.75 | -0.78 | -6.09 |
42 AirTransport | 0.38 | -0.08 | -0.11 | -0.25 | -0.28 |
43 Warehousing | 0.52 | -0.59 | 0.16 | 0.42 | -0.95 |
44 Communication | 0.17 | -0.27 | -0.12 | 0.44 | -0.13 |
45 Finance | 0.42 | -0.12 | -0.17 | 0.24 | -0.01 |
46 InsurPension | 0.85 | -0.06 | -0.38 | 0.52 | 0.35 |
47 RentLease | -0.21 | -0.53 | -0.04 | 0.25 | -0.49 |
48 OthBusSrv | 0.43 | -0.08 | -0.06 | 0.62 | 0.16 |
49 Recreation & pers. serv. | -0.36 | -0.35 | 0.00 | 0.19 | -0.52 |
50 PubAdm & defence | -1.14 | -1.16 | -0.49 | -0.73 | -1.31 |
51 Education | -0.49 | -0.72 | -0.31 | -0.36 | -0.79 |
52 Health & social serv. | -1.28 | -1.07 | -0.47 | -0.71 | -1.22 |
53 Services of dwellings | -1.23 | -1.37 | -0.41 | -0.12 | -1.33 |
Absorption of electricity** | 0.55 | 0.78 | 1.98 | 3.27 | 0.68 |
NA: Not applicable because output is negligible
* The industries in Nordic-TERM are based on those used in the GTAP model, defined in https://www.gtap.agecon.purdue.edu/databases/contribute/detailedsector57.asp . However, we have performed a few aggregations. For example, our industry 1, Crops, is an aggregation of the first eight GTAP industries. We have also broken down the GTAP electricity generation industry into 5 generating industries (our industries 29-34). See Appendix 1 for further details.
** This is the use of electricity: output plus import less exports.
In this subsection, we provide explanations for a selection of industries. These explanations are divided into two sections. First, we address industries for which the results are directly related to the greenhouse policy shocks. Then we address a group of industries for which the results derive mainly from changes in the macro economy.
5.3.1. Industries with special treatments in the shocks representing Nordic climate policies
Crops (Row 1, Table 10)
This industry is stimulated in Denmark as an input for the production of motor fuels. The negative results for Finland, Sweden, and Iceland are caused by loss of international competitiveness related to increased costs of petroleum products that are used intensively as an input for crop production. Crop production in Norway gains from using relatively little petroleum products and having relatively high inputs of primary factors, particularly capital. As explained in the discussion below of Oil, capital in Norway becomes relatively cheap.
Forestry & logging (Row 3, Table 10)
This industry is strongly stimulated in Finland, Sweden, and Norway due to its use as an input for the production of motor fuels. We also assume that forestry and logging provide the bio input for motor fuels in Iceland. That is unimportant because Iceland does not produce significant amounts of motor fuels. Forestry and logging are stimulated in Denmark by trade effects.
Coal (Row 5, Table 10)
Output of this industry is sharply reduced in Finland, where our database shows coal is used as an input to ElecCoal. However, coal production is very small in Finland, where this industry mostly consists of peat production.
Oil (Row 6, Table 10)
Production is reduced in all producing countries through reduced demand for the production of motor fuels. This is significant in Norway. Under our assumption that greenhouse policies barely affect aggregate capital for each country at the start of 2030, the contraction of Norway’s oil industry (a capital-intensive industry) releases considerably more capital than labour to be absorbed by other industries in Norway. That leads to a small reduction in the cost of using capital relative to the cost of using labour. As we will see, this has some minor implications for other industries.
Gas (Row 7, Table 10)
Production is stimulated in Denmark, Finland, and Norway via stimulation of ElecGas, see discussion of industries 29 to 33, Table 10.
Wood products (Row 13, Table 10)
This industry contracts in Finland, Sweden, and Norway due to cost increases caused by the diversion of raw materials (forestry and logging) into motor fuels. In Denmark, the industry gains a competitive advantage and expands.
Petroleum & coal products (Row 15, Table 10)
Production is reduced in all Nordic countries due to adoption of electric cars.
Electrical equipment (Row 24, Table 10)
Production is increased in all Nordic countries due to adoption of electric cars.
Electricity-generating industries (Rows 29 to 33, Table 10)
In Denmark, ElecCoal is phased out and replaced by ElecGas and ElecOther. ElecOther is a heterogeneous collection that includes solar, wind, and oil-based capacity. ElectricHydro and ElectricNuc do not operate in Denmark.
In Finland, ElecCoal is replaced mainly by ElecNuc. There are also minor contributions from ElecHydro and ElecGas. In Finland, ElecOther is small and dominated by oil-based generation capacity. Output of ElecOther contracts because the increase in the price of petroleum product inputs makes it uncompetitive.
Sweden does not have ElecCoal. Nevertheless, the adoption of greenhouse policies causes a reorganisation of its generation capacity. ElecHydro and ElecNuc expand while the fossil-based ElecGas and ElecOther contract.
Like Sweden, Norway has no ElecCoal. Norway relies heavily on ElecHydro, with minor contributions from ElecGas and ElecOther. Both ElecGas and ElecOther (which does not have a significant oil input) become cheap in Norway relative to the comparable products in the other Nordic countries. That enables Norway to expand its exports, which were already significant in 2019.
Iceland relies entirely on ElecHydro (including geothermal). Expansion of output must match expansion in Iceland’s absorption of electricity.
As shown in the last row of Table 10, absorption of electricity increases in all the Nordic countries, reflecting the increased use of electric vehicles.
5.3.2. Industries for which macro and trade effects dominate
Chemical products (Row 16, Table 10)
This is a trade-exposed industry with considerable exports from all Nordic countries. In Denmark and Iceland, the industry benefits from real devaluation. In Finland, Sweden, and Norway, the benefits of real devaluation are offset by increases in the price of petroleum and coal products. The chemical products industry in Finland, Sweden, and Norway is much more intensive in its use of petroleum and coal products than in Denmark and Iceland.
Other trade-exposed manufacturing industries (Rows 9 to 28, Table 10, excluding 15 & 16)
Table 10 shows 90 results for these industries, i.e. from 18 industries in five Nordic countries. 36 of these results are negative and 54 are positive.
The industries in this group are heavily trade exposed, with high export shares in their national outputs and high import shares in their domestic markets. They benefit from real devaluation in both their ability to export and compete with imports. On the other hand, they are harmed by contraction in private and public consumption, not only in their own countries but also in their trading partners.
The largest real devaluation caused by the Nordic greenhouse policies is in Denmark, where real devaluation is dominant (see row 11 in Table 8), and all the industries in this group of 18 show a positive result in Table 10. In the case of Finland, Sweden and Norway, real devaluation is moderate, leaving a mixture of positive and negative results for these 18 tradeexposed industries.
In Iceland’s case, real devaluation measured by the reduction in the price deflator for GDP is almost as great as for Denmark (0.59 per cent compared with 0.81 per cent, row 11 in Table 8). Yet, for Iceland, ten of the 18 industries in this trade-exposed group exhibit negative output deviations. The explanation is that some of Iceland’s export industries, such as non-ferrous metals, are heavily dependent on imported inputs. That limits the ability of real devaluation to stimulate exports and improve the trade balance. It is also true that a major export for Iceland is food (including marine products) to the Nordic countries and the rest of Europe. The reduction in private consumption in these countries inhibits Iceland’s exports.
Public-sector and private-sector service industries (Row 38 to 53, Table 10)
In most cases, these industries show small negative deviations, arising from the contractions in real private and public consumption. However, there are a number of exceptions.
For example, industries 43 to 48 in Norway have small positive output deviations. All of these industries have non-negligible export sales, typically of 5 to 10 per cent. The competitiveness of these industries in Norway is enhanced relative to competitors in other Nordic countries, leading to export expansion and Norway’s small positive output deviations. The competitiveness effect for these industries in Norway arises from the reduction in the cost of using capital relative to the cost of using labour as explained in our discussion of industry 6, Oil. According to our database, industries 43 to 48 in Norway are considerably more capital-intensive than the corresponding industries in the other Nordic countries and gain a significant cost advantage from Norway’s reduction in the cost of using capital.
5.4. Labour market effects
In this subsection, we set out results for employment in the Nordic countries classified by industry, occupation, wage band, education requirement, age, and subnational region.
Industry employment results are generated directly using Nordic-TERM at the subnational regional level and then aggregating to the national level. Employment results follow predictably from industry output results such as those described at the national level in subsection 5.3. The occupational results are derived directly from the industry employment results under the assumption that the Nordic greenhouse policies do not affect the occupational composition of employment in each industry. The results for employment classified by wage band, education, and age are generated under the assumption that greenhouse policies do not affect the wage band, required educational level, and age composition for employment in each occupation. Details of the theory and data used in generating labour-market effects are provided in Appendix 4.
Given that occupations are spread across industries, the variation in greenhouse-related percentage deviations across occupations is damped relative to the employment variations across industries. Similarly, employment deviations by wage band, education, and age are evened out by their spread across occupations.
5.4.1. Employment by industry
Table 11 shows greenhouse-related deviations in employment by industry for the Nordic countries. In most cases, the employment deviation in Table 11 is similar to the output deviation in Table 10, but there are a number of exceptions.
Table 11. Effects on industry employment (%) in 2030 of greenhouse policies in Nordic countries
Denmark | Finland | Iceland | Norway | Sweden | |
1 Crops | 0.85 | -3.80 | -4.38 | 1.31 | -6.28 |
2 Livestock | 0.43 | 0.02 | -1.52 | 0.57 | 0.18 |
3 ForestryLogs | 9.51 | 32.72 | 0.63 | 121.70 | 74.94 |
4 FishingAqua | -0.86 | 0.13 | -3.37 | 2.11 | -7.94 |
5 Coal | NA | -74.26 | NA | -31.10 | -23.06 |
6 Oil | -33.53 | -26.21 | NA | -20.77 | NA |
7 Gas | 14.45 | 36.93 | NA | 16.24 | NA |
8 OthMining | 1.87 | -1.36 | 1.57 | 1.06 | -0.46 |
9 FoodBevTob | 0.26 | -0.02 | -0.82 | 0.40 | -0.04 |
10 Textiles | 1.27 | -0.55 | 0.98 | 1.59 | -3.49 |
11 Apparel | 0.45 | 0.23 | -0.45 | 1.03 | -3.31 |
12 LeatherProds | 0.42 | 0.09 | 0.03 | 0.37 | -4.04 |
13 WoodProds. | 4.06 | -4.44 | 0.89 | -1.23 | -6.11 |
14 PaperProds. | 2.35 | -2.83 | 0.49 | 0.72 | -4.69 |
15 PetrolCoalP | 5.70 | 70.23 | NA | 3.51 | 118.24 |
16 ChemicalProds | 17.08 | -7.16 | 6.84 | -0.46 | -15.13 |
17 Pharmaceutical | 2.07 | -0.58 | -0.99 | -0.57 | -0.06 |
18 RubberPlas | 3.05 | 0.34 | 0.86 | 0.43 | -0.25 |
19 NonMetMinProds | 1.72 | 0.46 | 1.18 | -0.35 | -1.38 |
20 FeMetals | 6.88 | 0.93 | 2.60 | 4.19 | -2.20 |
21 NonFeMetals | 2.58 | -0.59 | 4.25 | 2.89 | 0.26 |
22 FabriMetals | 1.23 | 0.42 | -0.14 | 2.39 | 0.86 |
23 Computer & optics | 0.75 | 0.80 | -0.20 | 0.59 | 1.70 |
24 ElectricEqp | 1.95 | 2.11 | 3.19 | 3.77 | 1.98 |
25 MachineNEC | 0.75 | 0.90 | -0.43 | 1.12 | 1.13 |
26 MotorVehicle | 0.46 | 0.78 | -0.64 | 0.69 | 1.18 |
27 OthTransEqp | 1.07 | 1.58 | -0.66 | 1.75 | 0.61 |
28 FurnitRepair | 0.55 | -0.08 | -0.45 | 0.05 | 0.49 |
29 ElecCoal | -85.82 | -81.36 | NA | NA | NA |
30 ElecGas | 65.38 | 5.42 | NA | 11.83 | -17.67 |
31 ElecOther | 103.34 | 9.96 | NA | 18.03 | 19.06 |
32 ElecHydro | NA | 16.73 | 2.11 | 3.99 | 5.29 |
33 ElecNuc | NA | 15.85 | NA | NA | 4.24 |
34 ElecDist | 2.61 | 1.53 | 2.12 | 3.13 | 1.65 |
35 GasSupDist | 1.03 | NA | NA | 4.74 | -2.82 |
36 Water | -0.08 | -0.39 | -0.07 | -0.19 | -0.32 |
37 Construction | 0.13 | 0.13 | 0.06 | 0.10 | 0.26 |
38 Wholesale & retail | 0.46 | -0.04 | -0.03 | 0.09 | -0.13 |
39 AccomFood | -1.10 | -0.15 | -0.23 | -0.41 | -0.21 |
40 LandTransprt | 0.92 | -0.29 | -0.26 | 0.10 | -0.54 |
41 WaterTrnsprt | -0.88 | -2.73 | 0.78 | -0.92 | -5.66 |
42 AirTransport | 0.34 | 0.51 | 0.03 | -0.31 | 0.2 |
43 Warehousing | 0.46 | -0.03 | 0.25 | 0.24 | -0.19 |
44 Communication | 0.12 | 0.30 | 0.02 | 0.28 | 0.51 |
45 Finance | 0.36 | 0.26 | -0.04 | 0.00 | 0.57 |
46 InsurPension | 0.83 | 0.53 | -0.25 | 0.34 | 1.07 |
47 RentLease | -0.32 | 0.29 | 0.14 | 0.02 | 0.43 |
48 OthBusSrv | 0.38 | 0.35 | 0.06 | 0.50 | 0.64 |
49 Recreation & pers. serv. | -0.42 | 0.10 | 0.09 | 0.05 | 0.03 |
50 PubAdm & defence | -1.17 | -0.86 | -0.44 | -0.83 | -1.01 |
51 Education | -0.51 | -0.57 | -0.28 | -0.41 | -0.65 |
52 Health & social serv | -1.30 | -0.92 | -0.44 | -0.75 | -1.08 |
53 Services of dwellings | -1.36 | -0.26 | -0.22 | -0.42 | -0.13 |
Output of petroleum and coal products (industry 15, Table 10) falls sharply in all countries, but employment rises (industry 15, Table 11). That follows from the ‘technological deterioration’ that we introduced to account for the cost increase in motor fuels caused by the switch towards biodiesel. This switch means that more inputs of labour are required in the petroleum and coal products industry per unit of output.
Employment per unit of output for coal and gas (industries 5 and 7) is affected by the presence of a fixed factor (natural resource). With a fixed factor, a given percentage reduction in output requires a greater percentage reduction in employment. That can be seen in the coal results for Finland and Norway. In Finland, coal (including peat) output falls by 58.02 per cent and coal employment falls by 74.26 per cent. In Norway, the reductions in coal output and employment are 14.19 and 31.10 per cent. For gas (industry 7), there are increases in output in all producing countries. With a fixed factor, the percentage increases in employment exceed those in output. In our model, oil (industry 6) also has a fixed factor. However, in this industry the output and employment results in Table 10 and Table 11 stay in line. That is because we assumed that the Nordic countries treat their oil reserves as though they are supplied elastically at a price which is independent of Nordic greenhouse policies. Thus, rather than adjust the price of their product in response to changes in demand, they adjust supply, allowing world prices of oil to guide their own prices.
A striking disconnect occurs between the employment and output results for ElecOther (industry 31) in Finland and Sweden. In both cases, output contracts but employment increases. We traced these unexpected results to the effects of aggregation across NUTS2 regions within Finland and Sweden. At the NUTS2 regional level, employment closely follows output. However, in both countries there is a sharp decline in the output of ElecOther in regions in which this industry is predominantly oil-based, while at the same time providing very little employment. In other regions, ElecOther is not oil-based, is relatively labour intensive, and expands. With regard to output, the contraction of the oil-based part of the industry dominates. With regard to employment, the expansion of the non-oil-based part dominates. However, this does not take into consideration the possibility that the oil-dependent fraction of the ElecOther segment can adapt to fossil-free technologies in order to retain output.
5.4.2. Employment by occupation
Table 12 shows the policy-induced deviations in employment by occupation in 2030 in the Nordic countries.
Table 12. Total growth in employment (%) between 2019 and 2030 by selected occupation
Percentage deviations, 2030 | Denmark | Finland | Iceland | Norway | Sweden |
4 Hospitality & retail manager | 0.2 | -0.2 | 0.0 | 0.0 | 0.0 |
5 Scient. & engineer professional | 0.2 | 0.2 | 0.3 | 0.1 | 0.3 |
6 Health professional | -1.0 | -0.8 | -0.4 | -0.7 | -0.9 |
19 Other clerk | 0.2 | 0.0 | 0.0 | 0.0 | 0.2 |
22 Personal care worker | -1.1 | -0.8 | -0.4 | -0.7 | -0.9 |
27 Metal machine trade | 1.1 | 0.4 | 0.6 | 0.7 | 0.3 |
28 Handicraft & printing | 1.6 | -1.9 | 0.1 | 0.4 | -2.6 |
29 Electrical trade | 0.3 | 0.5 | 0.6 | 0.3 | 0.3 |
34 Cleaners & helpers | -0.1 | 0.1 | -0.2 | 0.1 | 0.1 |
35 Agric., forest, fishing labourer | 0.8 | 9.2 | -1.3 | 7.2 | 25.9 |
37 Food prep assistant | -0.7 | -0.2 | 0.2 | -0.3 | -0.2 |
Table 12 shows that the adoption of greenhouse policies has negative employment effects on consumption-oriented occupations such as Health professional and Personal care worker (occupations 6 and 22). As we saw in Table 11, employment falls in most consumption-oriented industries such as Health &social serv (industry 52).
For Handicraft & printing (occupation 28), there is a mixed picture in Table 12: positive for Denmark, Norway, and Iceland and negative for Finland and Sweden. The main employing industry for this occupation is PaperProds (industry 14). Paper products shows positive employment results for Denmark, Norway, and Iceland in Table 11, and negative results for Finland and Sweden.
The effects of greenhouse policies on employment in Scientific & engineering, Metal machine trade and Electrical trade occupations (occupations 5, 27 and 29) are positive in all Nordic countries. That reflects stimulation of employment opportunities in Electrical equipment (industry 24), Construction (industry 37), a variety of manufacturing industries, and motor fuels (it should be recalled that employment in motor fuels expands with the adoption of biodiesel). With the exception of Iceland, employment opportunities increase for Agricultural, forestry, and fishing labourers (occupation 35), reflecting the expansion of industries providing biomaterials for motor fuels.
5.4.3. Employment by wage band, age and education
Table 13 shows policy-induced deviations in employment by wage band in 2030. Wage bands refer to hourly wage rates in 2019: less than 25 Euro per hour; 25 to 40 Euro per hour etc. The deviation results are small and less than one per cent in all cases. They show no clear pattern. In Denmark and Iceland, the simulated greenhouse policies have small negative effects on employment in the lowest wage band and positive effects on employment in the other bands. In Sweden, the effects are slightly positive in lower wage bands and negative in high-wage bands. Finland and Norway paint a mixed picture. Overall, Table 13 indicates that greenhouse policies have a negligible impact on the distribution of jobs across wage bands.
Table 13. Total growth in employment (%) between 2019 and 2030 by wage band
Percentage deviations, 2030 | Denmark | Finland | Iceland | Norway | Sweden |
0_25 | -0.3 | 0.0 | -0.1 | 0.0 | 0.0 |
25_40 | 0.1 | 0.1 | 0.0 | -0.2 | 0.2 |
40_55 | 0.2 | -0.2 | 0.2 | 0.0 | 0.0 |
55_70 | 0.3 | 0.3 | 0.4 | 0.0 | 0.3 |
70_85 | 0.8 | -0.3 | 0.3 | -0.1 | 0.0 |
85_100 | 0.7 | -0.5 | 0.0 | -0.2 | 0.2 |
100_plus | 0.5 | 0.4 | 0.8 | -0.3 | -0.4 |
Table 14 and Table 15 show that greenhouse policies have a negligible impact on the distribution of jobs across age and required educational level.
Table 14. Total growth in employment (%) between 2019 and 2030 by age
Percentage deviations, 2030 | Denmark | Finland | Iceland | Norway | Sweden |
A14-19 | 0.0 | -0.1 | -0.1 | 0.0 | -0.1 |
A20-29 | -0.1 | 0.0 | -0.1 | -0.0 | 0.0 |
A30-39 | -0.1 | 0.0 | 0.0 | 0.0 | -0.1 |
A40-49 | 0.0 | 0.0 | 0.0 | 0.0 | 0.0 |
A50-59 | 0.1 | 0.0 | 0.0 | 0.1 | 0.0 |
A60- | -0.0 | 0.1 | 0.0 | 0.0 | 0.0 |
Table 15. Total growth in employment (%) between 2019 and 2030 by education level
Percentage deviations, 2030 | Denmark | Finland | Iceland | Norway | Sweden |
Basic | 0.3 | 0.0 | -0.1 | 0.0 | -0.2 |
Secondary | 0.1 | 0.2 | 0.1 | 0.3 | 0.3 |
Tertiary, 4 years | -0.2 | -0.2 | -0.1 | -0.3 | -0.3 |
Tertiary, greater than 4 years | -0.2 | -0.2 | -0.1 | -0.2 | -0.7 |
5.4.4. Employment by region
The first two rows for each Nordic country in Table 16 show growth in employment between 2019 and 2030 at the national level and by NUTS2 region for the baseline and policy runs. The policy-induced deviations in national and regional employment in 2030 are in the third row for each country. The deviations at the national level are zero: it should be recalled from Section 5.2 that we assume that greenhouse policies do not affect aggregate national employment in 2030.
All of the regional deviations are less than one per cent in absolute terms. The largest positive deviations are 0.37 per cent for Norra Mellansverige and 0.36 per cent for Sør-Østlandet. The largest negative deviation is -0.49 per cent for Vestlandet.
As further explained in Appendix 1 (Section 2.6), regional results can be analysed by decomposing them into industry mix and industry growth effects. A region scores a positive industry mix effect from greenhouse policies if it has relatively large shares of its employment in industries that benefit from these policies at the national level and relatively low shares of its employment in industries that contract at the national level. A region scores a positive industry growth effect from greenhouse policies if the percentage impacts on employment in its industries are more positive (or less negative) than the percentage impacts on employment in the corresponding industries at the national level.
The industry mix and industry growth effects generated by greenhouse policies are positive for Norra Mellansverige. With regard to the industry mix, this region benefits from having above-average shares of its employment in Forestry and logging (industry 3) and Petroleum and coal products (industry 15). The Nordic greenhouse policies generate large increases in employment in both of these industries (74.94 per cent and 118.24 per cent, Sweden column in Table 11). Wood products and Paper products (industries 13 and 14) have negative employment outcomes for Sweden in Table 11 (-6.11 per cent and -4.69 per cent). These negatives mainly reflect contraction of exports caused by cost increases resulting from the Forestry and logging industry. However, the Wood products and Paper products industries in Norra Mellansverige have low reliance on exports. They therefore suffer less from export contraction than these industries in Sweden as a whole, giving Norra Mellansverige a positive industry growth effect.
For Sør-Østlandet, both the industry mix and industry growth effects are positive. Sør-Østlandet benefits from having almost no Oil (industry 6) in its employment mix. Oil is a significant employer in Norway and, as can be seen from Table 11, employment in the industry at the national level falls sharply (-20.77 per cent). Sør-Østlandet also benefits from overrepresentation in its employment mix of Electrical equipment (industry 24). The region’s positive industry growth effect is explained mainly by relatively strong consumption demand for local products associated with its positive industry mix effect.
For Vestlandet, the story is similar to Sør-Østlandet but with the opposite sign. Oil is overrepresented in Vestlandet, giving the region a negative industry mix effect, which is reinforced by a negative industry growth effect associated with damped demand for local products.
Table 16. Total growth in employment (%) between 2019 and 2030 by NUTS2 region
Denmark | Hovedstaden | Sjælland | Syddanmark | Midtjylland | Nordjylland | ||||
base | -1.48 | -0.80 | -1.56 | -1.91 | -1.87 | -2.01 | |||
policy | -1.48 | -0.97 | -1.42 | -1.84 | -1.80 | -1.90 | |||
deviation | 0 | -0.17 | 0.14 | 0.07 | 0.07 | 0.11 | |||
Finland | Länsi-Suomi | Helsinki-Uusimaa | Etelä-Suomi | Pohjois- ja Itä-Suomi | Åland | ||||
base | -1.98 | -2.26 | -1.46 | -2.08 | -2.27 | -3.36 | |||
policy | -1.98 | -2.06 | -1.54 | -1.95 | -2.51 | -3.56 | |||
deviation | 0 | 0.20 | -0.08 | 0.13 | -0.25 | -0.20 | |||
Iceland | |||||||||
base | 2.20 | ||||||||
policy | 2.20 | ||||||||
deviation | 0 | ||||||||
Norway | Oslo og Akershus | Hedmark og Oppland | Sør-Østlandet | Agder og Rogaland | Vestlandet | Trøndelag | Nord-Norge | ||
base | 5.45 | 6.03 | 5.07 | 5.24 | 4.37 | 6.06 | 5.23 | 5.33 | |
policy | 5.45 | 6.23 | 5.28 | 5.62 | 4.14 | 5.53 | 5.29 | 5.10 | |
deviation | 0 | 0.19 | 0.18 | 0.36 | -0.22 | -0.49 | 0.05 | -0.22 | |
Sweden | Stockholm | Östra Mellansverige | Småland med öarna | Sydsverige | Västsverige | Norra Mellansverige | Mellersta Norrland | Övre Norrland | |
base | 2.72 | 2.80 | 2.50 | 1.96 | 2.32 | 4.02 | 2.17 | 1.63 | 1.80 |
policy | 2.72 | 3.00 | 2.46 | 2.14 | 2.28 | 3.64 | 2.55 | 1.53 | 1.66 |
deviation | 0 | 0.19 | -0.04 | 0.18 | -0.05 | -0.37 | 0.37 | -0.09 | -0.13 |
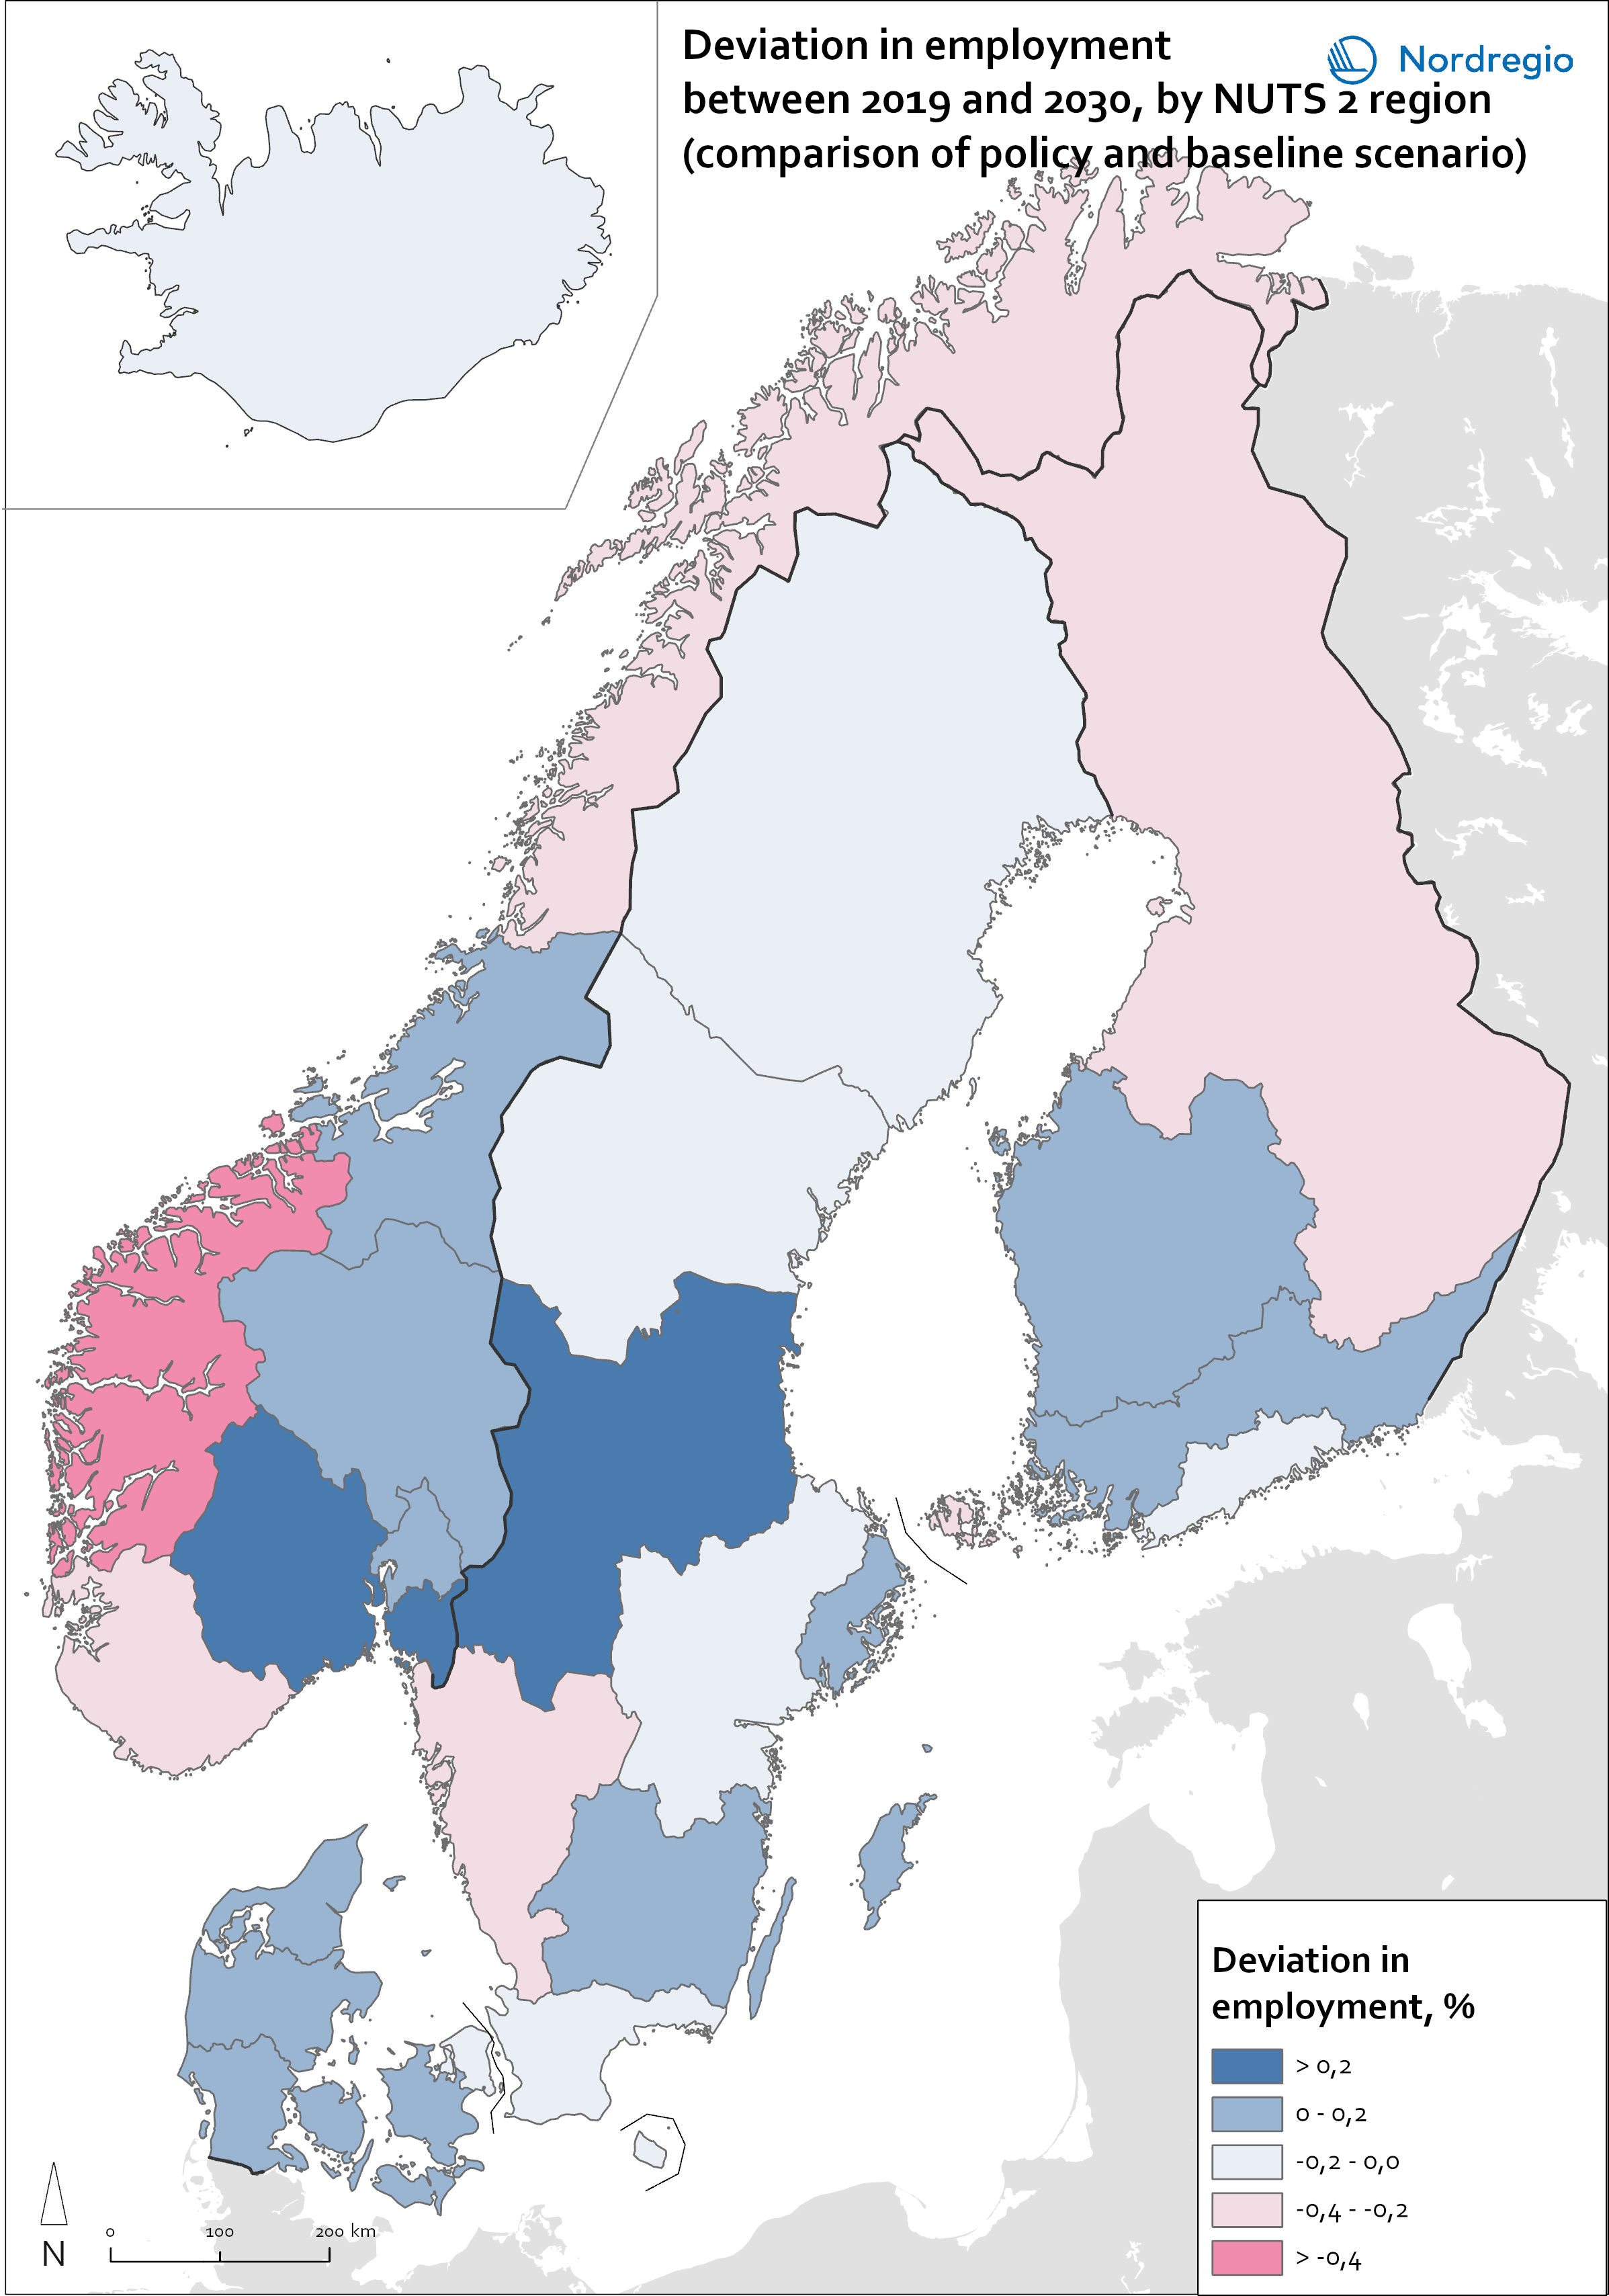
The baseline forecasts in Table 16 show variation in employment growth across regions in each Nordic country. For example, in Nordjylland baseline employment falls by 2.01 per cent between 2019 and 2030 whereas in Hovedstaden it falls by 0.80 per cent.
One question that we can answer from the information in Table 16 is whether greenhouse policies may help to even out regional differences in growth rates for employment or whether, on the contrary, there is a risk that climate policies may exacerbate the differences. Our simulations suggest mixed results with regard to the cohesion effects of climate policies. The example of Agder og Rogaland suggests exacerbation: This NUTS-2 region has the lowest baseline growth rate of all the Nordic NUTS2 regions in Norway (4.37 per cent) and a negative greenhouse-induced deviation (-0.22 per cent). However, exacerbation is not generally the case. Counting up the positives and negatives in Table 16 we find that over the 25 Nordic NUTS2 regions, there are only ten cases of exacerbation. Those are the cases in which the regional deviation in baseline employment growth from national employment has the same sign as the greenhouse-induced deviation. There are 15 cases of evening out. Those are the cases in which the regional deviation in baseline employment growth from national employment has the opposite sign to that of the greenhouse-induced deviation. Further research would be necessary to shed light on this matter.
5.5. Cost-of-living effects for various types of households
Table 17 and Figures 8 to 10 show cost-of-living effects in 2030 of Nordic greenhouse policies for households classified by location of residence (urban/intermediate/rural) and income decile. The effect for a particular household type is the percentage deviation in the cost of the household’s consumption bundle relative to the percentage deviation in the cost of the consumption bundle for the average household in the nation. In working out the average, we gave equal weight to each household type in the nation. The details of the theory and data underlying Table 17 are set out in Appendix 6. Results are given for only three of the Nordic countries because we found no suitable data for identifying expenditure by household type for Norway and Iceland.
The main price movement in our simulations is for motor fuels. For households in Denmark and Finland, the Nordic greenhouse policies that we simulate increase the price of motor fuels by about 11 per cent, while for Sweden the price increase is about 38 per cent.
These price increases are a little higher than those shown in column (9) of Table 3. These are the final price increases, taking account of increases in the prices of inputs such as crops and forestry products, whereas those in Table 3 are first-round effects.
Looking along the rows of Table 17, or moving from low deciles to high deciles in Figures 8 to 10, we see no clear patterns. In most of the nine graphs in Figures 8 to 10, there is little or nothing to suggest either an upward trend or a downward trend as we move from low deciles to high deciles. It appears that with regard to costs of living, the simulated greenhouse policies do not discriminate between income categories.
Table 17. Effects in 2030 of Nordic greenhouse policies on costs of living for households classified by location and income
Percentage deviations relative to national Consumer Price Index – CPI (D01 is the lowest decile, D10 is the highest decile)
Percentage deviations relative to national Consumer Price Index – CPI (D01 is the lowest decile, D10 is the highest decile)
Percentage deviations, 2030 | D01 | D02 | D03 | D04 | D05 | D06 | D07 | D08 | D09 | D10 |
Denmark | ||||||||||
Urban | -0.22 | -0.24 | -0.17 | -0.08 | -0.09 | -0.15 | -0.07 | -0.08 | -0.17 | -0.21 |
Intermediate | -0.15 | -0.14 | -0.10 | 0.02 | 0.00 | 0.08 | 0.00 | 0.06 | 0.03 | 0.07 |
Rural | 0.07 | 0.03 | 0.21 | 0.07 | 0.15 | 0.28 | 0.26 | 0.11 | 0.18 | 0.21 |
Finland | ||||||||||
Urban | -0.18 | -0.19 | -0.11 | -0.16 | -0.10 | -0.10 | -0.16 | -0.14 | -0.11 | -0.17 |
Inter-mediate | -0.05 | -0.03 | -0.04 | 0.06 | 0.02 | 0.16 | 0.02 | 0.09 | -0.04 | -0.05 |
Rural | 0.01 | 0.12 | 0.11 | 0.14 | 0.15 | 0.15 | 0.18 | 0.18 | 0.17 | 0.05 |
Sweden | ||||||||||
Urban | -0.72 | -0.88 | -0.72 | -0.43 | -0.53 | -0.09 | -0.02 | -0.44 | -0.17 | -0.50 |
Inter-mediate | -0.88 | -0.42 | -0.17 | 0.04 | 0.59 | 0.18 | 0.29 | 0.20 | 0.39 | -0.28 |
Rural | -0.08 | 0.34 | 0.34 | 0.32 | 0.60 | 0.73 | 0.62 | 1.09 | 0.48 | 0.12 |
Table 18. Baseline percentages in 2030 of household expenditures devoted to motor fuels
Households classified by location and income decile (D01 is the lowest decile, D10 is the highest decile)
Households classified by location and income decile (D01 is the lowest decile, D10 is the highest decile)
Percentage deviations, 2030 | D01 | D02 | D03 | D04 | D05 | D06 | D07 | D08 | D09 | D10 |
Denmark | ||||||||||
Urban | 0.55 | 0.77 | 1.35 | 2.33 | 2.12 | 1.77 | 2.47 | 2.59 | 1.74 | 1.62 |
Intermediate | 1.56 | 1.55 | 1.89 | 3.15 | 2.92 | 3.54 | 2.93 | 3.36 | 3.17 | 3.65 |
Rural | 3.11 | 2.83 | 4.42 | 3.21 | 4.01 | 5.11 | 4.75 | 3.70 | 4.15 | 4.46 |
Finland | ||||||||||
Urban | 1.28 | 1.33 | 1.90 | 2.06 | 2.23 | 2.39 | 2.07 | 2.43 | 2.54 | 2.11 |
Inter-mediate | 2.85 | 3.01 | 2.92 | 3.78 | 3.62 | 4.58 | 3.74 | 4.27 | 3.45 | 3.25 |
Rural | 3.19 | 4.07 | 3.94 | 4.50 | 4.60 | 4.69 | 4.95 | 5.12 | 4.84 | 4.16 |
Sweden | ||||||||||
Urban | 2.21 | 1.77 | 2.42 | 3.22 | 2.91 | 4.08 | 4.39 | 3.20 | 3.90 | 2.96 |
Inter-mediate | 1.71 | 3.17 | 3.94 | 4.61 | 6.28 | 5.00 | 5.37 | 5.04 | 5.74 | 3.74 |
Rural | 4.17 | 5.47 | 5.32 | 5.37 | 6.26 | 6.79 | 6.46 | 7.85 | 6.04 | 4.98 |
The lack of a clear pattern in the movement of the cost-of-living results as we move between deciles is explained by the lack of a clear pattern in Table 18 in the movement of the motor fuel expenditure shares as we move between deciles.
Overall, our cost-of-living results reveal disadvantage to rural households relative to urban households, but neither progressive nor regressive effects. However, the most important feature of the results is that they are very small. That was to be expected. For Denmark and Finland, they reflect a 11 per cent increase in an item accounting for between 0.55 and 5.12 per cent of household budgets. For Sweden, the cost-of-living effects are more significant: a 38 per cent increase in an item accounting for between 1.71 and 7.85 per cent of household budgets. Nevertheless, even for Sweden the results indicate that our simulated greenhouse policies are unlikely to cause major relative cost-of-living disadvantage to any broadly identified group of households.
Figure 8. Cost-of-living effects (%) from Table 17: DENMARK
■ Rural
■ Intermediate
■ Urban
Figure 9. Cost-of-living effects (%) from Table 17: FINLAND
■ Rural
■ Intermediate
■ Urban
Figure 10. Cost-of-living effects (%) from Table 18: SWEDEN
■ Rural
■ Intermediate
■ Urban