3. Examining territorial and settlement patterns and population change dynamics across the urban–rural continuum
In this part of the report, the Nordic urban–rural typology is used as an analytical framework for studying territorial and settlement patterns and population change dynamics in the five Nordic countries. As the typology is grid-based and relies on spatially detailed data at the 1 × 1 km grid level, it can be used to analyse territorial differences independently of administrative boundaries. This means that it is possible to uncover more fine-grained differences and nuances within regions and municipalities that cannot be detected at more general levels of analysis.
In Section 3.1, a comparative cross-country examination of different urban and rural territories in the Nordic countries is carried out using the urban–rural typology as an analytical framework. Then, in Section 3.2, the Nordic typology is used in combination with the European-wide DEGURBA for studying territorial and settlement patterns within different types of Nordic municipalities. The following key questions are addressed in this analysis section:
- What do territorial and settlement patterns look like in the Nordic countries when examined according to the grid-level Nordic urban–rural typology?
- What types of population change dynamics occurred in the Nordic countries in the period 2008–2022 based on the Nordic urban–rural typology?
- What kind of internal differences in territorial and settlement patterns can be seen within different types of Nordic municipalities?
3.1 Urban–rural differences according to the Nordic urban–rural typology
The purpose of this section is to provide an outlook on urban–rural differences using the Nordic typology as the basis for analysis. The focus is first, however, on the DEGURBA classification which is used to provide a general picture of what urban–rural differences in the Nordic countries look like according to this Eurostat territorial typology. This is followed by a cross-country analysis of what urban–rural differences look like based on the grid-based Nordic typology in the five Nordic countries and in Åland. The focus is on what kind of key territorial and settlement patterns (as well as population changes) can be observed over time in the different territorial classes. At the end of section 3.1 the grid-based Nordic typology is scaled up to the municipality level to demonstrate how this classification can be aggregated to more general territorial levels and used to complement more general statistics at the municipality level.
DEGURBA classification of Nordic municipalities
The DEGURBA classification is the most established and widely used territorial typology for cross-country comparisons (see also Section 2.1). In addition, most previous studies conducted at Nordregio that have examined urban–rural differences across the Nordic countries have used this Eurostat classification. The most common version of DEGURBA is at municipality level and it classifies municipalities as either urban, intermediate, or rural2. Based on this classification, the most common municipality class in all five Nordic countries is rural. This is the case especially in Iceland, Finland and Åland, and Norway where nearly 86%, 80%, and 78% of municipalities, respectively, are categorized as rural according to the DEGURBA classification (Figure 14). This can also be seen in Figure 13, where the map on the left-hand side shows that these three countries along with the northern parts of Sweden stand out as areas that are predominantly characterized by rural municipalities. The intermediate category represents areas that are in between urban and rural areas in terms of population density; it is the most common municipality type in Sweden and Denmark (with approximately 42% and 35% of municipalities, respectively). There are considerably fewer such municipalities in Norway (20%), Finland (17%), and Iceland (10%).
It is noteworthy that municipalities that are defined as urban (according to this Eurostat classification) are rather uncommon in the Nordics, having a significant number of urban municipalities only in Denmark and Sweden (18% and 8% of all municipalities, respectively), while only 4% of municipalities in Iceland, 3% in Finland and Åland, and 2% in Norway belong to this category. Overall, based on the DEGURBA classification, the Nordic countries are largely characterised by rural municipalities, which are often vast in size and cover large parts of the territory (see Figure 13).
Figure 14. The number of municipalities in the different DEGURBA classes in the Nordic countries. The figure shows the situation in 2020, which is the most recent year for which data connected to the DEGURBA classification were available at the time of writing.
2 There have been initiatives to create a more fine-grained territorial typology at a pan-European level and, in 2018, DG REGIO published a refined version of the DEGURBA at grid level (DEGURBA level 2) consisting of six classes. (cities, towns, suburbs, villages, dispersed rural areas, mostly uninhabited areas), to better capture territorial differences (EEA, 2018).
A general outlook on territorial and settlement patterns
A different outlook on urban–rural differences within the Nordic countries can be observed when examined according to the Nordic urban–rural typology. As previously described, this typology has been constructed such that all 1 × 1 km grid cells in each of the five Nordic countries (including Åland) have been classified into one of seven typology classes (inner urban areas, outer urban areas, peri-urban areas, local centres in rural areas, rural areas close to urban areas, rural heartland areas, sparsely populated rural areas) based on the specific characteristics of each grid cell. This means that the Nordic typology is more spatially detailed than the previously discussed Eurostat DEGURBA classification; the latter classifies municipalities, which are noticeably larger spatial units, into one of three categories. The focus in the following is on what territorial and settlement patterns look like in the Nordic countries when using population data at grid level and examined through the lens of the Nordic urban–rural typology.

The population grid map (Figure 15) shows the population density at 1 × 1 km grid level and illustrates that the settlements of the Nordic countries are rather unevenly distributed. The Nordic population is to a high degree concentrated in coastal areas and along waterways, which contain the major urban regions in all five countries. Current settlement patterns seem to reflect historical patterns that have been determined by the physical geography, including the availability of arable agricultural land and access to waterways (see e.g., Roto, 2012; Smas 2018).
The map shows a highly concentrated settlement, especially in Iceland, where the population live largely in the south-western part of the country around the Reykjavík capital region, while the inner parts of the country are mainly uninhabited. In Norway, the main population concentrations are around the Oslo capital region and along the south-western coast. In Sweden, the population is largely concentrated in the southern parts of the country while the northern parts include many sparsely populated and uninhabited areas. The city regions around Stockholm and Gothenburg are the most densely populated areas in Sweden, and these two regions are connected by a corridor of comparatively high population density. The south-western coast of Sweden, extending from around Oslo to greater Copenhagen, also stands out as a densely populated settlement corridor. The Finnish population is primarily concentrated in the south, mostly in the triangle connecting the urban regions of Helsinki, Tampere, and Turku. The map also shows some clear differences between the Nordic countries. For example, there are comparatively more areas that are entirely uninhabited in Norway and Sweden than in Finland. By contrast, there are noticeably more very sparsely populated areas in Finland than in Norway and Sweden. This observation reflects the physical geography of the countries where many parts of Norway and north-western Sweden have vast mountainous areas that are largely uninhabited. Denmark shows a substantially higher population density than in the other countries; however, in common with the other countries, the population is largely concentrated around the major urban centres, particularly Copenhagen, Aarhus, and Aalborg.
When examining territorial differences based on the proportion of grid cells that belong to the different typology classes in each country, there are certain key differences between the countries that can be seen in Figure 16. First, when considering the different rural typology classes, Iceland stands out as the country where the proportion of sparsely populated rural areas is clearly the highest. The sparsest areas in the Nordic countries belong to this category, which includes small settlements that are located far from each other, and the land cover in this typology class mainly consists of forests, mountains, or natural grasslands. In Iceland, approximately 79% of all grid cells were categorized into this typology class, while Norway and Finland and Åland have comparatively high proportions of sparsely populated rural areas (39% and 37% of all grid cells, respectively). By contrast, the picture is clearly different in Denmark where the sparsely populated rural areas category is almost non-existent; only 1% of all grid cells belong to this category. Characteristic of both Denmark and Sweden is that most rural areas belong to the class rural area close to urban, which is the most common typology class in both countries. The previously mentioned typology class includes areas that have a rural character but that are functionally connected and located near urban areas, at approximately a 20–30-minute driving distance from the edge of outer urban areas. Also, in Denmark, the class peri-urban area (intermediate areas along the urban fringes between urban and rural areas) is more common than in the other countries. Regarding the urban typology classes, it is noteworthy that inner urban areas account for an approximately similar and low proportion of the land area in all countries. In each of the five countries, only 1–2% of all areas belong to this category. Also, grid cells that are classified as outer urban areas only accounted for approximately 1–4% of the territory in all five countries. In summary, while there are certain key differences between the proportions of the seven different typology classes and several country-specific differences, it is noteworthy that urban areas (inner urban areas and outer urban areas) only constitute a rather small proportion of the land area in all the Nordic countries. This means that the Nordic countries are predominantly rural when considering how their land areas are classified in the Nordic typology. The four rural typology classes constitute the lowest share of the land area in Denmark (67%) and the highest in Iceland (94%).
Figure 16. The proportion of the land area in the Nordic countries that belongs to the different Nordic typology classes.
When examining settlement patterns according to the Nordic urban–rural typology, a significantly different picture can be seen (Figure 17) as compared to the previous visualisation. While Figure 16 shows that there are substantial differences between the countries in terms of the proportion of the land area that belongs to the different typology classes, differences between the countries are less noticeable when comparing which typology classes the population in the different countries live.
Figure 17 shows that most of the population in all the Nordic countries live in one of the two urban classes (inner urban or outer urban). Among the Nordic countries, the proportion of the population that live in both urban classes is highest in Iceland (66%) and lowest in Norway (53%). Both typology classes are part of a so-called urban core; generated by clustering grid cells with a population of at least 15,000 (see Section 2.2). Within the urban core, the areas with the highest density (based on population density and building floor space) are classified as part of the inner urban category, while less dense areas are classified as part of the outer urban category. The typology class inner urban areas is the one where most people live in all the countries. In the five Nordic countries and Åland combined, inner urban areas is clearly the most populated class in the Nordic typology, where over 12.2 million (nearly 45%) of the population live. This is followed by outer urban areas and peri-urban areas where almost 15% and 13% of the population live, respectively. Among the Nordic countries, Iceland has the highest concentration of people living in inner urban areas (60%), while this share is the lowest in Norway (34%). Interestingly, Iceland also has the highest proportion of people living in the most sparsely populated rural class (14%), which shows a unique characteristic of Icelandic settlement patterns, where approximately 75% of the population live in either the most urban or the most rural territorial class, while the proportion of the population that live in peri-urban areas is also noticeably lower than in the other countries.
The proportion of the population that live in the rural classes combined is relatively similar in all Nordic countries. However, there are clear country-specific differences between which specific rural class is most populated. For instance, in Denmark, the most populated class is rural close to urban, whereas the class rural heartland areas is the most populated typology in Norway, and the class sparsely populated rural areas is most populated in Iceland.
Figure 17. The proportions of the population in the Nordic countries that live in the different Nordic typology classes.
Comparison of Figures 16 and 17, shows that even though the urban classes in the Nordic typology only constitute a low proportion of the territory in all countries, most of the population live in relatively concentrated areas categorised as urban. Conversely, in terms of territorial coverage, all Nordic countries are, to a high degree, rural when considering the proportion of the land area that is categorized into one of the rural typology classes (where only a relatively small proportion of the population live). This can also be seen at the Nordic level in Figure 18 and table 3 which show the proportions and total numbers of the population that live in each typology class, and how much of the land area is categorized as part of the different typology classes in the Nordic countries combined. For example, the classes rural heartland and sparsely populated rural areas, which include less than 12% of the total population, constitute over half (53.7%) of the territory in the Nordic countries. This characteristic feature, where the land area is overwhelmingly rural but the population predominantly urban, is related to the fact that the urban typology classes have a significantly higher population density than the rural classes. This can be seen in Figure 19 which shows how many people, on average, live in a 1 × 1 km grid cell that belongs to each of the seven typology classes.
Figure 18. The proportions of the land area and of the population in the different Nordic typology classes in the Nordic countries combined.
Table 3. The proportions, total number of grid cells, and populations in the different Nordic typology classes for the Nordic countries combined (figures for Iceland are from 2017, while statistics for the other countries are from 2022).
Typology class name | Total number of grid cells in different typology classes (n) | Proportion of territory (grid cells in a certain typology class) (%) | Population in different typology classes (n) | Proportion of population in different typology classes (%) |
Inner urban area | 4,874 | 1.46 | 12,236,091 | 44.82 |
Outer urban area | 7,734 | 2.32 | 3,993,355 | 14.63 |
Peri-urban area | 4,5427 | 13.65 | 3,487,337 | 12.77 |
Local centre in rural area | 2,849 | 0.86 | 1,667,161 | 6.11 |
Rural area close to urban | 9,3339 | 28.05 | 2,781,806 | 10.19 |
Rural heartland | 8,8120 | 26.48 | 2,332,817 | 8.55 |
Sparsely populated rural area | 9,0440 | 27.18 | 801,088 | 2.93 |
Total | 47,1896 | 100 | 27,299,655 | 100 |
As shown in Figure 19, in terms of population density, inner urban areas are the most densely populated among the typology classes, which is expected as this territorial class was created based on population and building density. In the five Nordic countries, an average inner urban grid cell has a population ranging from between 2,266 in Norway to 2,711 in both Denmark and Sweden. The second most densely populated typology class is either outer urban area or local centre in rural areas, with some variation between countries. The class peri-urban areas, which is essentially an intermediate category between the urban and rural classes, has a clear lower population density than the urban classes, while at the same time being much more densely populated than the rural classes. In addition, the class local centres in rural areas, which is a category for the most densely populated settlements in rural areas, can at the same time also be regarded as an intermediate category of sorts (see Figure 11). The higher population density in these areas compared to the other rural classes corresponds to the notion that these areas are, by definition, the main population centres located outside urban areas and small towns, where the population is within the range 5,000–14,999 (see Section 2.3). The categories rural close to urban and rural heartland are, on average, rather similar in terms of population density, while sharing a less dense population than the urban and peri-urban classes. The category sparsely populated rural areas has by far the lowest population density among all classes, with an average ranging from seven people per 1 × 1 km grid cell in Finland to 16 people in Iceland. The substantially higher population density in the urban typology classes highlights that while the Nordic countries predominantly consist of territories that can be described as rural, the population live largely in the more densely populated urban areas.
Figure 19. Average population density in a 1 × 1 km grid cell that belongs to each of the seven Nordic typology classes.
Population-change dynamics in different types of urban and rural areas
In the following, the focus is on what types of recent population change dynamics can be observed in the Nordic countries in the different typology classes between 2008 and 2022. Population changes are examined in Denmark, Finland and Åland, Norway, and Sweden; because of a lack of data Iceland is not included in the analyses of this section.
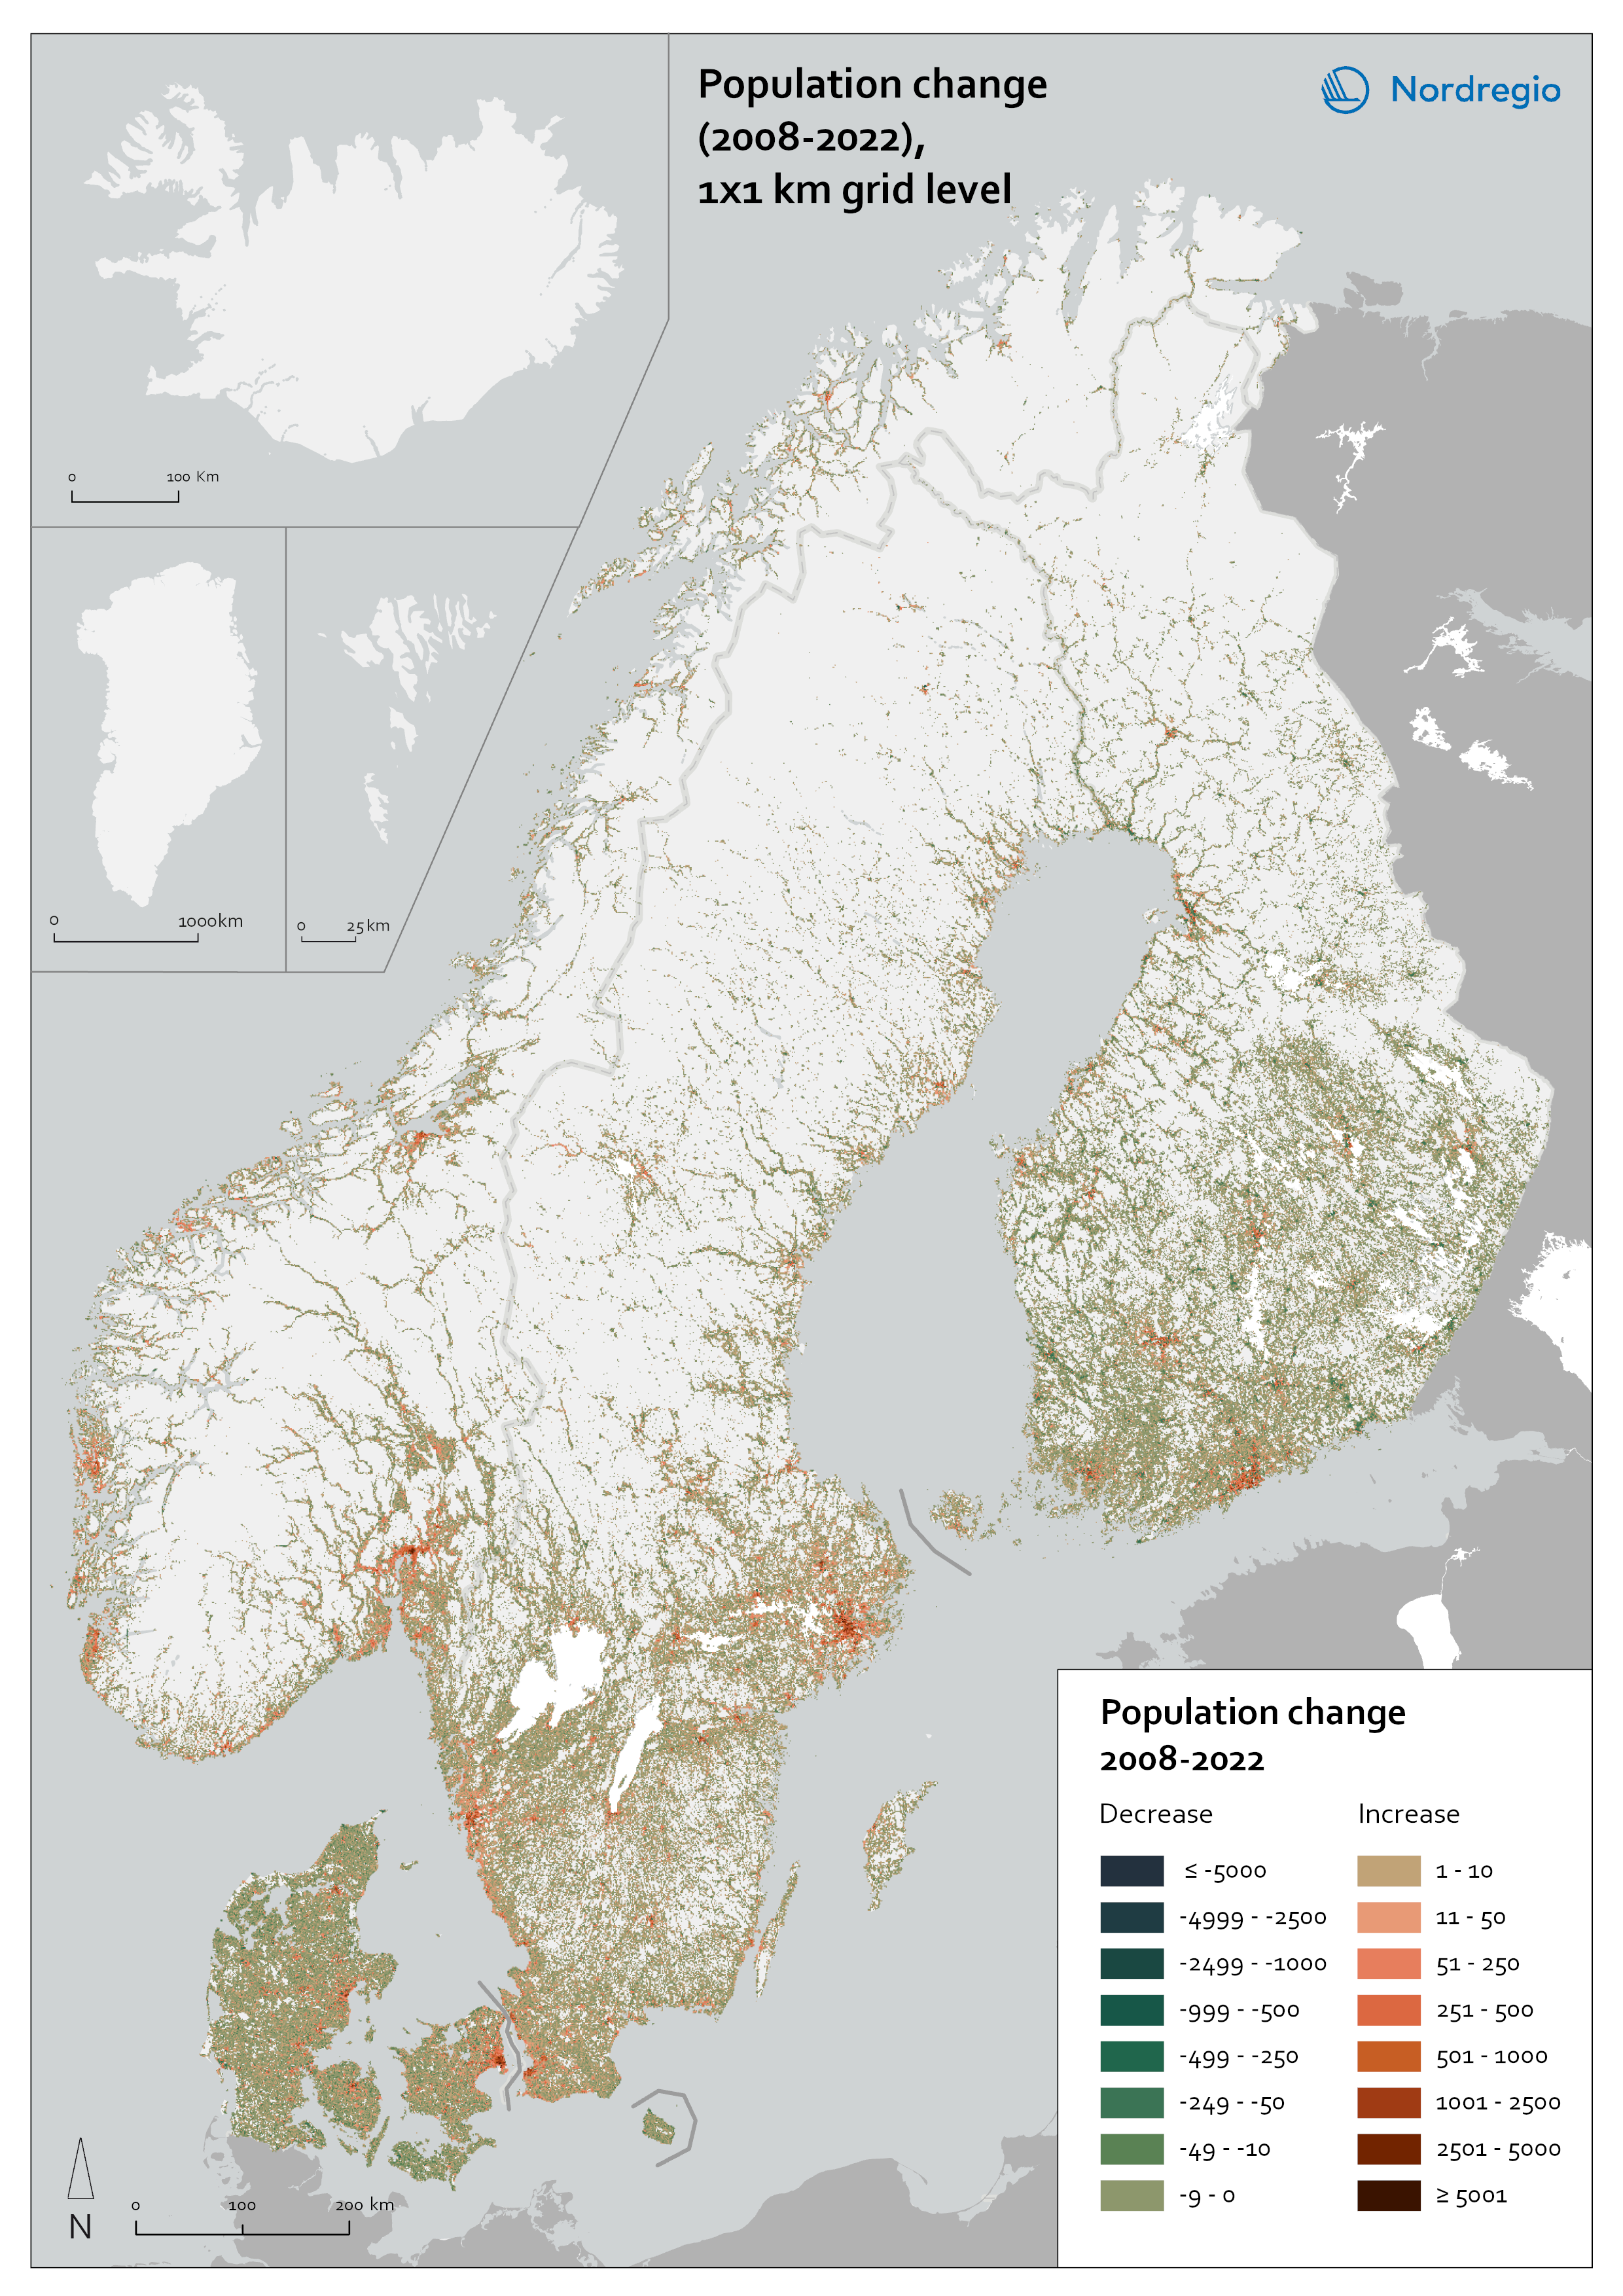
Figure 20 shows population change at the 1 x 1 km grid level in Denmark, Finland and Åland, Norway, and Sweden between 2008 and 2022. A common characteristic in these countries is that the major urban regions stand out as the most noticeable areas of population increase during this time. An increase in population is most evident in the capital city regions of each country, but also in other major and medium-sized urban regions. In Denmark, the capital region surrounding Copenhagen has the largest concentration of population increase, but also Aarhus, and to a lesser extent Odense and Aalborg are urban regions where the population has grown. In Finland, the Helsinki region has undergone the most noticeable growth; Tampere, Oulu, Turku, and Jyväskylä are examples of other urban regions where noticeable population increase has occurred. In Norway, the most noticeable concentration of population increase is around Oslo, while other recognizable growth regions are along the coast around Bergen, Stavanger, and Trondheim. In Sweden, the most visible concentration of population growth can be observed in the Stockholm region, followed by the Gothenburg region, on the country’s western coast. Other clear concentrations of population growth in Sweden are in the southern region of Skåne and especially around the city of Malmö.
While population growth is concentrated around certain large and medium-sized cities and their surrounding regions, by contrast, population decrease, is clearly more dispersed over larger areas. This general pattern can be seen in all four countries in Figure 20. In Denmark, areas of declining population are found especially in the northern and southern parts of Jutland, in Lolland, and in Bornholm. Also, several growing urban regions, such as Odense, Aarhus, and Aalborg, are largely surrounded by areas of population decline. Similarly, in Finland, the main growth in urban regions is surrounded by grid cells where the population is shrinking. Even though population decline is evident throughout the country, certain regions, such as Kymenlaakso in south-eastern Finland and Kainuu in the north-east, are predominantly shrinking. The areas of population decline in Denmark are more visible than in Finland (Figure 20) owing to a considerably higher overall population density, while population shrinkage in Finland is dispersed over larger and more sparsely populated areas. In Norway, there are comparatively few shrinking areas visible; those that exist are relatively scattered around the country. Unlike Denmark and Finland, where there are vast and continuous areas of significant population shrinkage, the scattered shrinking areas in Norway mainly show a moderate population decrease. In Sweden, there are noticeably more areas of population decrease in the central and northern areas than in the south, but overall shrinkage is clearly less evident than in Denmark or Finland. A difference that can be seen when comparing the northern parts of Finland, Norway, and Sweden is that there are more noticeable concentrations of population increase in northern Norway, including the medium-sized cities of Bodø and Tromsø and their surroundings. In northern Finland, population shrinkage is clearly more common than population growth.
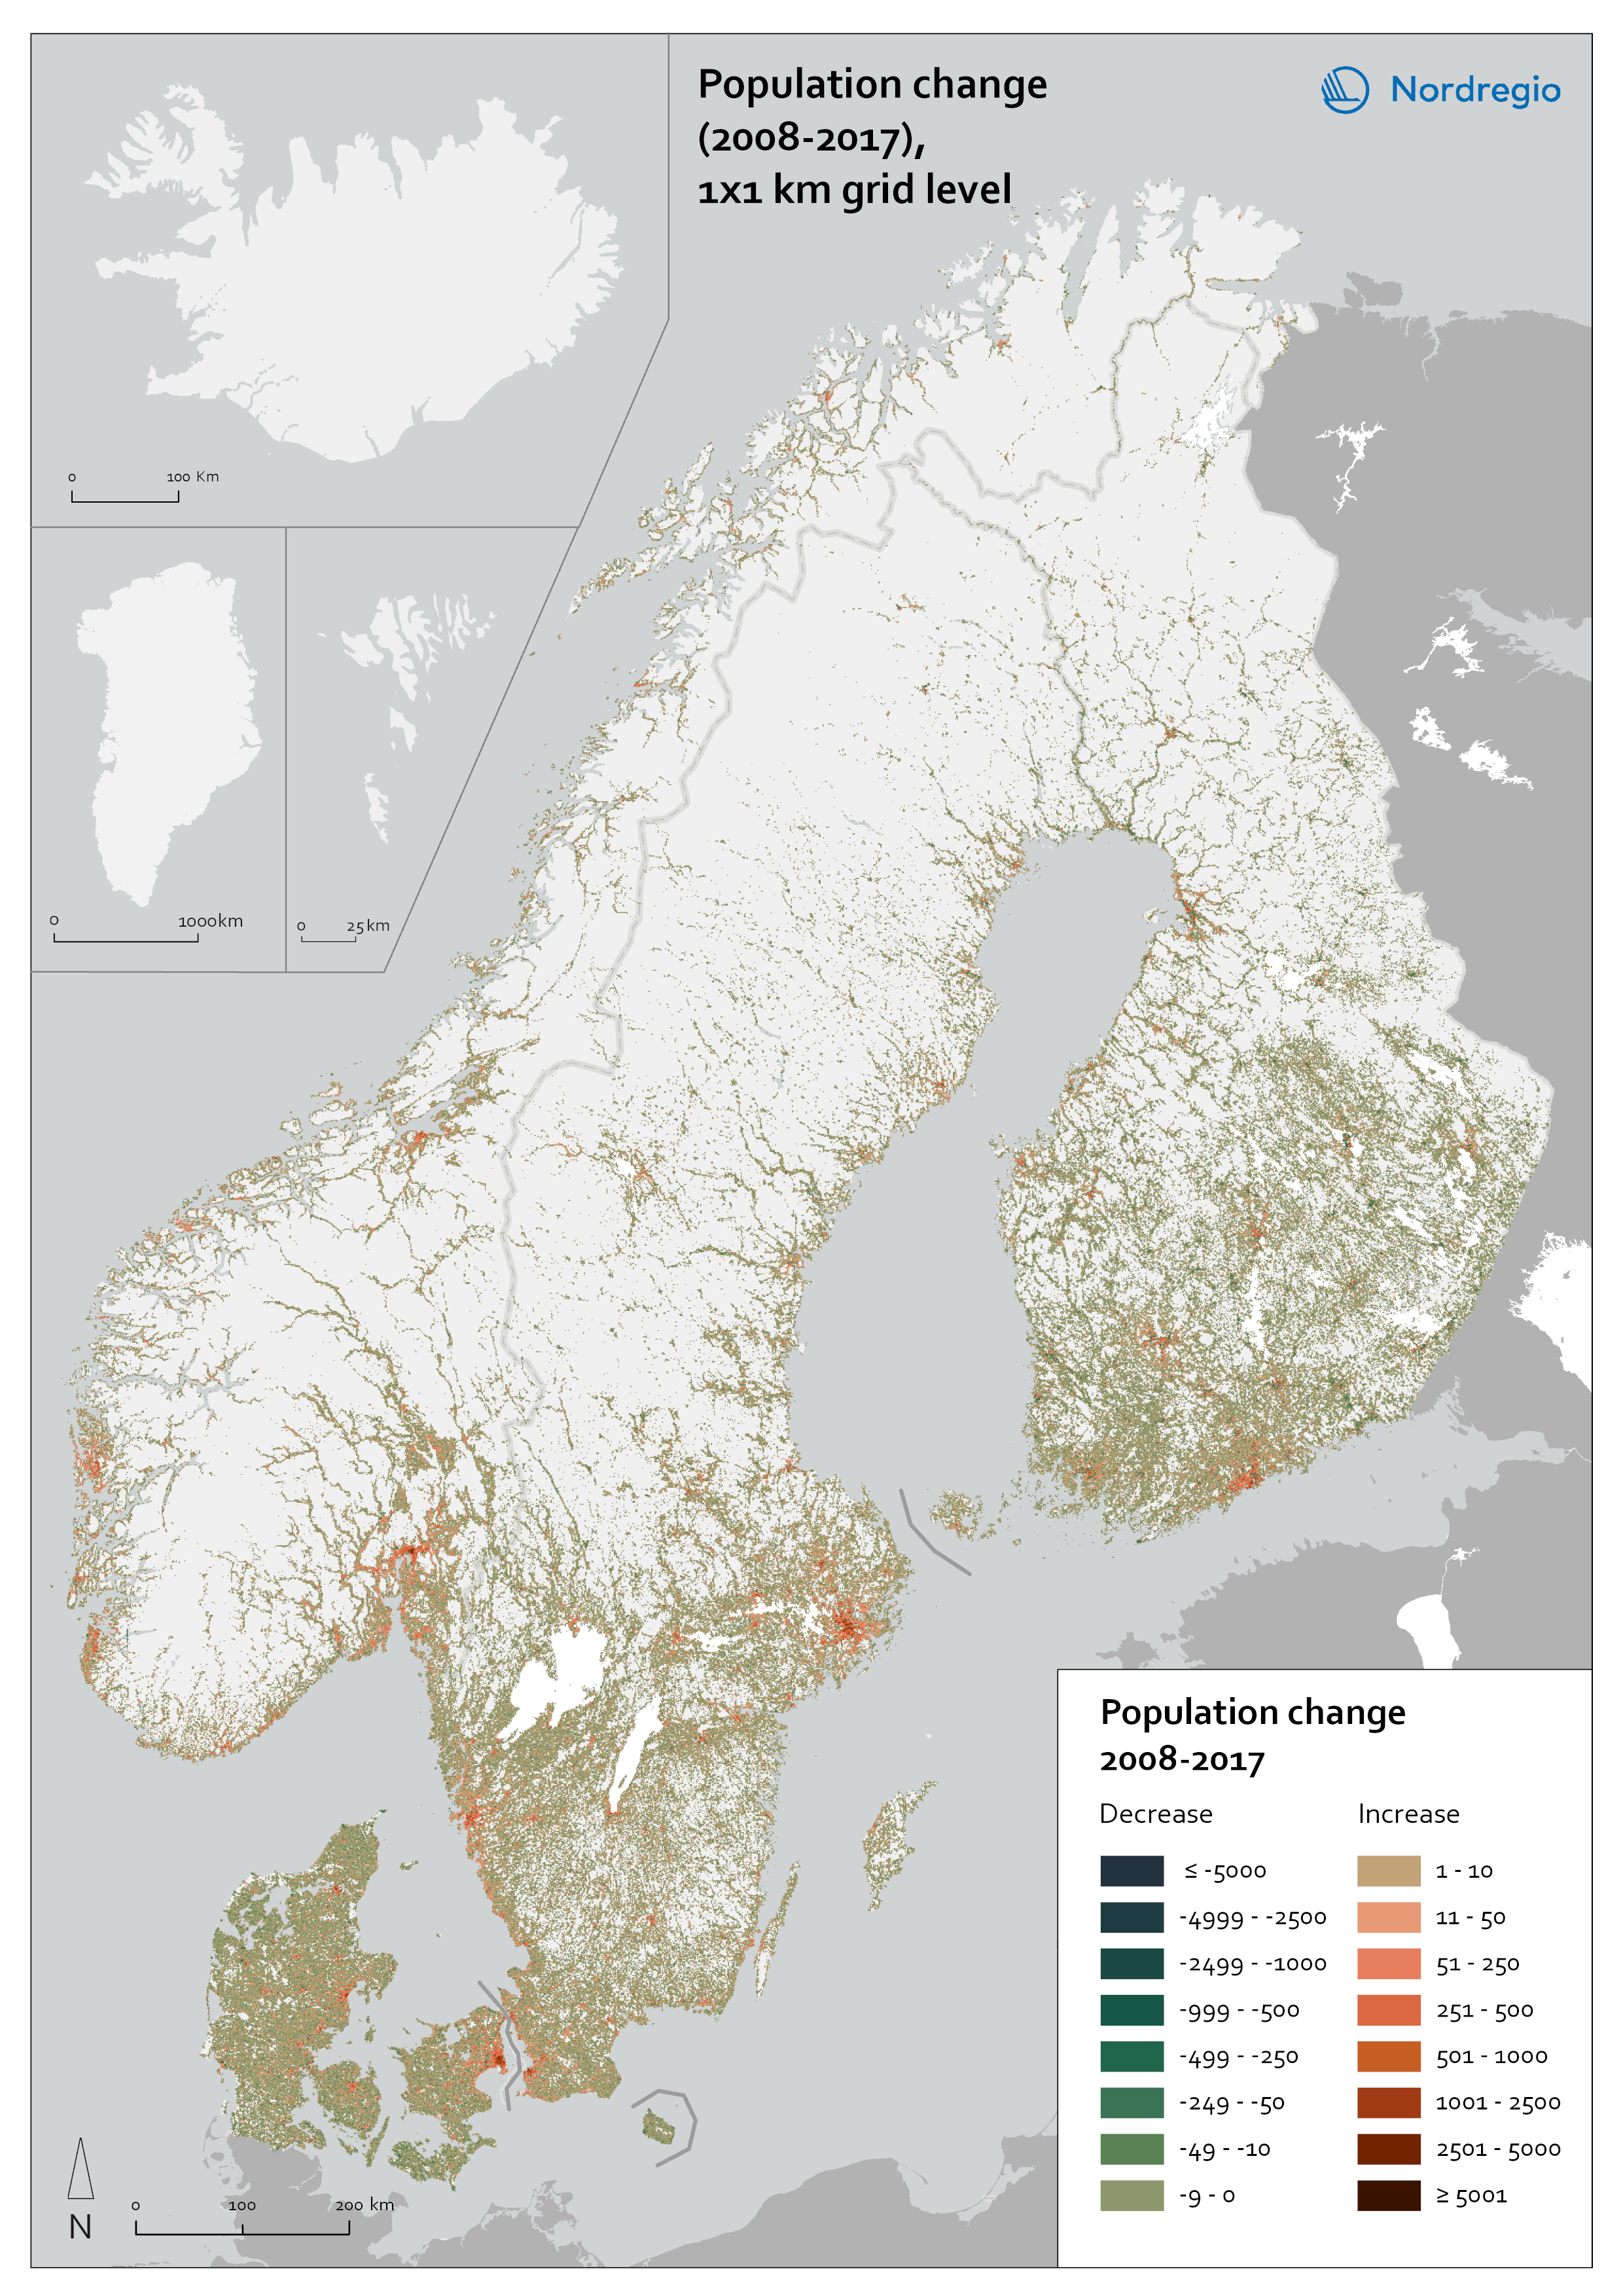

Figures 21 and 22 show a slightly more detailed picture of the population development trends seen during approximately the past decade and a half. Figure 21 shows the population development during the period 2008–2017, while Figure 22 shows the development during the period 2017–2022. It should be acknowledged that these two time periods and the two maps are not entirely comparable; Figure 21 shows changes during a ten-year period, whereas Figure 22 shows changes during a ten-year period. Nevertheless, by comparing these two time periods, it is possible, in a broad sense, to identify whether the general development that occurred during the period 2008–2017 also continued during 2018–2022, or whether some differences can be observed. This is of interest from the point of view of the possible territorial implications that come with increased remote working. This was a topic that was widely discussed during the Covid-19 pandemic (when this project was initiated) and there were debates about whether changed remote-working practices could potentially lead to a shift in the way that different types of urban and rural areas develop (see also Randall et al. 2022).
When comparing the two previous maps (Figures 21 and 22), the general picture is similar, with the areas of population increase and decrease being in largely the same places. This suggests that the general patterns of population change in Nordic territories have not radically shifted in the periods 2008–2017 and 2018–2022. Nevertheless, more noticeable differences can be observed when examining certain specific regions and municipalities at a more detailed level. Figures 23 and 24 provide a more nuanced outlook on the cross-border Øresund Region and the Stockholm Region, showing territorial differences within the regions based on the Nordic urban–rural typology and what the population development looked like in the years 2008–2017 and 2018–2022. While these are the two largest urbanised regions in the Nordic countries, the figures show that they both include a variety of different types of areas. What is noticeable in both these regions is that a shift in the patterns of population change can be seen between the two periods in time. While the years 2008–2017 were characterised by noticeable population increase in the inner and outer urban areas of these regions, in 2018–2022, many of the same areas that had previously grown saw a decrease in population. This is a common trend that can be observed both in the Stockholm region (Figure 24) and around Copenhagen, Malmö, and Helsingborg-Helsingør (Figure 23).
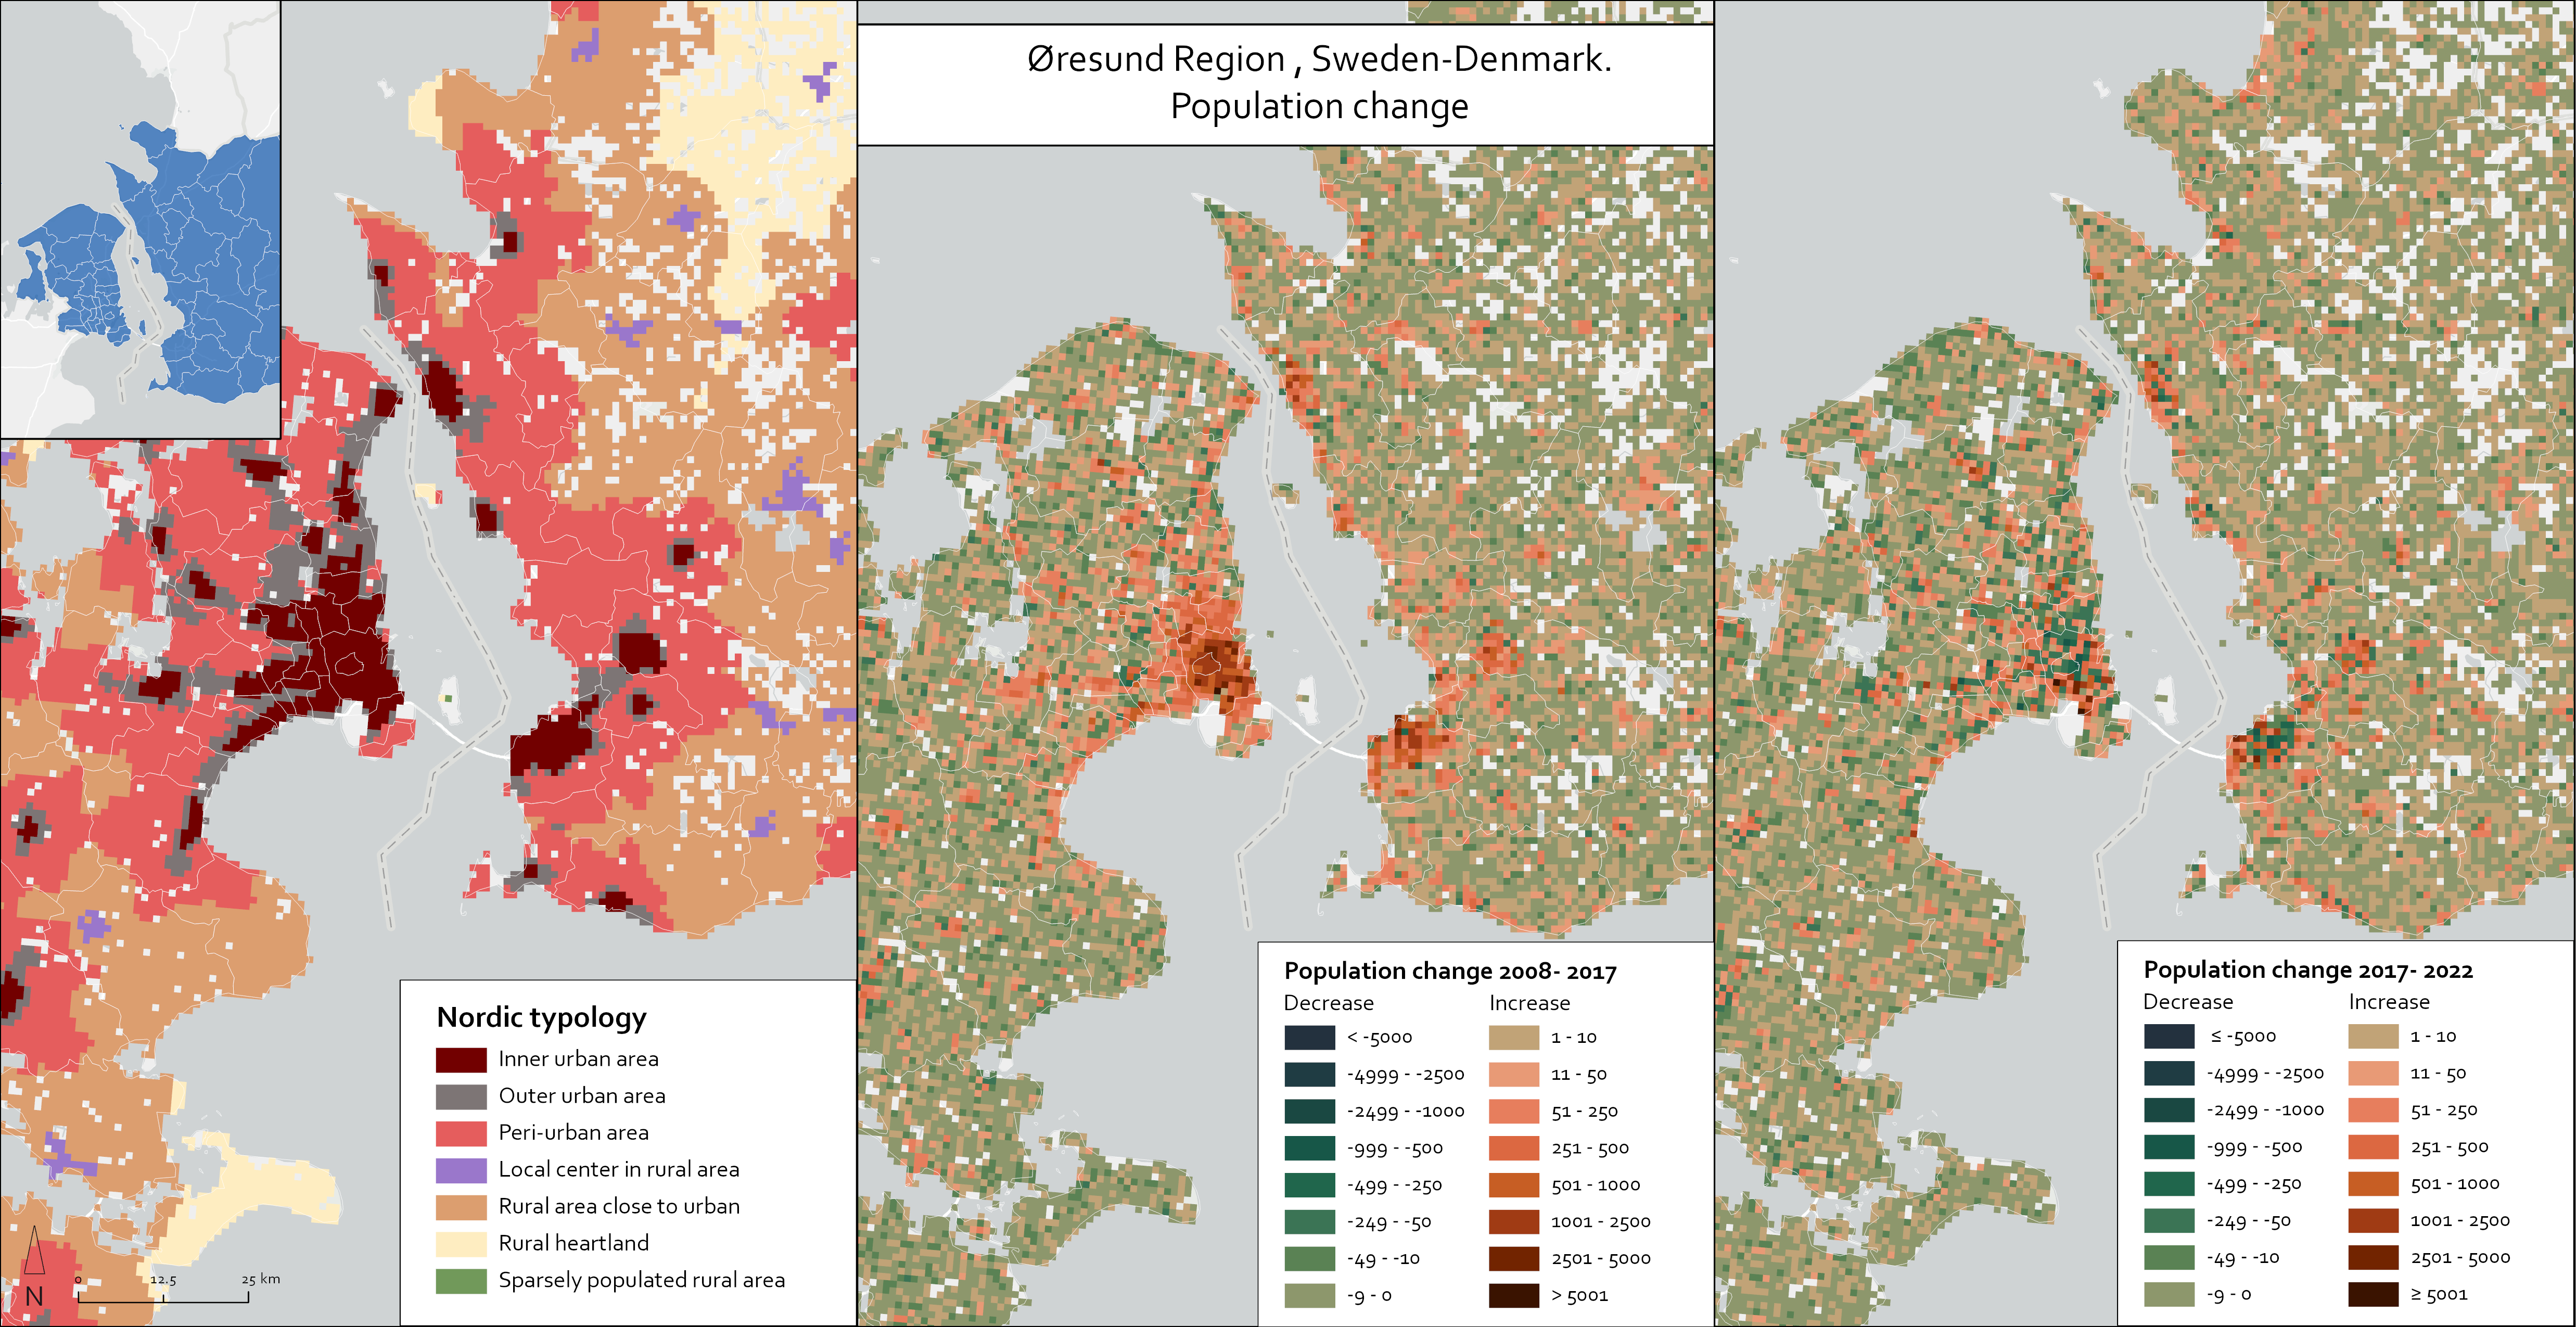
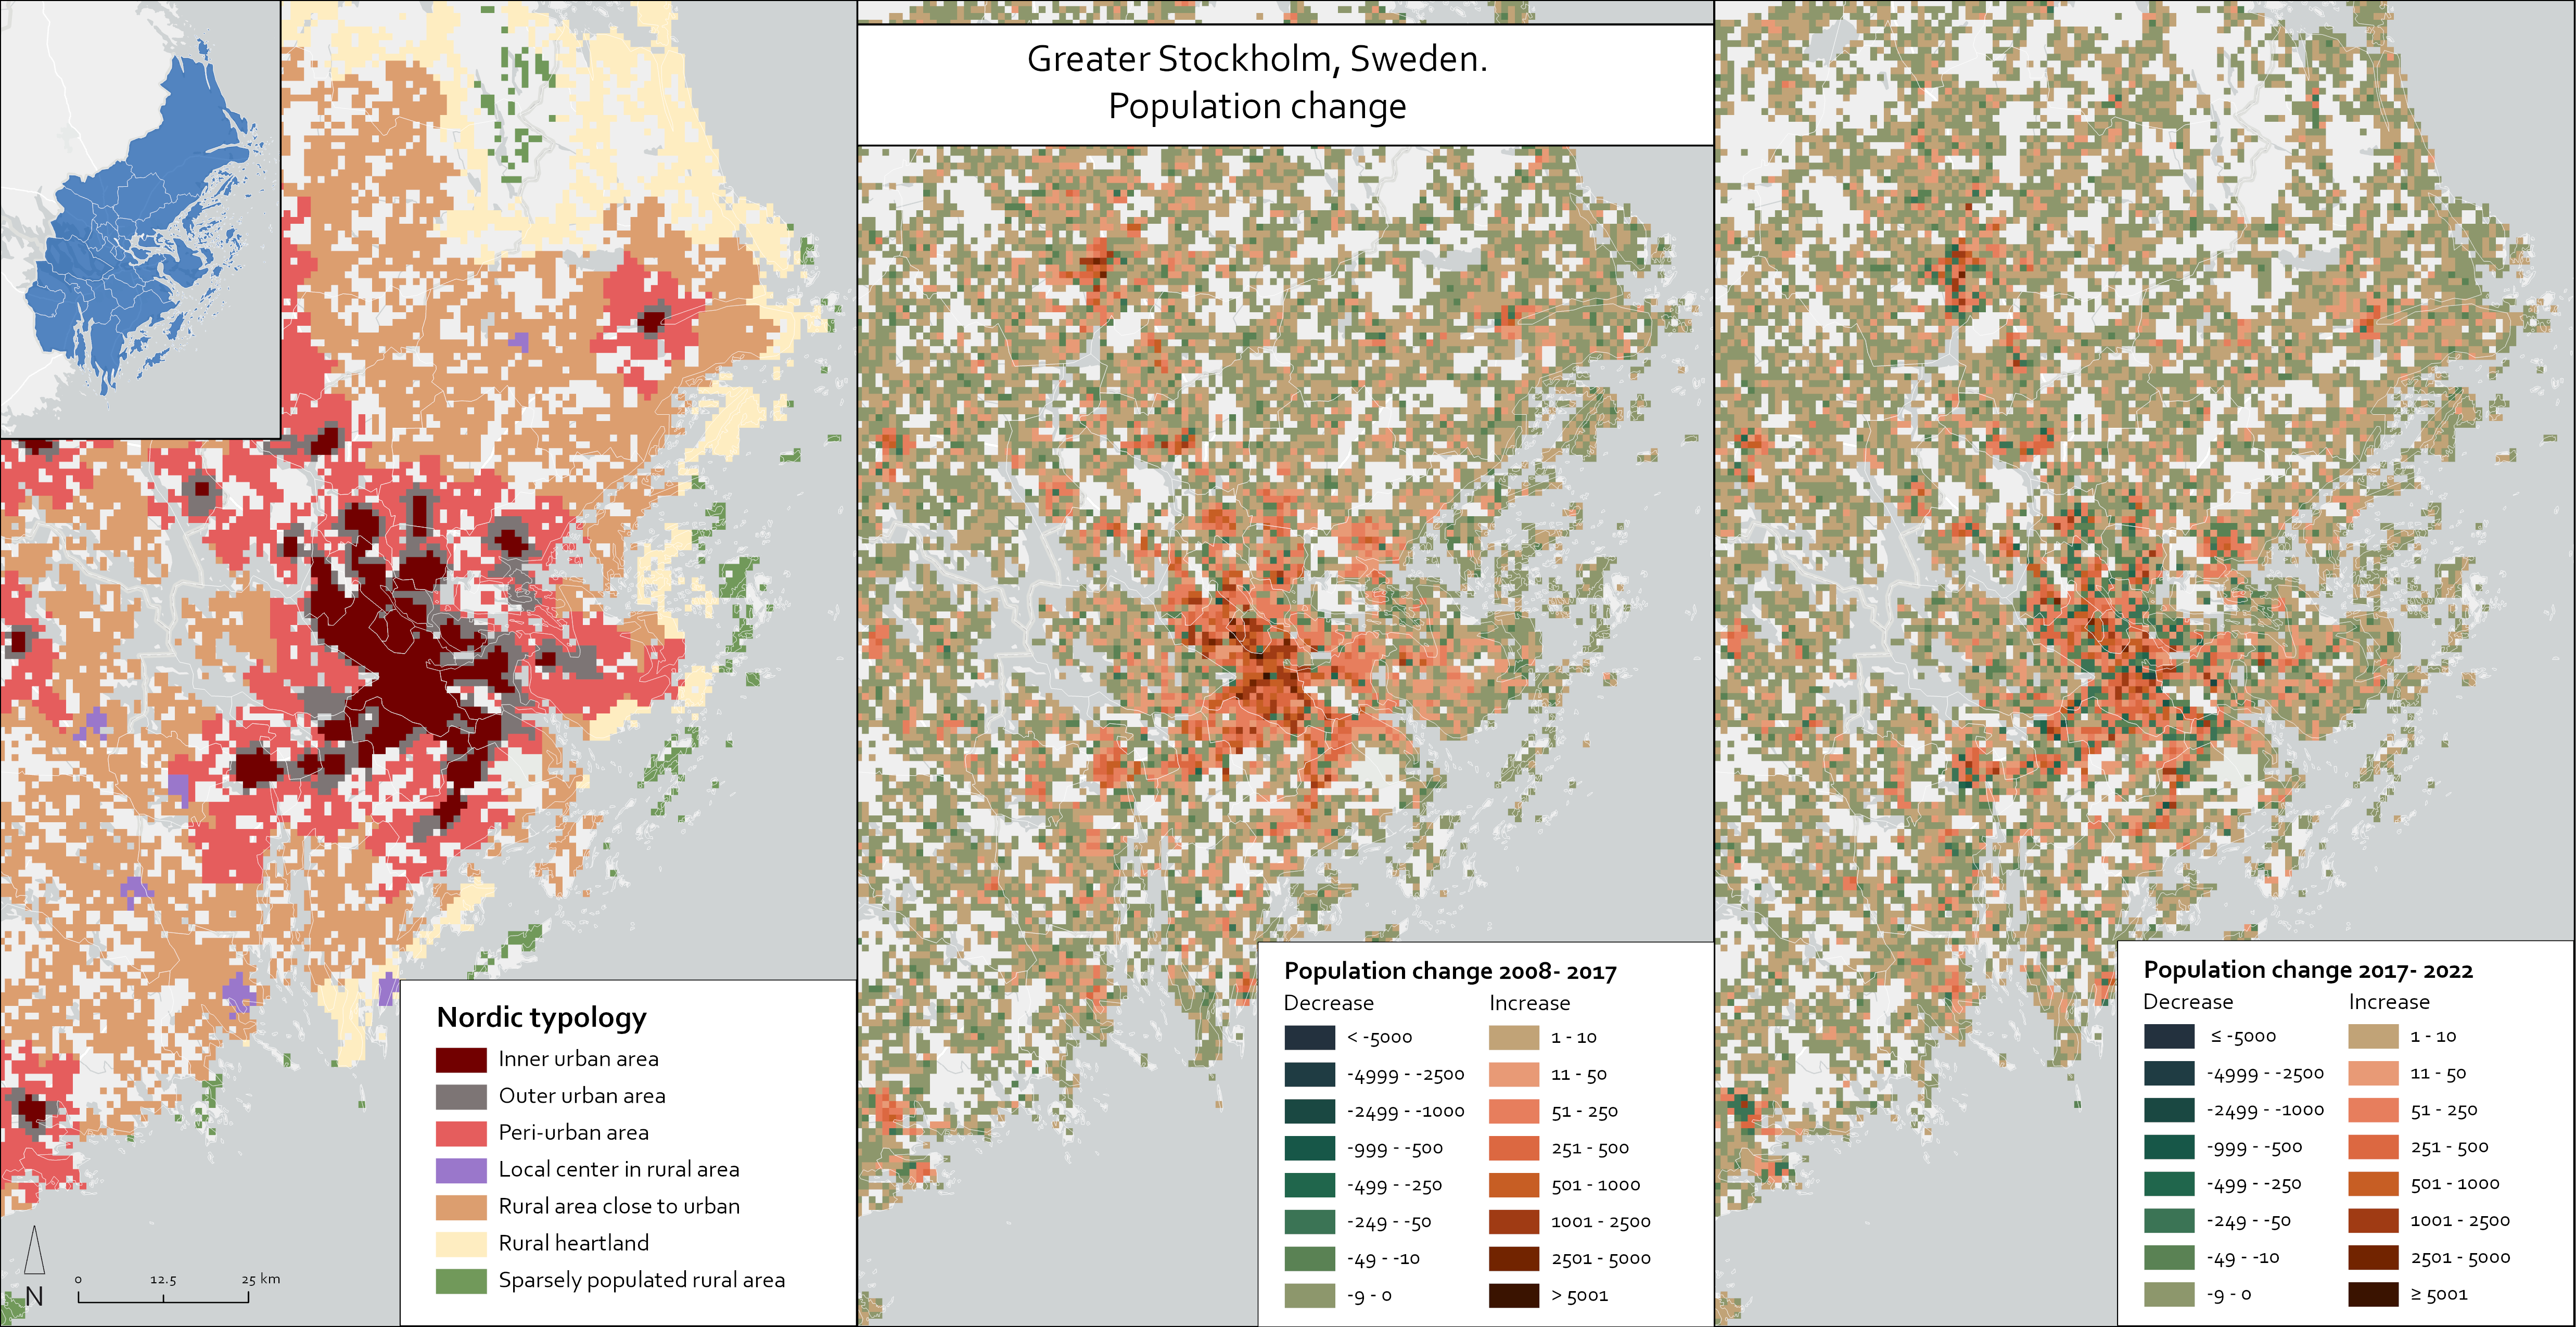
Figure 25 provides a similar, detailed outlook on population change dynamics within the Norwegian municipality of Ullensaker, located in Akershus county, north-east of Oslo. Ullensaker is categorised as an intermediate municipality according to DEGURBA. Based on the Nordic typology, the most densely populated settlements in the municipality, mainly including Jessheim, are classified as inner urban and outer urban while approximately three-quarters (75.5%) of the populated area within the municipality belongs to the peri-urban class. Ullensaker is one of the fastest-growing municipalities in the Nordic counties, and its population has nearly doubled over the past two decades, from approximately 22,000 to 42,000 between 2002 and 2022. An interesting characteristic that can be observed is that while most of the population in the municipality lives in peri-urban areas, this typology class has seen a decrease in population from 2008 to 2022. At the same time, the population of both inner urban and outer urban areas has increased, and sometime between 2017 and 2022, the number of people living in inner urban areas exceeded that of outer urban areas (see Figure 26). This trend of population growth in the most urbanised areas together with the significant absolute population growth in the municipality mean that Ullensaker is one of the most rapidly urbanising Nordic municipalities.

Figure 26. Ullensaker, Norway. Population and populated area by Nordic rural-urban typology.
Next, we consider what kind of population development trends can be seen over time in the different territorial classes of the Nordic urban–rural typology. Figure 27 shows how the total population has changed over time in the Nordic countries in the different typology classes. A bubble chart is used to highlight the different reference years (2008, 2017, 2022) and to aid examination of the population change in the different countries, both separately and combined. While it was possible to examine population changes for the period 2008–2022 in each of these typology classes for Denmark, Finland and Åland, Norway, and Sweden, data for Iceland was only available for 2017.
Figure 27. Population changes in the different Nordic typology classes for the years 2008, 2017, and 2022.
The Nordic countries have undergone a noticeable population increase in recent decades. For the five Nordic countries combined, the population grew from 25 million in 2008 to 27.7 million in 2022; this trend was evident for all countries (Nordic statistics, 2024). However, Figure 27 reveals a rather unbalanced development with different types of areas developing quite differently; certain territorial classes in the Nordic typology have undergone greater population growth than others, while some typology classes have seen a decrease in population.
The most significant population increase occurred in inner urban areas. This line of development can be observed in Sweden, Finland and Åland, Norway, and Denmark, where the combined population grew from 10.3 million to 12.0 million in the period 2008–2022. However, in the case of Denmark, it is noteworthy that the population in inner urban areas increased between 2008 and 2017 (from 2.42 million to 2.67 million), while there was a slight population decrease in this typology class between 2017 and 2022 (from 2.67 million to 2.53 million). In addition, in outer urban areas there was an increase in population in all four Nordic countries, from 3.48 million to 3.97 million between 2008 and 2022. Similarly, the intermediate typology class of peri-urban areas saw an increase in population in all four countries (from 3.11 million to 3.48 million between 2008 and 2022).
The rural typology classes have undergone a more differentiated development. For instance, there was an increase in population in the typology class rural close to urban in Norway and Sweden during the period 2008–2022, while the population decreased in these types of areas in Denmark and Finland and Åland. Also, in local centres in rural areas, the population increased in Denmark, Norway, and Sweden, while there was only a slight population decrease in this typology class in Finland. In areas that are classified as rural heartland, Norway is the only country where population increased, while these types of areas decreased in population in all other countries. The final typology class, sparsely populated rural areas, has the lowest total population among all the territorial classes, and these types of areas are also those where population shrinkage has been the most pronounced in all the countries (from 868,000 to 753,000 in the Nordic countries combined).
We have illustrated that urbanisation is a clear trend that can be seen in the Nordic countries during the past couple of decades. The main urban regions have seen the most noticeable increases in population. The analysis of population change in the different typology classes, with the largest population growth occurring in inner urban and outer urban areas, also underlines this development. It can also be concluded that peri-urban areas have undergone a noticeable increase in population, which indicates growth on the fringes of urban regions, suggesting suburbanisation. The general trend seen in rural areas points towards depopulation, but the changes that can be observed in the different typology classes suggests a more differentiated development, where different types of rural areas have developed differently. This is highlighted by the fact that rural areas close to urban areas have generally seen an increase in population, in a manner similar to that of local centres in rural areas, which suggests that some of the rural areas that are located in the vicinity of cities and towns may have become more attractive places for people to settle (see also Randall et al. 2022). In addition, sparsely populated rural areas appear to be in a more disadvantaged position and the general trend in these areas is that their population has decreased noticeably.
It should be noted that, in addition to the previously described general trends in the Nordic countries, the more specific population changes that can be observed in different regions and municipalities also differ from one another. To better understand these context-specific differences would require closer examination of the more local and regional conditions that are driving the different developments seen.
Scaling up the Nordic typology from grid level to municipality level
While the Nordic urban–rural typology is grid-based (constructed on a 1 × 1km grid) it is also possible to aggregate or scale up this classification to more general territorial levels, such as to the municipality level. This flexibility of the typology can be regarded as an advantage. For instance, from a policymaking and planning point of view, municipalities in the Nordic countries are self-governing authorities, and by scaling up the typology from grid level to municipality level, the typology can help provide new perspectives on territorial differences to support local-governance and planning. Also, from a statistical point of view, most data are produced at the level of administrative area, and the typology and grid data linked to this classification can be used to complement the more general spatial data. The Nordic typology has been constructed such that all 1 × 1 km grid cells in each of the five countries have been classified into one of the seven typology classes based on the specific characteristics of each grid cell. In Figure 28, the typology has been aggregated to the municipality level in two different ways: 1. based on the typology class that is most common in each municipality, when considering how much of the land area belongs to the different typology classes and, 2. based on the typology class where most people live in a specific municipality. This means that the figure shows the number of municipalities in each Nordic country, and in all countries combined, where a certain typology class is most common in terms of territorial coverage, and where most people live in that municipality.
Figure 28. The number of municipalities in the Nordic countries based on the Nordic typology class which is most common in each municipality, in terms of territorial coverage and where most people live in that municipality.
When examining how common the different typology classes are in the Nordic countries, Figure 28 aids in showing that there is a total of 177 municipalities in the Nordic countries combined, where inner urban areas is the typology class where the largest number of people live. Many of these municipalities are found in either Sweden (86 municipalities) or Denmark (41 municipalities). In addition, there are only 36 municipalities in the Nordic countries combined, where inner urban areas is the most common typology class when calculated as a proportion of all grid cells in that municipality. It is also noteworthy that even though a relatively low proportion of the population in the Nordic countries live in the rural typology classes (see Figure 18 and Table 3), there remain many municipalities where the population predominantly live in one of the rural classes. For example, there are 316 Nordic municipalities where rural heartland is the most populated typology class, and many of these municipalities are found particularly in Norway (136 municipalities) and Finland and Åland (102 municipalities). There are also 206 Nordic municipalities where most of the population live in sparsely populated rural areas, which are located mainly in Norway, Finland, and Iceland. In Denmark, there is a single municipality, Christiansø, where sparsely populated rural is the most common typology based on where the population live and proportion of the land area4.
It is an interesting point that in over half of all Nordic municipalities the most common typology class is either rural heartland or sparsely populated rural. This can be seen clearly in the map presenting the Nordic urban–rural typology (Figure 13), where both categories, and especially sparsely populated rural areas, cover a significant proportion of the Nordic territory. Regarding the rural typology classes, it is also noteworthy that there are 119 Nordic municipalities where local centres in rural areas is the most populated typology class, but only three municipalities where this typology class is the predominant one in terms of territorial coverage. This is something that can be related to the notion that while local centres in rural areas have a high population density (see Figure 19), they are generally small in terms of geographic size.
4 Christiansø is a small Danish island municipality with a total area of 39 hectares and a population of 93 (in 2023), which is entirely classified as sparsely populated rural in the Nordic urban–rural typology.