2. The Nordic urban–rural typology
This section describes the Nordic urban–rural typology and how it was developed. The focus of Section 2.1 concerns the background and aims of the work carried out; also taking account of existing European and Nordic typologies that provided inspiration for the development of the Nordic typology. Section 2.2 describes, more specifically, how the typology was created, including key considerations at different stages of the work, and the main operational steps taken.
2.1 Background and context
Aims and objectives
A key starting point for this study was the need for a territorial typology that would help provide a richer and more nuanced understanding of different types of urban and rural areas in the Nordic countries. Essentially, a territorial typology can be defined as a way of identifying, delimiting, and classifying different places or territories based on certain common spatial characteristics and qualities (Copus et al. 2008; van Eupen et al. 2012, Eurostat 2019). Most commonly, typologies are used for analytical and research purposes or as tools for supporting policy development and interventions (Stjernberg et al. 2023). In this project, the main intention was to develop a typology suitable for analysis. In addition, by providing an analytical tool useful for generating new evidence on territorial development, the typology could also be useful for supporting spatial planning and policy.
While there are many existing typologies widely used for different analytical and policymaking purposes, one of the main shortcomings of most existing typologies is that they are too general and fail to grasp the diversity of Nordic territories observable, for instance, within municipalities. The aim of this study was specifically to acquire a more nuanced understanding of territorial differences, also within regions and municipalities (none of the existing typologies were suitable for such comparative analysis across the Nordic countries). To achieve this, the objective was to develop a harmonised Nordic typology suitable to be applied as an analytical framework for better understanding the characteristics and differences between different types of urban and rural areas.
The following objectives were specified at the onset of this project:
- Creating a new Nordic urban–rural typology based on harmonised Nordic definitions to help better understand the urban–rural continuum, mainly using open data and building on a replicable data process model.
- Using the typology for carrying out comparative analysis of settlement and mobility patterns and trends.
- Publishing the typology on an interactive digital mapping platform and making the typology layer available for download and further use.
Taking stock of existing typology frameworks
To help determine certain key aspects that should be considered in the development of a Nordic typology, the first step was to consider which potentially relevant territorial typologies currently exist, and what lessons can be drawn from these examples. This section identifies some different relevant typology frameworks and takes stock of these classifications from the perspective of creating a Nordic typology.
Traditionally, most typologies that seek to distinguish urban from rural areas have been based on administrative boundaries. This is the case with most European-wide typologies as well as with territorial classifications that have been created in the different European countries, which in most cases rely on some kind of classification of administrative areas, such as regions, municipalities, or other areal units (Stjernberg et al. 2023).
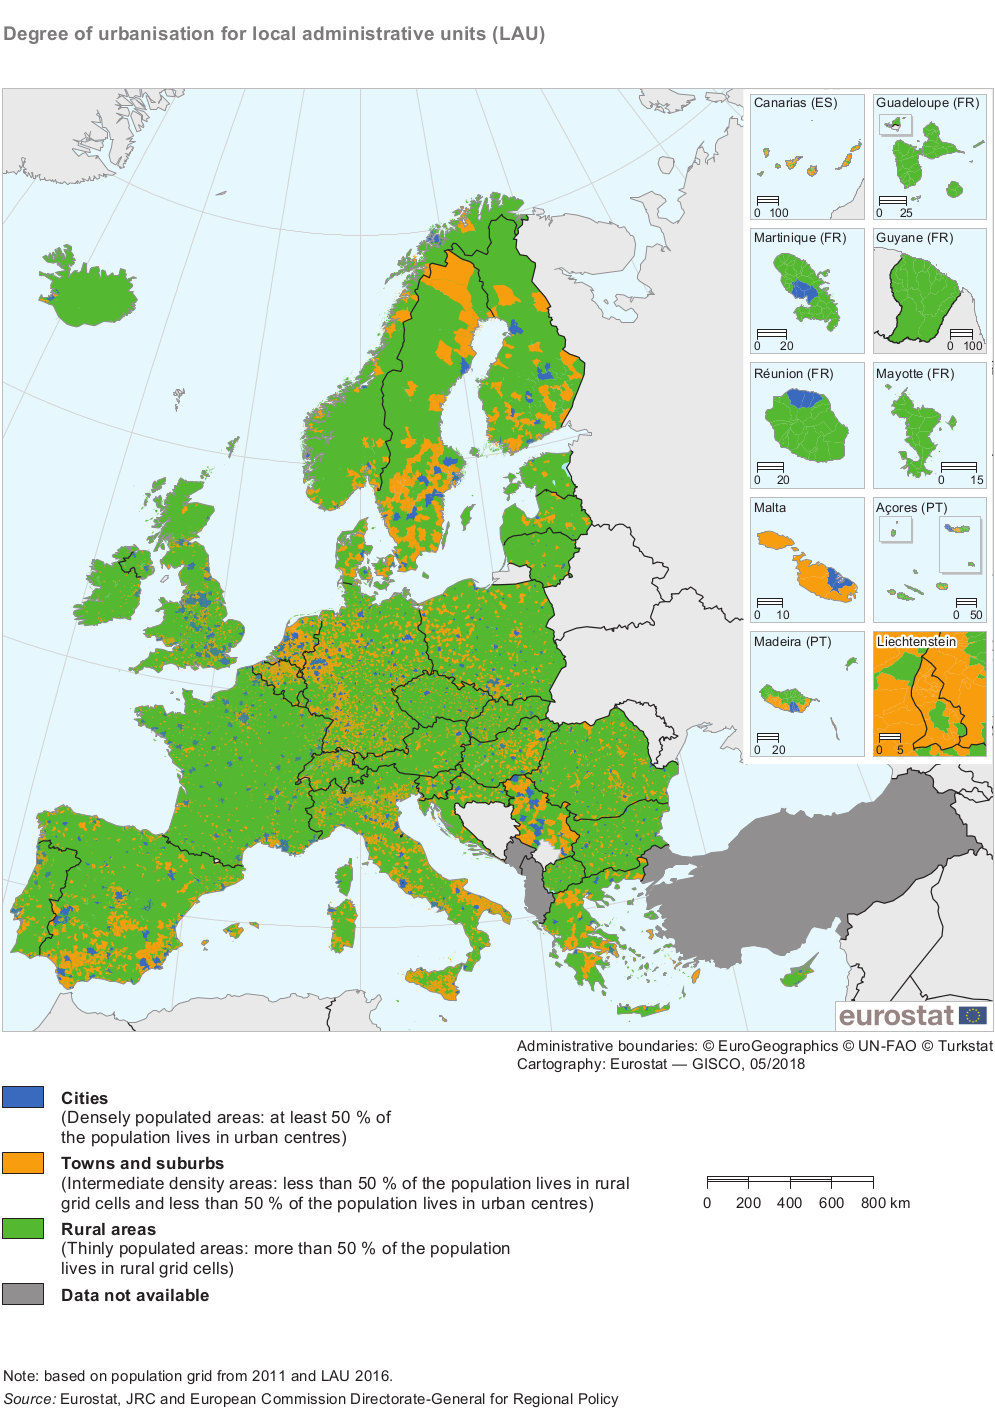
At the European level, the most established and commonly used typology for demarcating urban from rural areas is the degree of urbanisation (DEGURBA) classification created by Eurostat (2023). This typology categorises local administrative units (LAUs) into three classes ‘cities’, ‘towns and suburbs’, and ‘rural areas’, or alternatively, using the nomenclature of territorial units for statistics (NUTS) definitions, into ‘predominantly rural regions’, ‘intermediate regions’ and ‘predominantly urban regions’ (see Figure 1) (Eurostat, 2018). The typology is based on a combination of geographical contiguity and population density, measured by minimum population thresholds applied to 1 x 1 km population grid cells. In the Nordic countries, this classification means that municipalities are classified as either predominantly urban, intermediate, or predominantly rural (Figure 12). Most previous studies that have examined urban–rural differences across the Nordic countries used this Eurostat classification (e.g., Grunfelder et al. 2018, Sánchez Gassen & Heleniak 2019, Grunfelder et al. 2020, Norlén et al. 2022). It should, however, be noted that there have been efforts to create a more fine-grained territorial version of the DEGURBA classification. In 2018 DG REGIO published a refined version of this typology at grid level (DEGURBA level 2) consisting of six classes (cities, towns, suburbs, villages, dispersed rural areas, mostly uninhabited areas) (EEA, 2023). Currently, the most established version of DEGURBA classifies municipalities and communes (LAU level) into three categories; most comparable statistical data at the European level are produced at this territorial level.
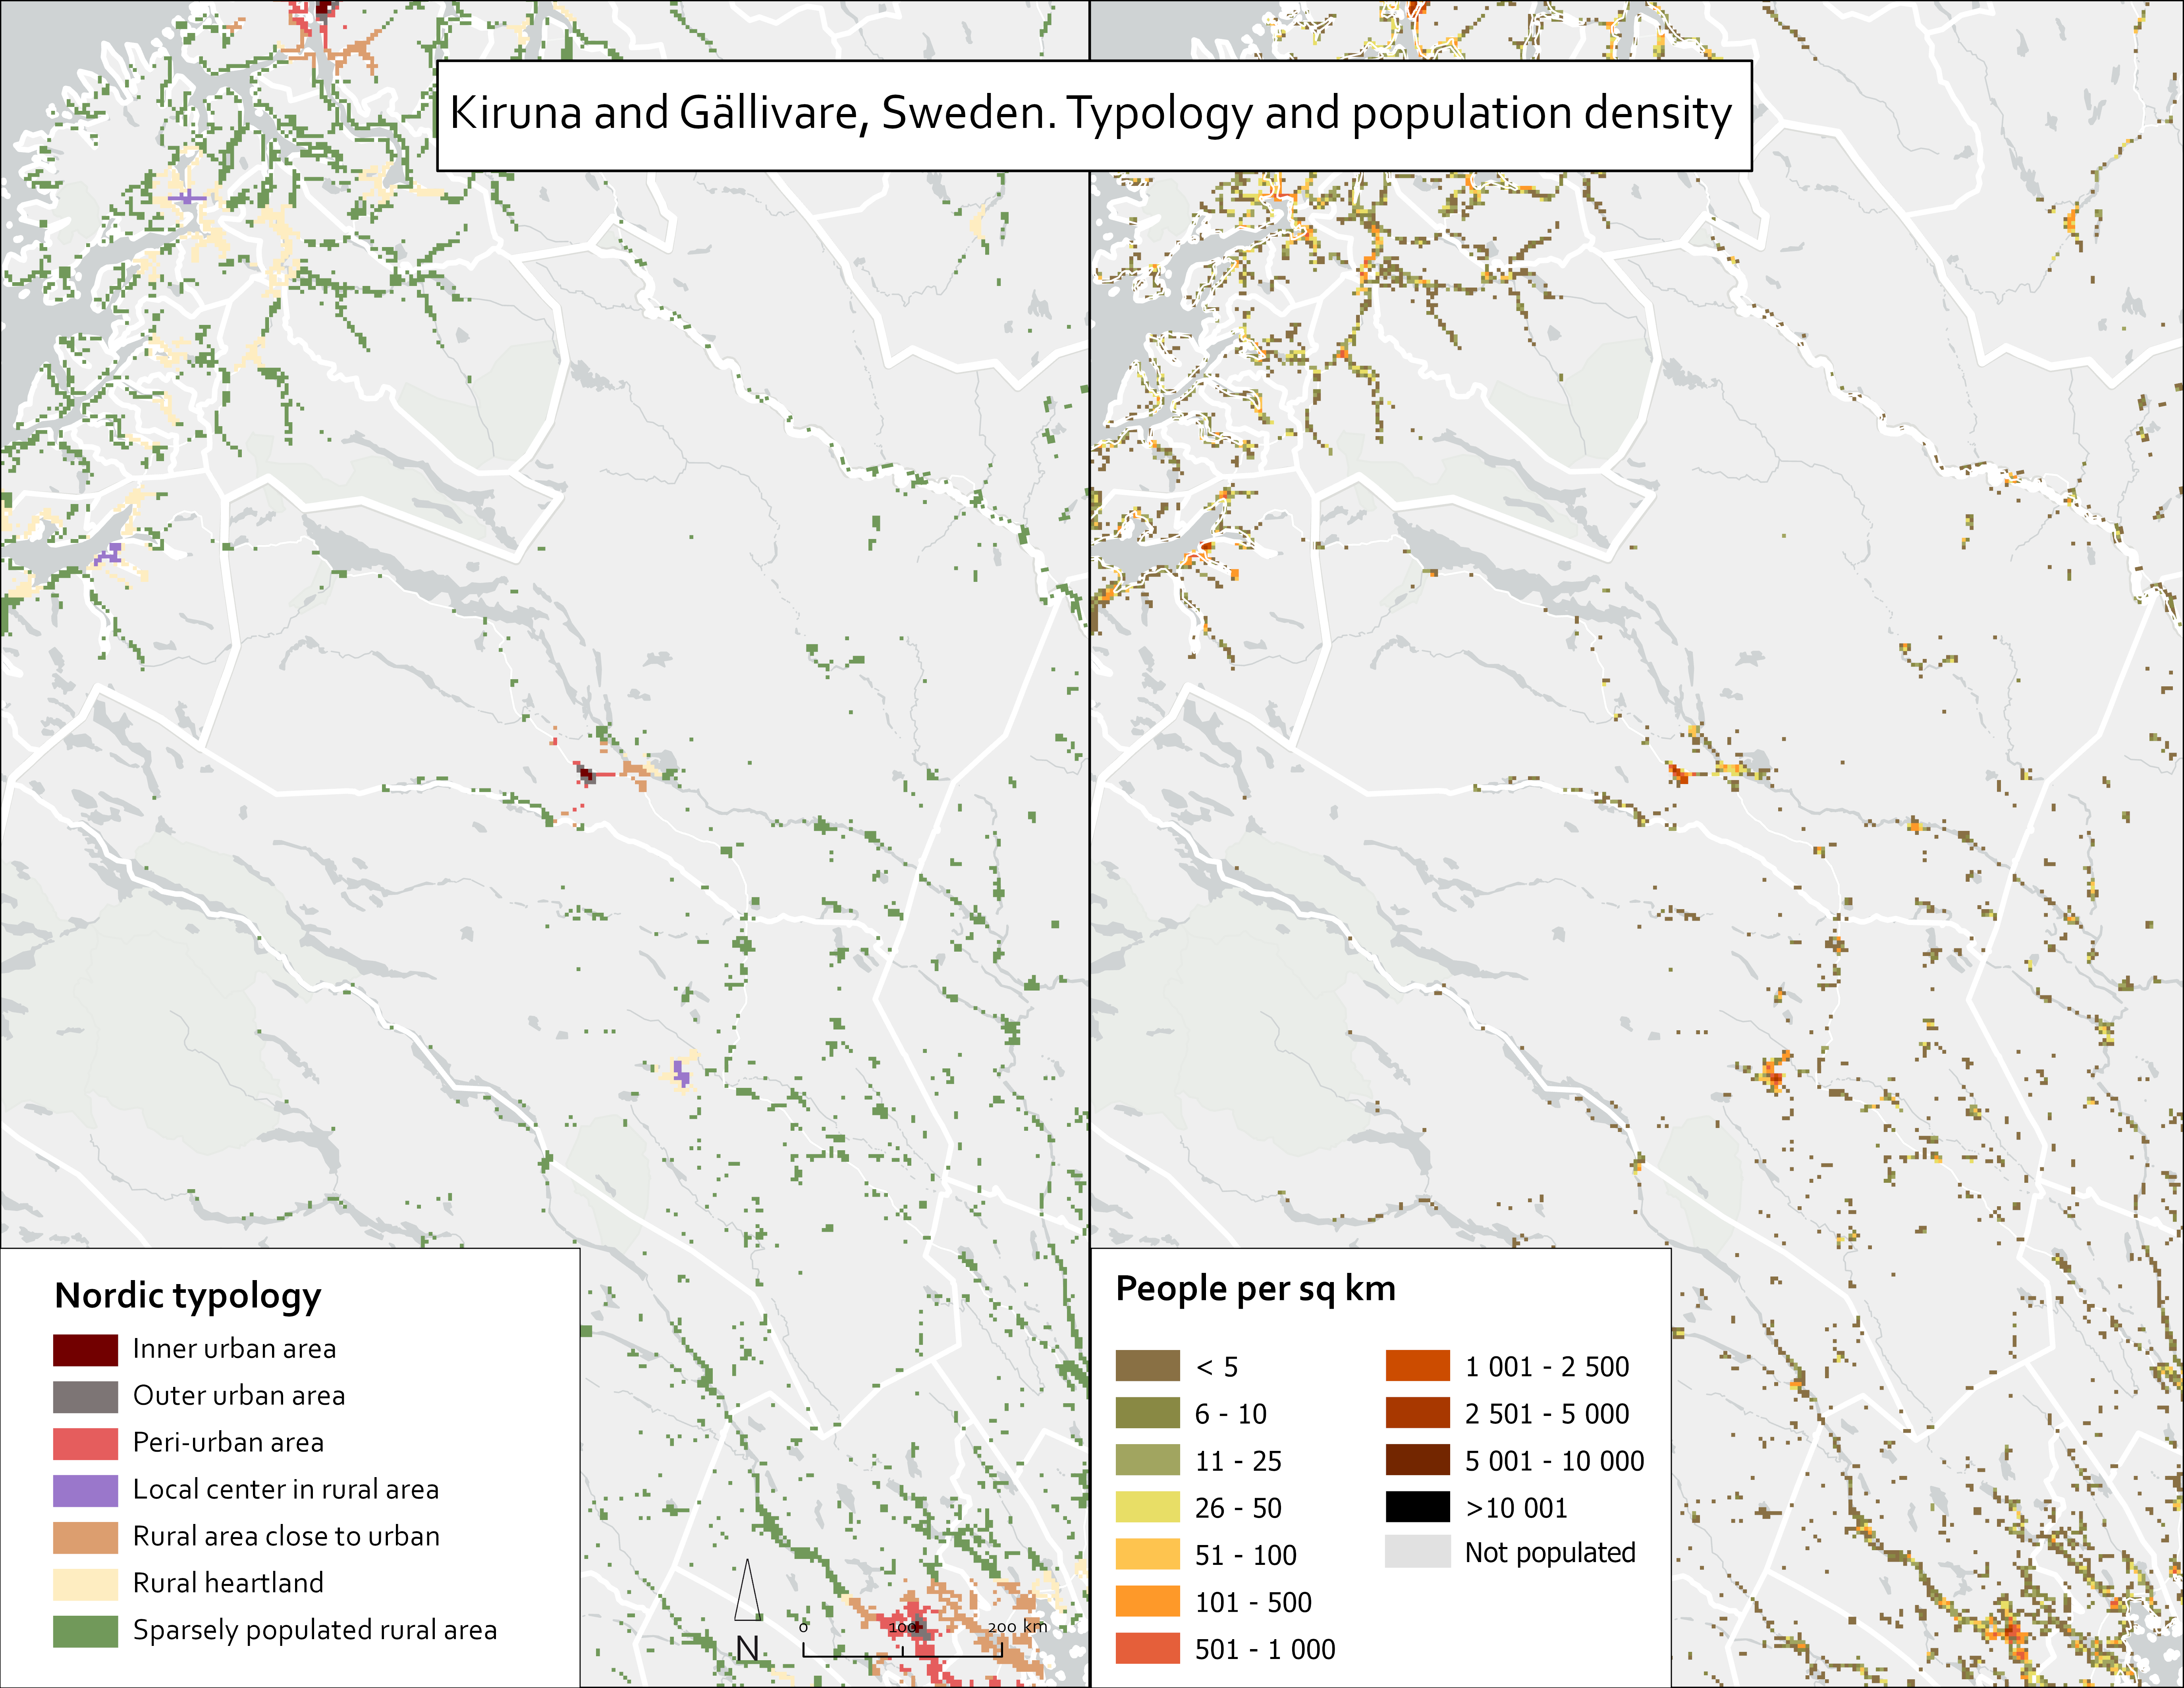
While the DEGURBA typology can be useful for more general comparisons of different types of regions or municipalities, in the Nordic countries where many municipalities are vast in size and sparse in population (also having great variation in population density patterns) this classification is rather coarse and does not properly reflect territorial differences at a granular level. For example, in northern Sweden, the municipalities of Kiruna and Gällivare are classified as intermediate according to the Eurostat classification while these municipalities largely consist of territories that are either sparsely populated or uninhabited, which can be seen in Figure 1 (below) and in Figure 12 (in Section 2.2).
Across Europe, including the Nordic countries, there are numerous national typologies that have been developed for various policy, analytical, and statistical purposes. These types of typologies often provide a more nuanced outlook on territorial differences within a specific country compared to the more general EU-wide classification, and they are in many cases used as support tools for policymaking or in research in the countries for which they have been developed (Stjernberg et al. 2023).
In the Nordic countries, these national classifications are most commonly based on municipalities as the territorial unit. For instance, the Danish Municipality groups (Kommunegrupper) typology classifies municipalities into five different classes based on population size in urban settlements and accessibility to jobs (capital municipalities; metropolitan municipalities; provincial municipalities; commuter municipalities; rural municipalities) (Statistics Denmark, 2018). Similarly, the Norwegian Centrality index (Sentralitetsindeks) classifies municipalities into six classes (most central municipalities; second most central municipalities; medium central municipalities 1; medium central municipalities 2; second least central municipalities; least central municipalities) based on their centrality, measured through access to jobs and services (Høydahl, 2017). Also, in the Classification of Swedish municipalities (Kommungruppsindelning), the typology includes three main groups (large cities and municipalities near large cities; medium-sized towns and municipalities near medium-sized towns; smaller towns/urban areas and rural municipalities) and municipalities are then further divided into a total of nine specific groups based on structural parameters such as population and commuting patterns (SKR, 2023). An overview of these key national typologies from the different Nordic countries is listed below:
Table 1. Key characteristics of select Nordic national typologies.
Country and typology | Background/ purpose | Areas of use | Data used | Number and names of classes |
|---|---|---|---|---|
Denmark: municipality groups | The typology was initiated and produced by Statistics Denmark to allow for various analysis from both urban and rural perspective. | The typology is mainly used as a tool for various analyses. | Population by settlement; data of employed (day and night population) at sub-municipal level, road network data with speed limits (to calculate accessibility). | Five classes (capital municipalities, metropolitan municipalities, provincial municipalities, commuter municipalities, rural municipalities). |
Finland: urban–rural classification | In the early 2010s, Finnish national authorities saw a need for a classification that better recognized the continuity between urban and rural areas and the characteristics of different areas. Hence, a grid-based classification was developed by the Finnish Environment Institute (SYKE) to replace a former municipality-based classification of urban and rural areas. | Used in various ways to support regional and rural development and policy in Finland. It has been used in several strategies and policy documents at national, regional, and municipal level, and for distributing development funds. Also, widely used as an analytical framework in research. | Various register-based data at grid level (250 x 250 m). Data sources include population, labour force, commuting, buildings, road network data from the Digiroad database and CORINE land-use data. | Seven classes (inner urban areas, outer urban areas, peri-urban areas, local centres in rural areas, rural areas close to urban areas, rural heartland areas, sparsely populated rural areas). |
Norway: centrality index | The typology was initiated by the Ministry of Local Government and Regional Development (KDD) to provide a more robust way of categorising municipalities based on centrality, to identify municipalities in need of support and measures. | The typology is used as a part of the KDD district index which is used to identify municipalities in need of measures and support. It is also used for various analyses and research with an urban–rural component. | Population, employment per sector, road network data with speed limits to allow accessibility calculations. | Six classes (most central municipalities; second most central municipalities; medium central municipalities 1; medium central municipalities 2; second least central municipalities; least central municipalities). |
Sweden: municipality grouping | This typology was developed by the Swedish Association of local authorities and Regions (SKR). The first version was produced in 2017 but already since the 1980s SKR have been making municipality groupings. The most recent version is from 2023. | The typology is used for analysis on different aspects of urban and rurality and to be able to compare similar municipalities with each other. | Population, population in built up area, out-commuting as share of night population, out-commuting to city as share of night population, biggest out commuting municipality, in- commuting as share of day population, number of overnight stays, turnover in trade, turnover in hotels, turnover in restaurants. | The typology consists of two levels. First level: three classes: (cities and municipalities close to cities; bigger towns and municipalities close to bigger towns; smaller towns/built-up areas and rural municipalities). Second level: nine classes (cities; commuting municipality close to city; bigger towns; commuting municipality close to bigger towns; low commuting municipality close to bigger towns; smaller towns/built-up-areas; commuting municipality close to smaller towns; rural municipality; rural municipality with tourism). |

One of the advantages of basing typologies on administrative units such as municipalities, as in the previous examples, is that these units are well known and established. This means that it may be easier to communicate the results and relate these to policy purposes. Various statistical data are also produced at the level of municipalities, which means that these data can be easily incorporated and used for analysis based on the territorial classifications. These types of typologies, based on administrative areas, can thus be useful, for example, in statistical monitoring of development trends for supporting policy development. Nevertheless, there are also several limitations with these types of classifications. One of the main shortcomings is that these types of territorial classifications do not take account of markedly different types of areas within a single administrative unit and, for example, most Nordic municipalities are likely to include both urban and rural areas. For instance, according to the DEGURBA classification, the municipality of Uppsala is defined as urban, but it is also the Swedish municipality that has the greatest number of residents living in rural areas (Uppsala, 2023). In typologies where municipalities are classified as either urban or rural, such internal differences within the municipality are thus not reflected. To overcome these limitations and to acquire a more fine-grained and nuanced understanding of territorial differences, within and across administrative borders, the use of more spatially detailed data provides many advantages in more accurately distinguishing urban from rural areas.
Against this background, one of the main starting points for developing a new Nordic urban–rural typology was to use data at grid level. The decision to utilise grid data was also based on the insights gained from an earlier Nordregio study by Stjernberg & Penje (2019), which applied grid data for studying population change dynamics across the Nordic countries and identified that grid-level statistics can reveal trends that are less evident or entirely concealed at more general levels of analysis. An important source of work that guided this work came from the Finnish urban–rural classification (Kaupunki-maaseutuluokitus), mainly developed by the Finnish Environment Institute (SYKE), which relies on spatially detailed data to enable a more fine-grained classification of urban and rural areas (SYKE, 2020).
Among the European and Nordic countries, Finland is a rare exception in that the Finnish urban–rural classification, which is the most established and commonly used typology for policy and analytical purposes, is constructed at grid level rather than being based on administrative units. Also, in Finland, information on regional development has traditionally relied on data bound to different administrative units. In the early 2010s national authorities saw a need for a classification that better recognised the continuity between urban and rural areas and the characteristics of different areas. Hence, a new typology for classifying Finnish territories, independent of administrative boundaries, was created to replace a former municipality-based classification of urban and rural areas (see Figure 4). The typology was originally published in 2013 and revised in 2020, and has been widely used to support regional and rural policy in Finland and for different research purposes during the past decade.

The Finnish typology uses various register-based data at grid level (250 x 250 m), including data on population, labour force, commuting, buildings, road network, and coordination of information on the environment (CORINE) land-cover data. These data have been used to calculate different measures of quantity, density, accessibility, intensity, and versatility to describe the degree to which different areas are urban and rural (SYKE, 2021). On this basis, all Finnish territories have then been classified into seven different classes: inner urban areas, outer urban areas, peri-urfban areas, local centres in rural areas, rural areas close to urban areas, rural heartland areas, and sparsely populated rural areas.
This classification has been used in various ways to support regional development and policy in Finland. For example, it has been used in several strategies and policy documents at national, regional, and municipal level. It has also been utilized for distributing development funds within the framework of LEADER and for distributing public support for businesses in rural settings and for shops in sparsely populated rural areas. Furthermore, the typology has been widely used as an analytical framework in research for analysing different spatial phenomena and for describing differences between different types of urban and rural areas. Because the typology uses fine-grained data and classifies territories at (250 x 250 m) grid level, it provides significantly more spatially detailed analysis than previous administratively based territorial classifications.
Towards a Nordic urban–rural typology
The reason for developing a new Nordic urban–rural typology was to create an analytical tool that would help to better understand settlement patterns and trends as well as other phenomena in different types of areas, ranging from the sparsest rural areas to the densest urban areas. Based on this, the Finnish urban–rural classification was thought to be the most relevant. While it was evident that it would not be possible to directly scale the Finnish typology to the Nordic level, it was possible to incorporate several of its core elements and use the Finnish typology as a stepping stone for developing a Nordic grid-based urban–rural typology based on harmonised Nordic definitions and criteria.
Important key considerations in the early stages of the work were to determine which data sources to use for constructing the typology and what spatial resolution and specific reference grid to use. While the Finnish classification relies on a wide range of different data sources, it was not feasible to apply the same specific data at the Nordic level. This was partly related to the high costs of grid data but also to the fact that most of these datasets were produced nationally, often following different classifications, and hence not harmonized for cross-national comparisons. It was therefore decided to use data that were free-of-charge and openly available, while acknowledging that the availability of free data would differ between the countries. A key advantage of this approach was that future updates or adjustments would be easier to obtain and be more cost effective.
Regarding the spatial resolution of the typology, it was clear early in the process that it would be preferable to use data at 1 x 1 km grid level rather than at 250 x 250 m, as used in the Finnish typology. One of the arguments for this is that most freely available national grid data are primarily at 1 x 1 km grid level. In addition, it was also acknowledged that constructing a Nordic typology would require making some simplifications to the original Finnish model, and that a 250 x 250 m resolution would be too detailed for this purpose.
After choosing the typology on a 1 x 1 km grid size, it was necessary to decide which specific reference grid to use. Here, there were two options. The first would have been to use Eurostat’s grid (EPSG:3045) for all countries. An advantage of this option is that all countries are classified according to a uniform grid, and there are no discontinuities at the national borders. The other option was to use national grid available from each country. An advantage of the latter approach was that some of the data were freely available for the national grids. This approach would also be better suited for further use in the different Nordic countries, as grid-level data produced according to the national grid systems could directly be incorporated into the typology for further analysis. Ultimately, all calculations were initially made using the national grids for each country. In the final stages of the work, the calculations from the national grids were then converted into the Eurostat grid.
Based on these considerations, it was decided to develop the Nordic typology based on the Finnish urban–rural classification; however, it was evident that the approach would need to be tailor-made for the purpose. It was also decided to generate the same seven territorial classes as used in the Finnish typology, including maintaining the same class names. Thus, it was decided to develop a Nordic urban–rural typology containing the following seven territorial classes: urban areas, outer urban areas, peri-urban areas, local centres in rural areas, rural areas close to urban areas, rural heartland areas, sparsely populated rural areas.
Based on an assessment of the existing data sources possible for constructing the typology, it was possible to include the five Nordic countries (Denmark, Finland, Iceland, Norway, Sweden) and Åland, whereas it would not be feasible to include Greenland and the Faroe Islands in the typology owing to lack of data.