2.2. Migration in the Nordic labour market 1954-2024
In this section we will look into migration between the Nordic countries. We will consider both migration flows and migration stocks, starting with migration flows.
Migration flows between the Nordic countries 1954-2024
In the 19th and 20th centuries, the Nordic countries were countries characterised by emigration, with overseas migration to the US in large part. That changed after the Second World War. In particular, Sweden – which did not take part in the war – took in refugees from the other Nordic countries as well as from the Baltic countries. The economic growth created a large demand for labour, especially in Sweden. That, together with the free mobility between the Nordic countries that was formalised in 1954, opened the doors to labour migration (Pedersen, Røed & Wadensjö, 2008).
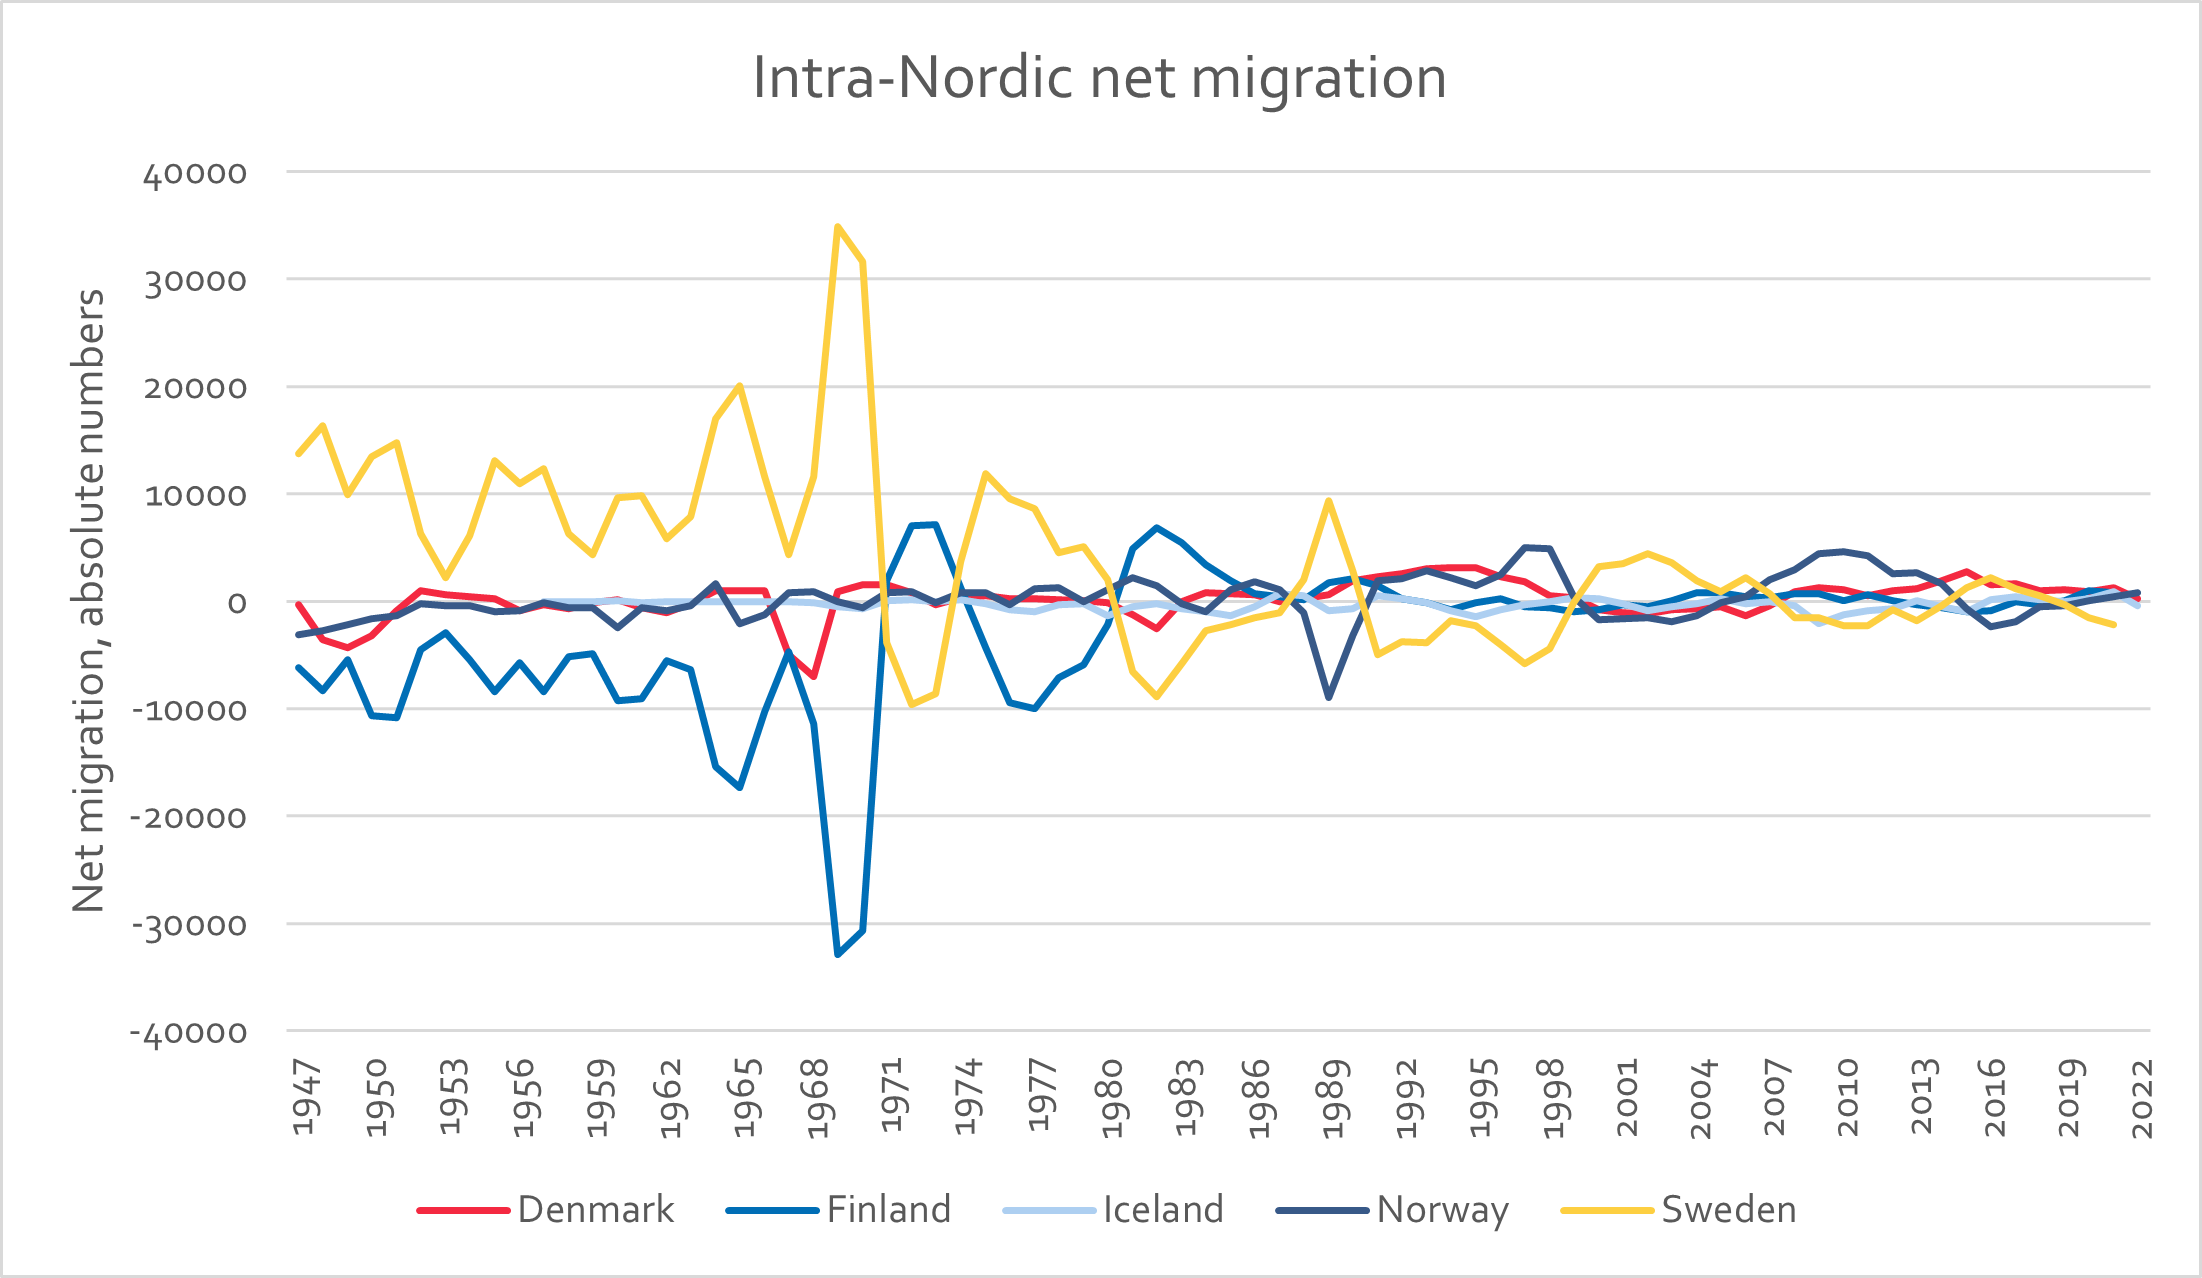
Figure 4 shows intra-Nordic net migration between 1947 and 2022, i.e. the net sum of people migrating to another Nordic country minus those emigrating to another Nordic country.
The availability of data varies between countries, with data available in Sweden from 1947, in Norway from 1957 and in Denmark from 1980. In the other countries the data are available from 1990. However, since out-migration to one country is in-migration to another, the Swedish, Norwegian and Danish data could also be used for the other countries. Data for the self-governing territories is not always accessible and has been displayed when available.
Figure 4. Intra-Nordic net migration 1947-2022.
Data source: Own calculations based on Nordic Statistics (from 1990) and NSIs (before 1990)
Data source: Own calculations based on Nordic Statistics (from 1990) and NSIs (before 1990)
Sweden
Figure 5. Immigration to Sweden from the other Nordic countries.
Data source: Own calculations based on Nordic Statistics (from 1990) and NSIs (before 1990)
Data source: Own calculations based on Nordic Statistics (from 1990) and NSIs (before 1990)
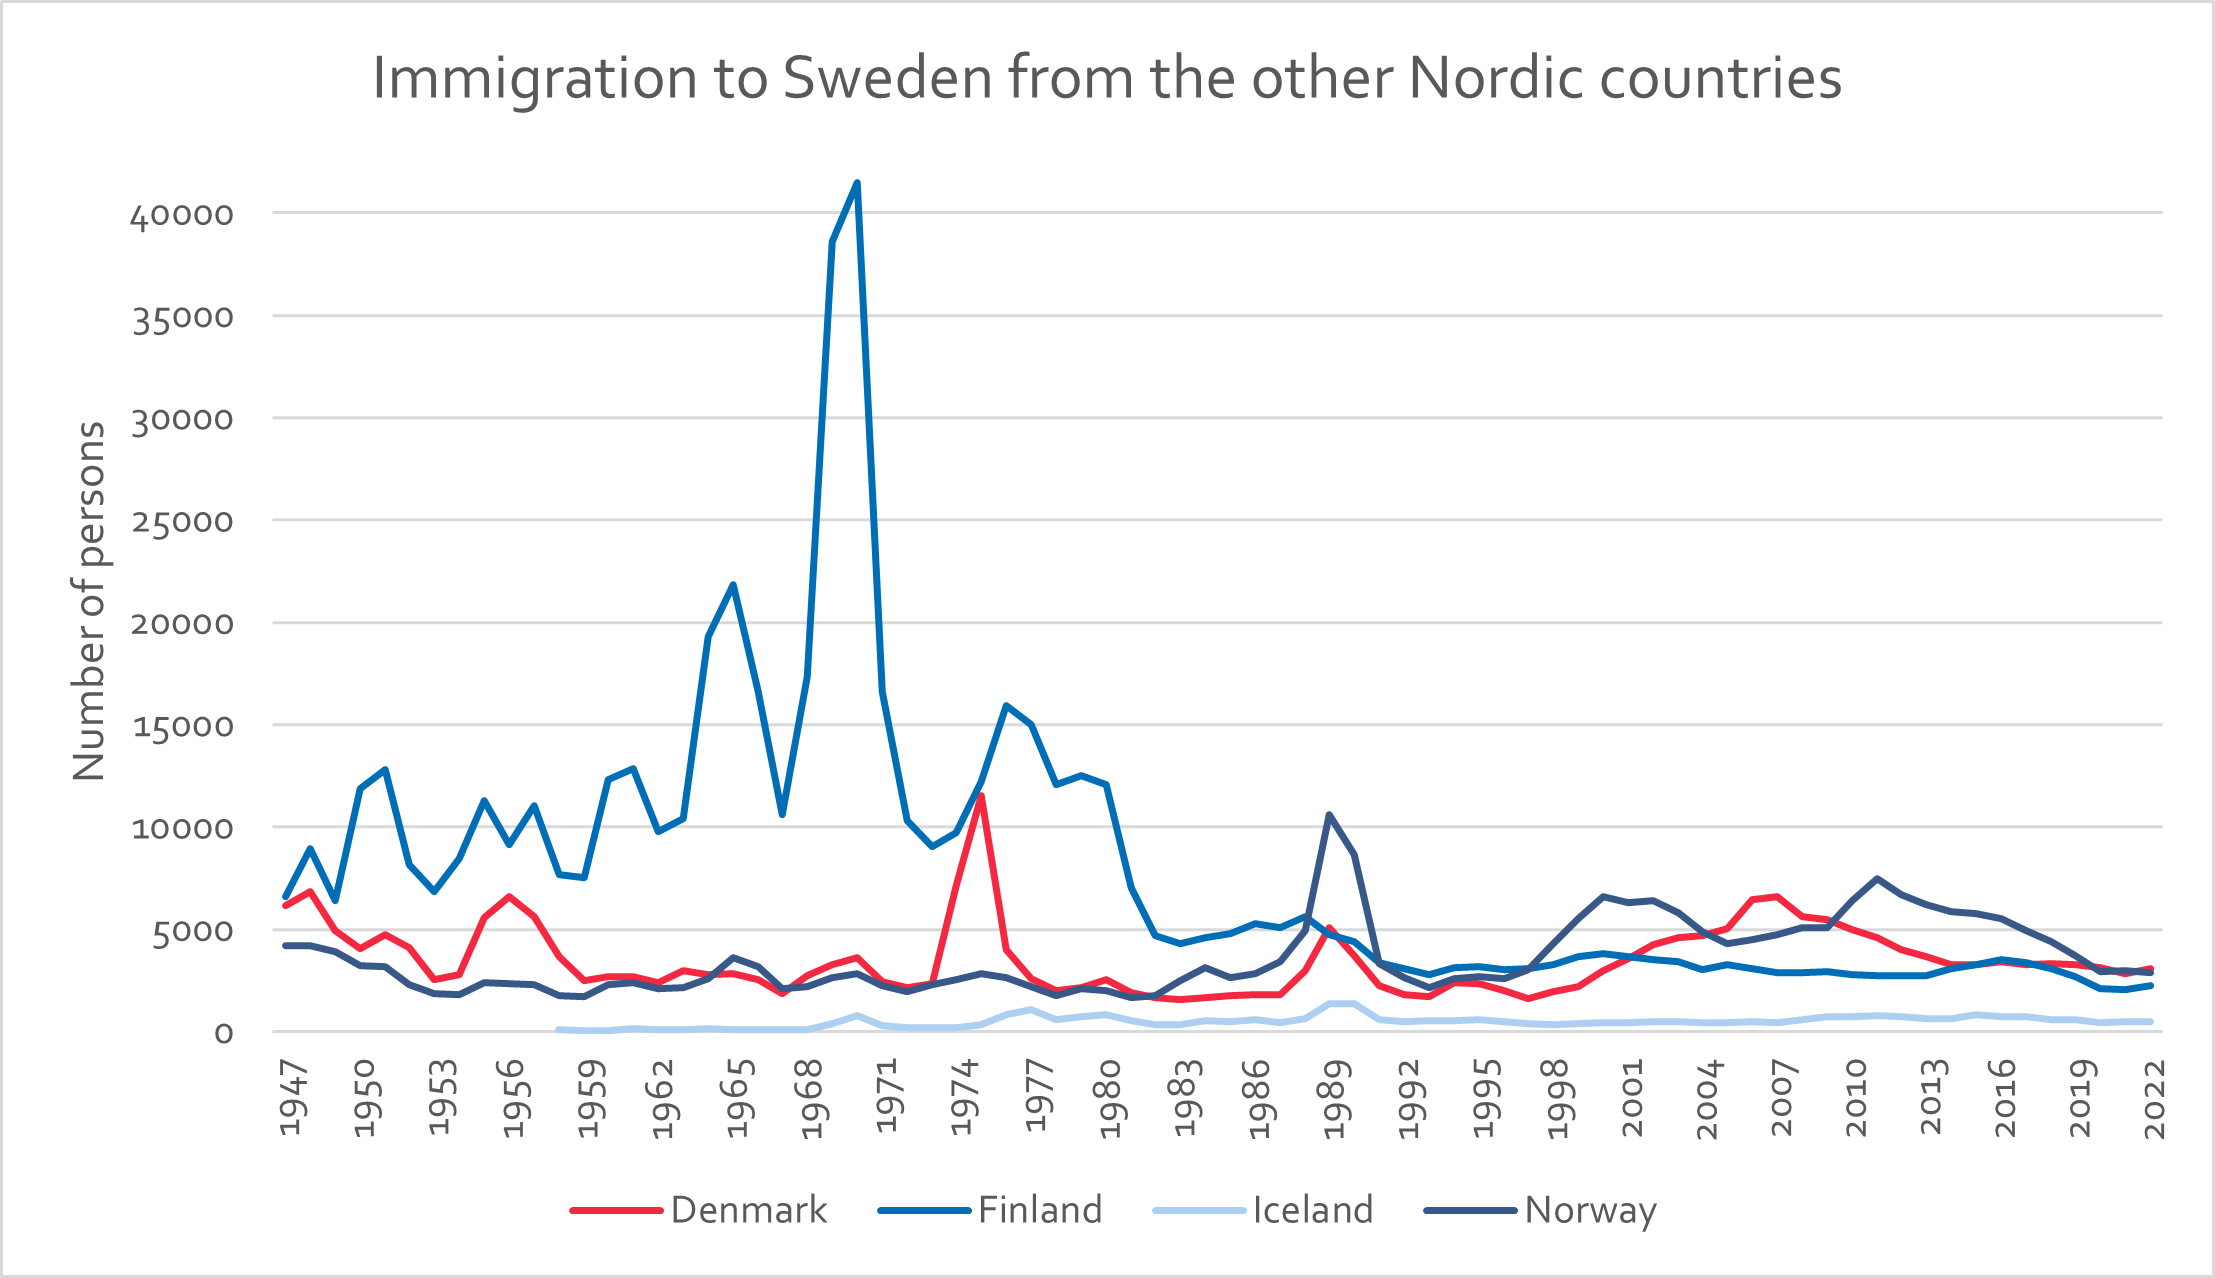
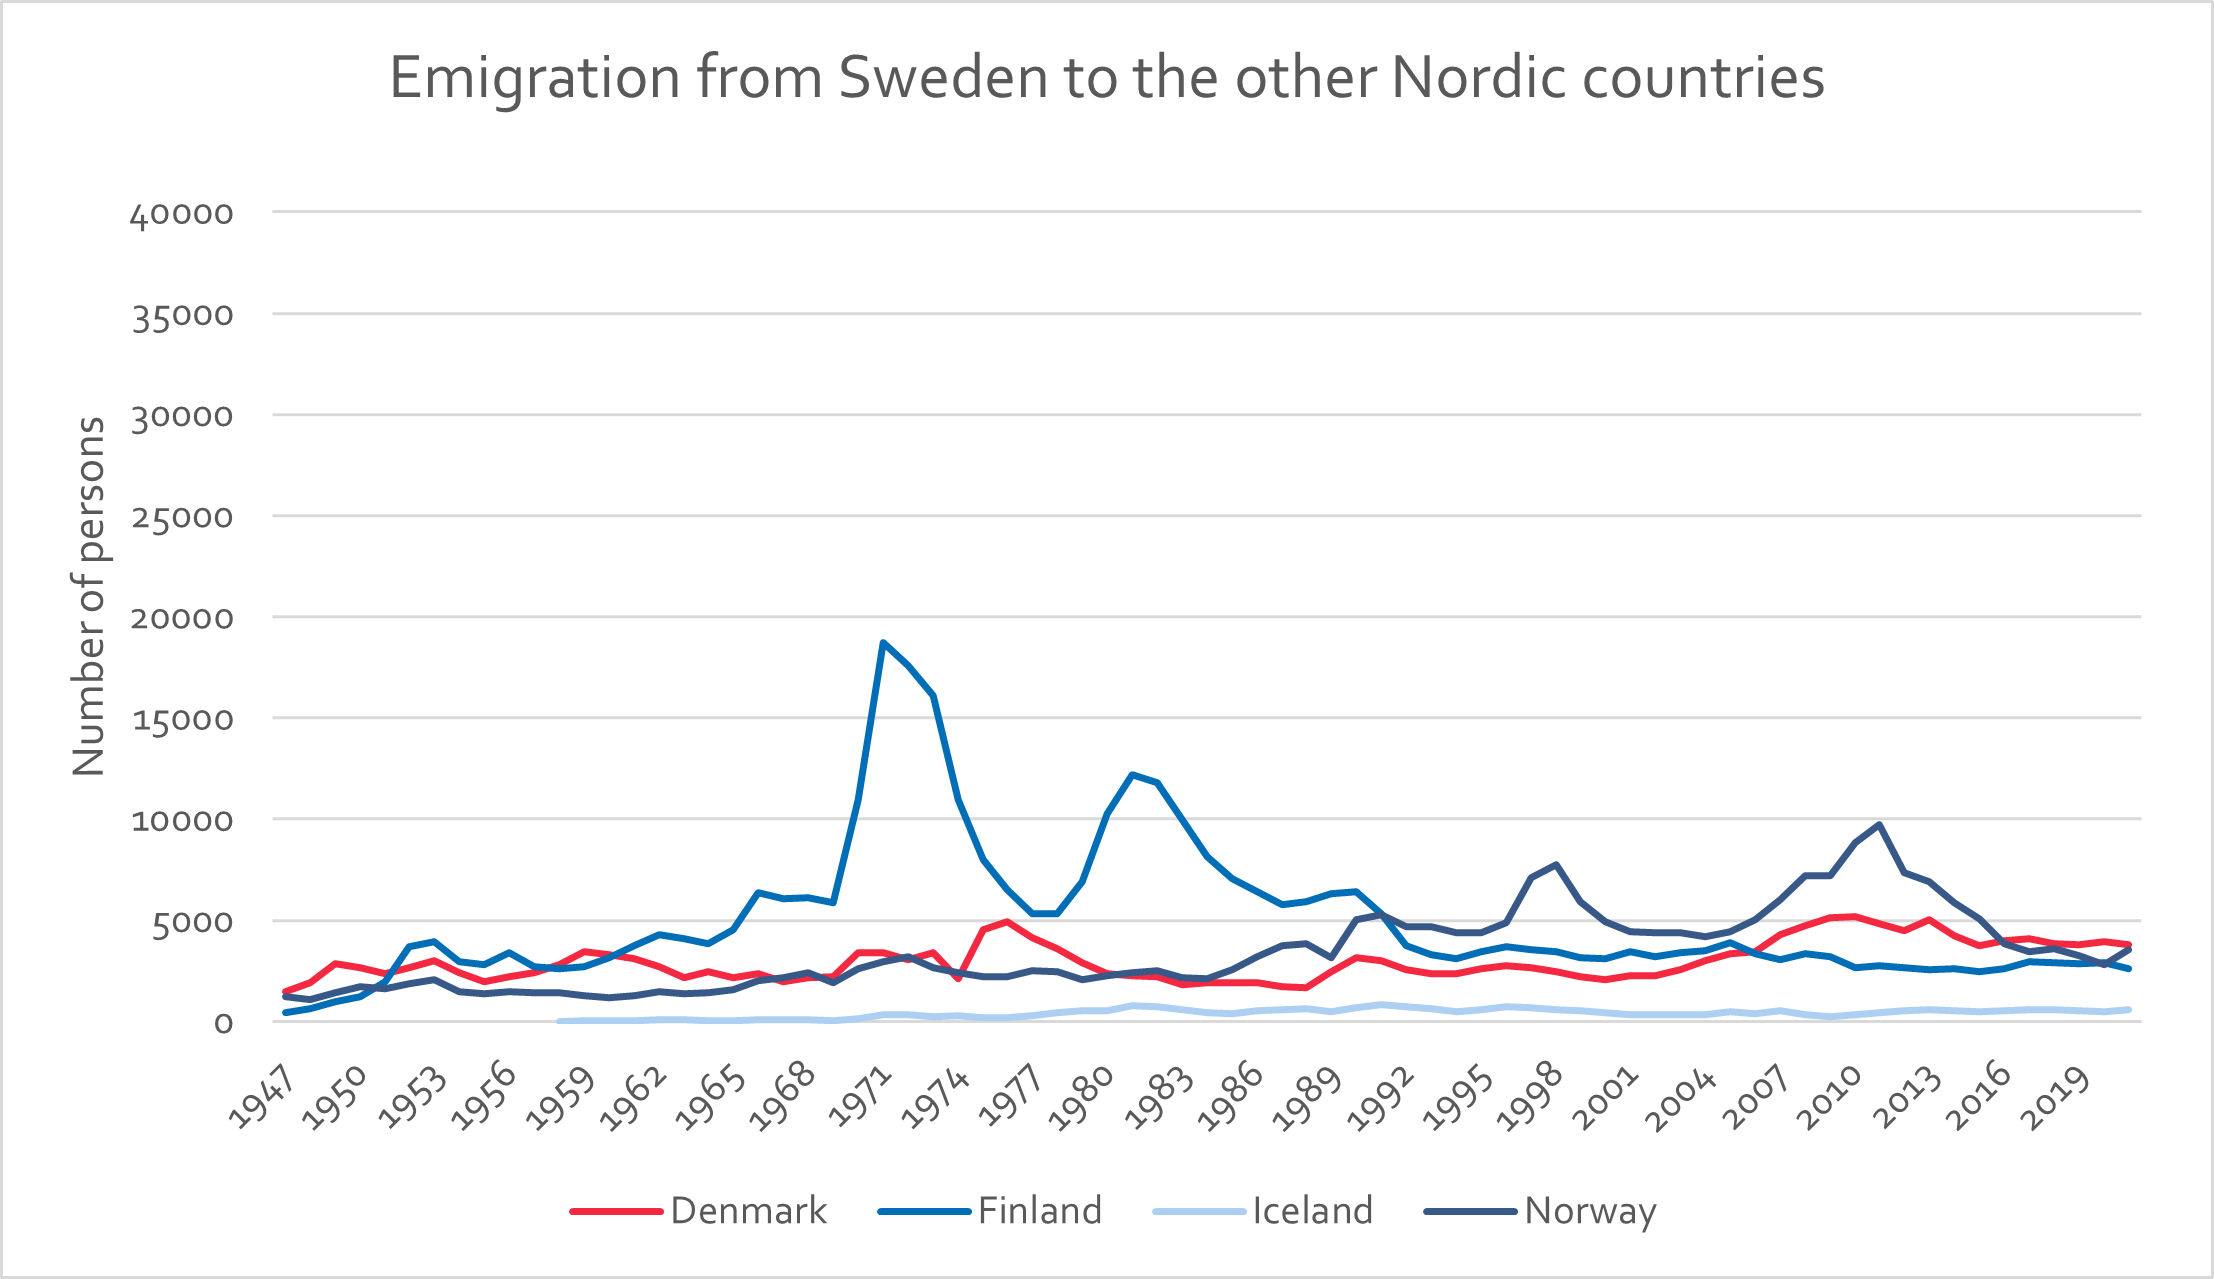
Figure 6. Emigration from Sweden to the other Nordic countries.
Data source: Own calculations based on Nordic Statistics (from 1990) and NSIs (before 1990)
Data source: Own calculations based on Nordic Statistics (from 1990) and NSIs (before 1990)
As mentioned previously, the Swedish economy grew rapidly after the war and there was a need for more workers, with many immigrating from southern Europe and from the Nordic countries, especially Finland. Since free movement was in place even before 1954 in practice, the data do not show any immediate effects of the free mobility agreement.
Immigration remained high in the 1960s. However, at the end of the decade, there was political will to have stronger control of migration. From 1967, citizens outside the Nordic Region were no longer allowed to apply for work permits while in Sweden and employers now increasingly turned to Finland to find workers. Immigration from Finland peaked in 1969 and 1970 at around 40,000 people per year.
Part of the peak in 1969 and 1970 might be explained by a change in the registration of Nordic migration, which means that some of those who were registered in those years might have immigrated earlier (Pedersen, Røed & Wadensjö, 2008).
Besides migration from Finland, immigration from Denmark in 1975 stands out. It was mainly caused by increased unemployment in Denmark after the oil crisis. (Pedersen, Røed & Wadensjö, 2008). In 1989, migration from Norway increased, from fewer than 5,000 people in 1988 to over 10,000 in 1989, but then decreased to around 3,000 people from 1991. Explanations for the increase include a downturn in the Norwegian economy at the end of the 1980s, a time when the Swedish economy was still booming (Johansson, Persson & Rissander, 1997).
From 1998, immigration from Norway to Sweden increased again and Norway has since been the country accounting for the highest number of immigrants with a high share of Swedish citizens, indicating that migration from Norway is driven by re-migration to a large extent.
Danish immigration to Sweden increased in the mid-00s after the opening of the Öresund Bridge, peaking in 2007 at 6,615 immigrants from Denmark, of which less than 20% was Swedish re-migration. One explanation for the Danish migration was more restrictive rules for family reunification for international refugees in Denmark from 2002 compared to Sweden, meaning that some Danes moved to Sweden to be able to reunite with their partner, i.e. so-called “love refugees” (Pedersen, Røed & Wadensjö, 2008; Bratu, Dahlberg & Nikolka, 2022).
While Sweden has been a net receiver of migrants from the other Nordic countries since 1954, the largest part of emigration has been re-migration of people who immigrated earlier, such as in the 1970s and 1980s when many re-migrated to Finland. In fact, re-migration to Finland makes up the second largest migration flow since 1954. In general, a lot of intra-Nordic mobility has been temporary and a high share have re-migrated. (Pedersen, Røed & Wadensjö, 2008; Gravesen et al., 2003).
Norway
Figure 7: Immigration to Norway from the other Nordic countries.
Data source: Own calculations based on Nordic Statistics (from 1990) and NSIs (before 1990)
Data source: Own calculations based on Nordic Statistics (from 1990) and NSIs (before 1990)
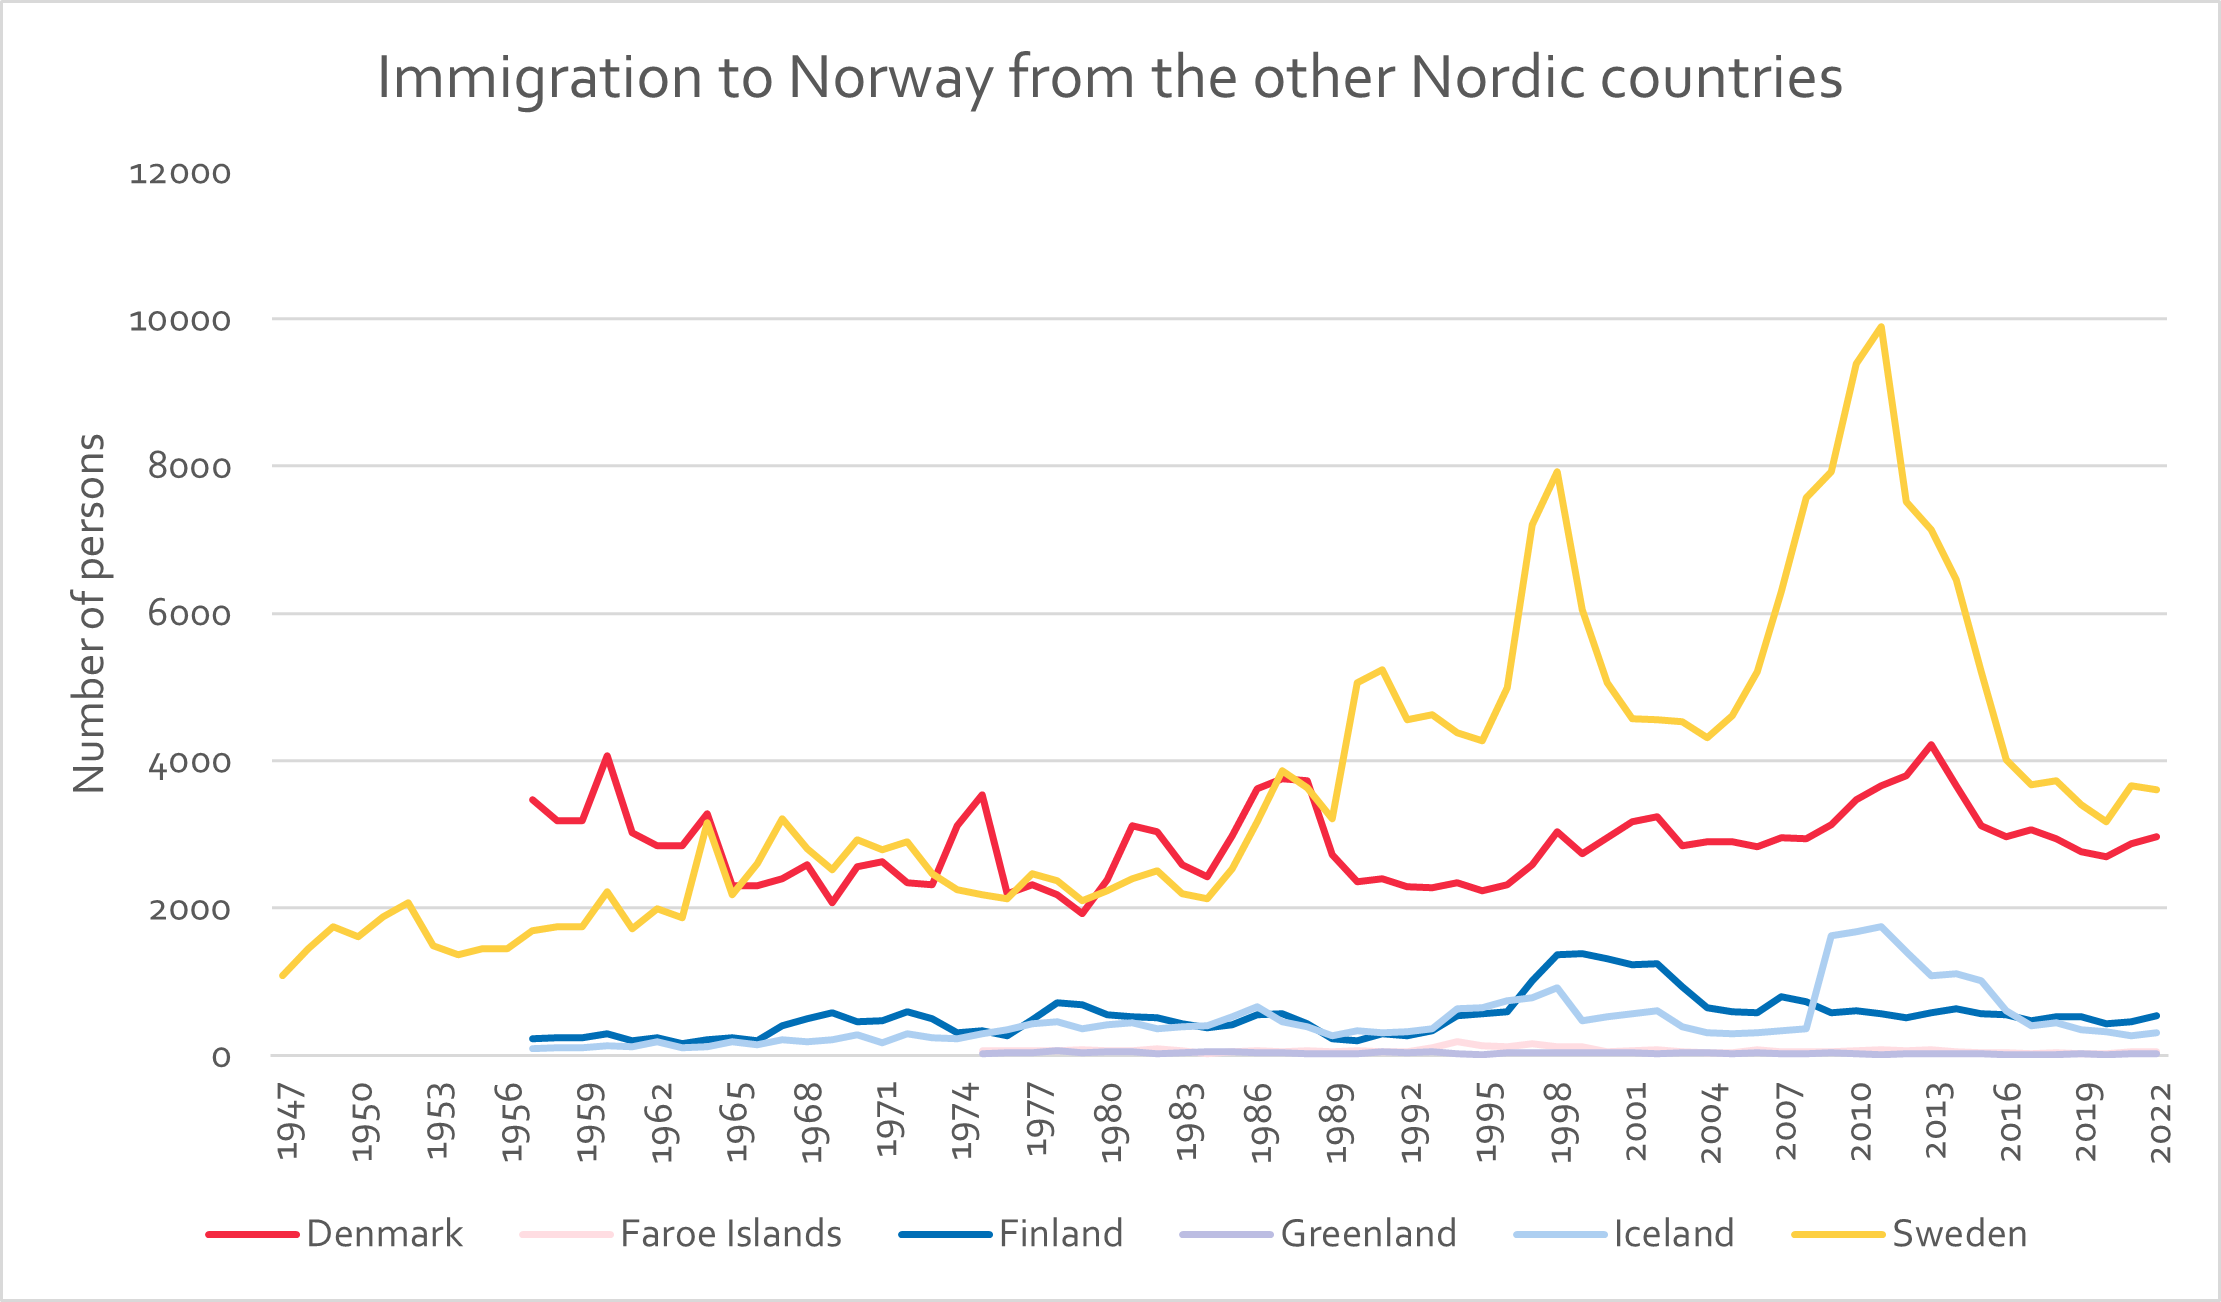
Figure 8: Emigration from Norway to the other Nordic countries.
Data source: Own calculations based on Nordic Statistics (from 1990) and NSIs (before 1990)
Data source: Own calculations based on Nordic Statistics (from 1990) and NSIs (before 1990)
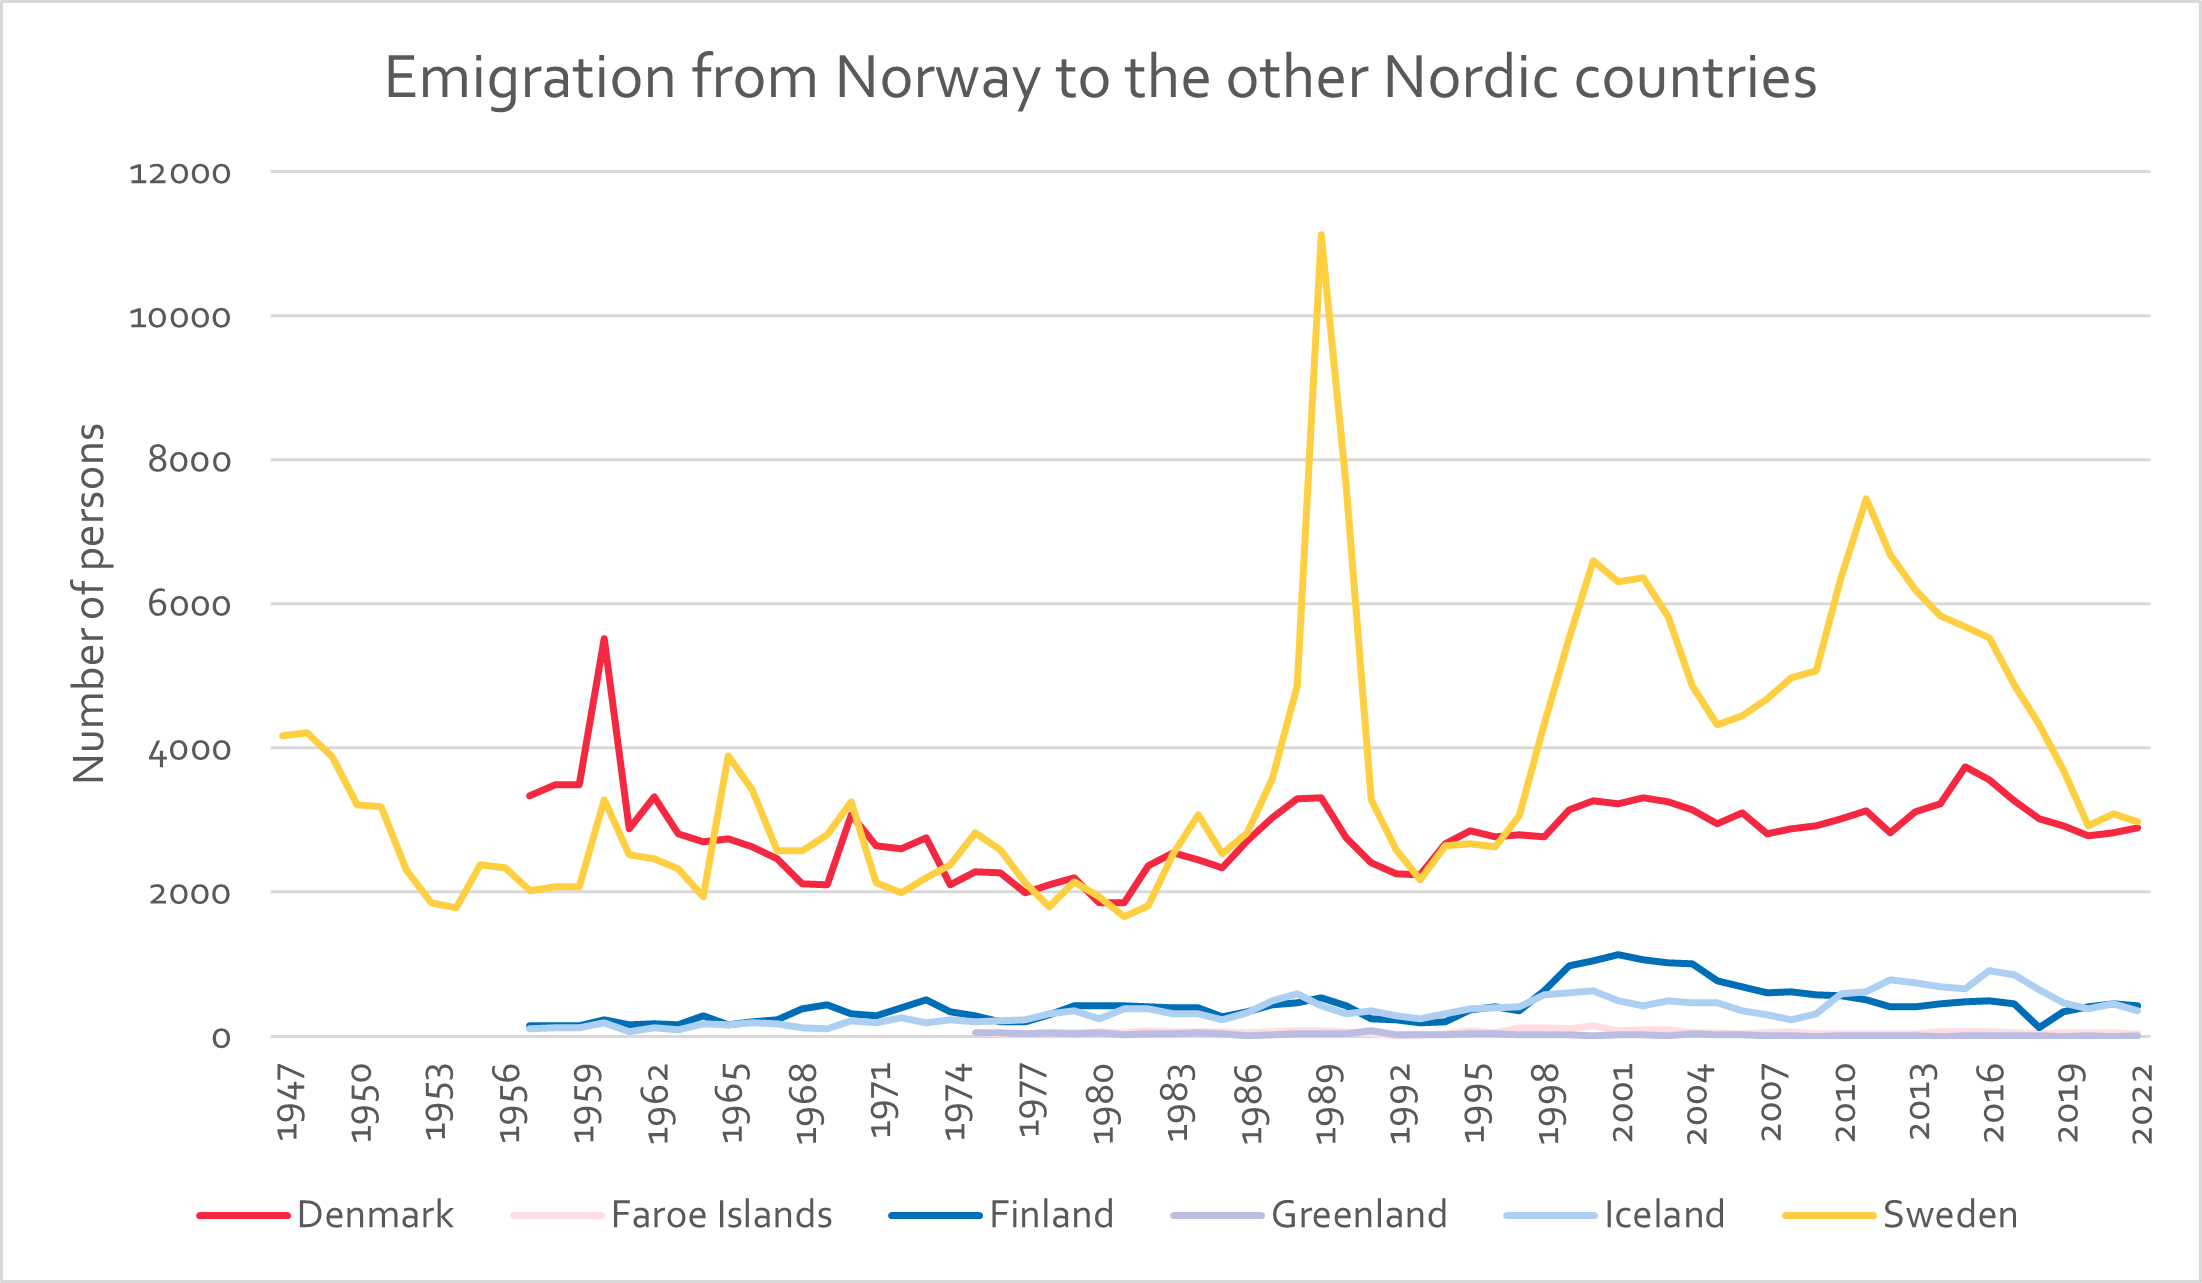
Intra-Nordic migration patterns in Norway have been fairly stable over the years, with some exceptions, which mainly concern migration to and from Sweden. The biggest peak was in 1989 when over 11,000 people migrated to Sweden. As explained earlier, that coincided with a downturn in the Norwegian economy and many of those soon moved back to Norway. Of the migration from Sweden in 1990 and 1991, more than 70% were Norwegian citizens moving back to Norway.
Two other peaks of Swedish immigration to Norway, in 1997 and 2010-2011, were also followed by two waves of emigration, indicating that most people that immigrate only stay for a short period. Since 2013 there has been a steep decline in immigration from Sweden to Norway. That decline is also apparent in the number of Swedes that are working in Norway. The number peaked in 2013 and afterwards decreased somewhat until the pandemic. Since the pandemic the number of Swedes working in Norway has increased again.
Danish emigration and immigration to Norway is the second largest group and has been remarkably stable over time, with immigration ranging from 2,000 to 4,000 people per year and emigration of around 2,000 to 3,000 people for the majority of the time period.
Denmark
Figure 9: Immigration to Denmark from the other Nordic countries.
Data source: Own calculations based on Nordic Statistics (from 1990) and NSIs (before 1990)
Data source: Own calculations based on Nordic Statistics (from 1990) and NSIs (before 1990)
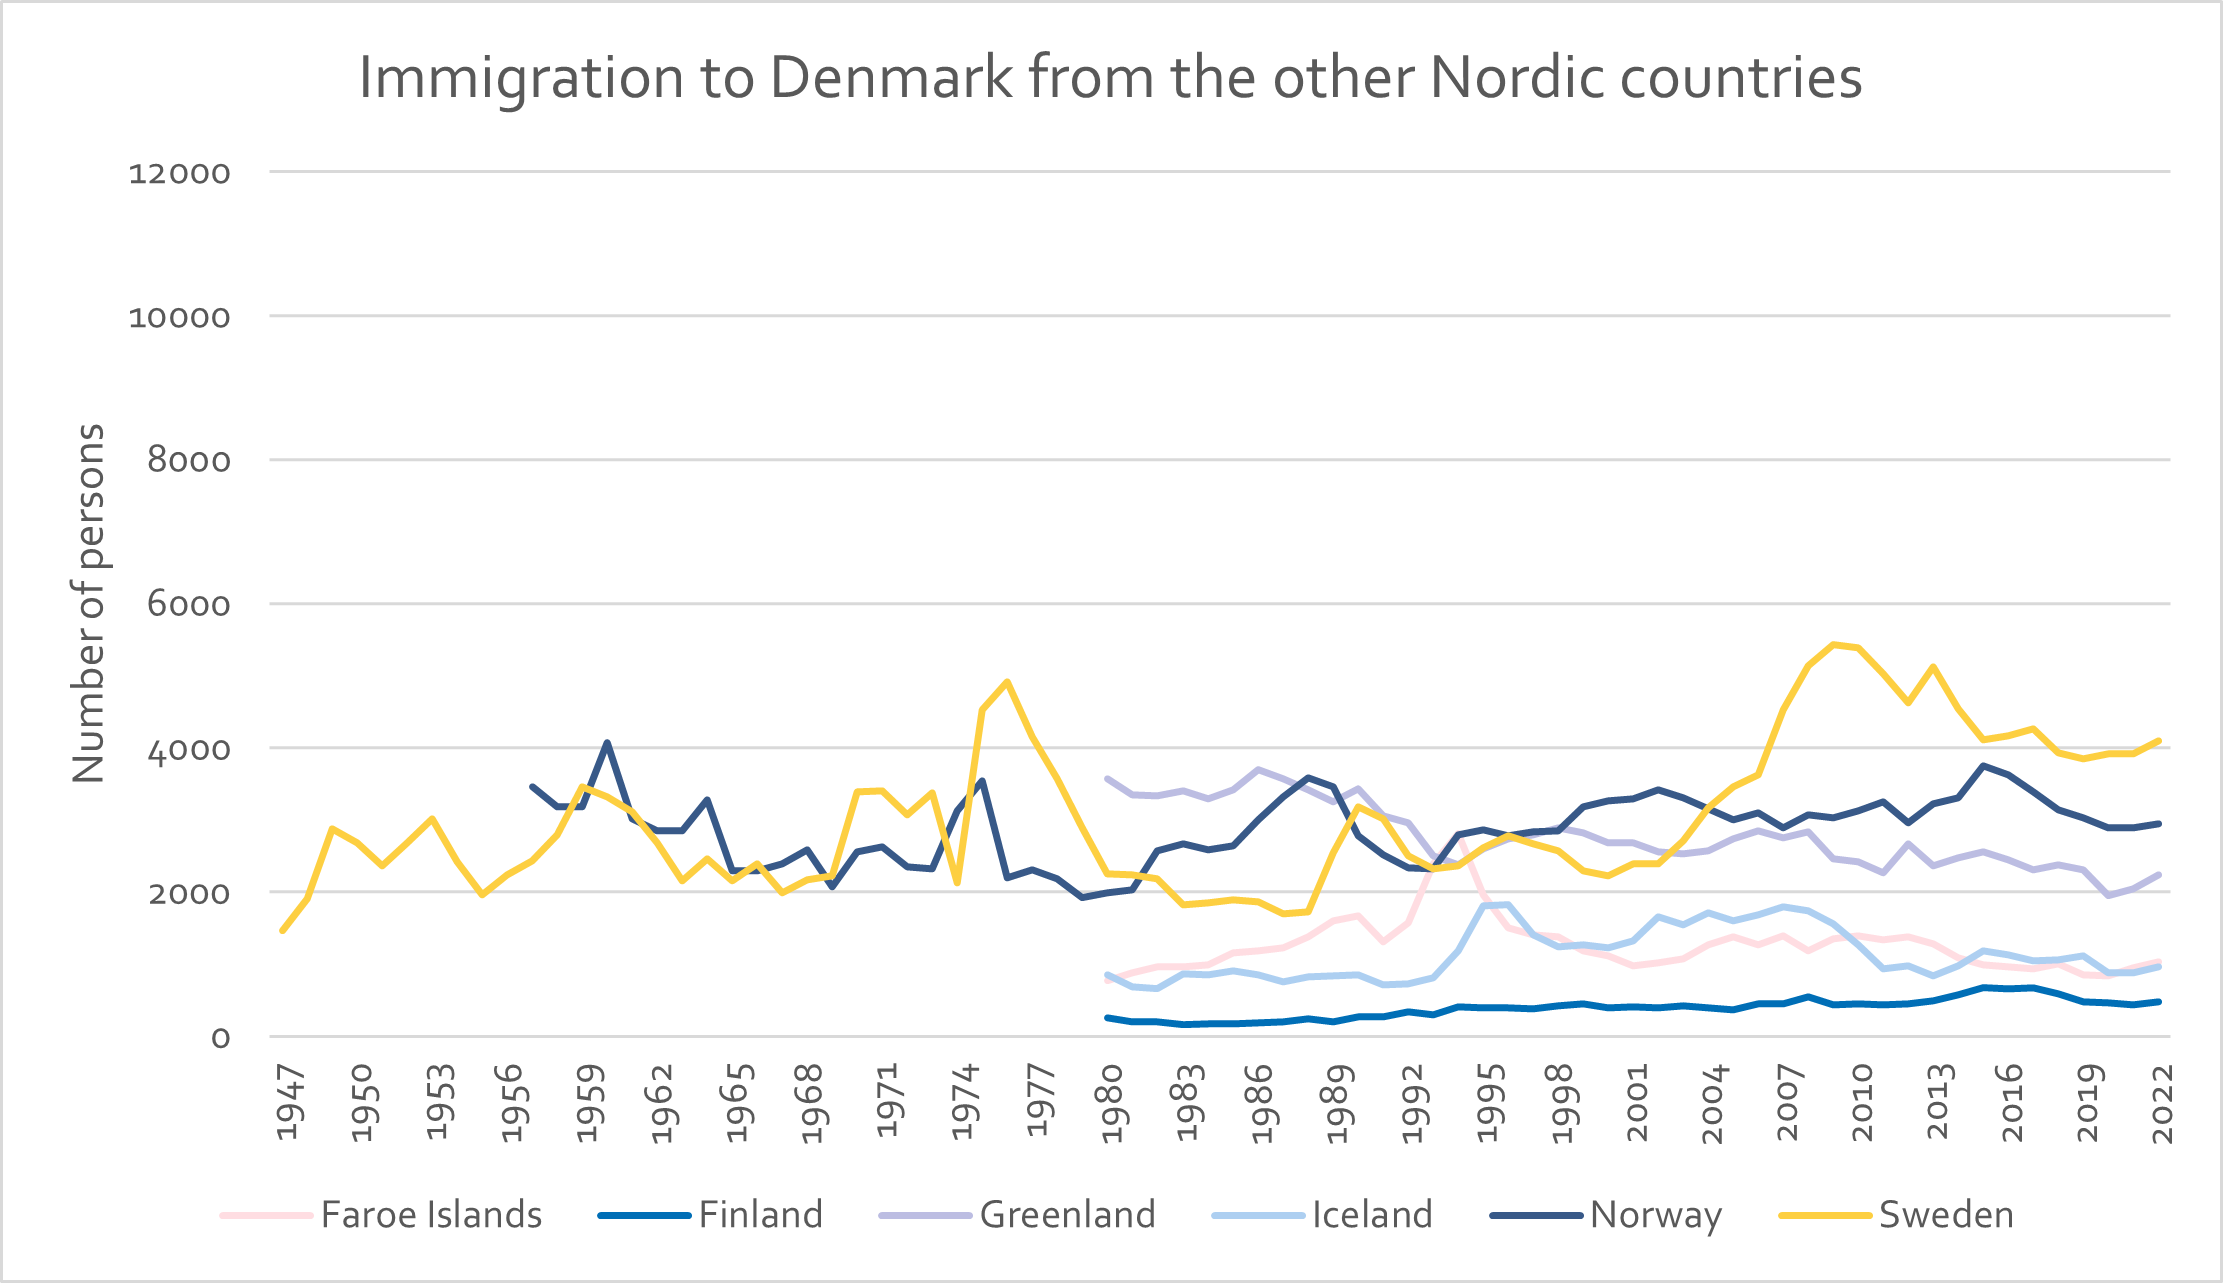
Figure 10: Emigration from Denmark to the other Nordic countries.
Data source: Own calculations based on Nordic Statistics (from 1990) and NSIs (before 1990)
Data source: Own calculations based on Nordic Statistics (from 1990) and NSIs (before 1990)
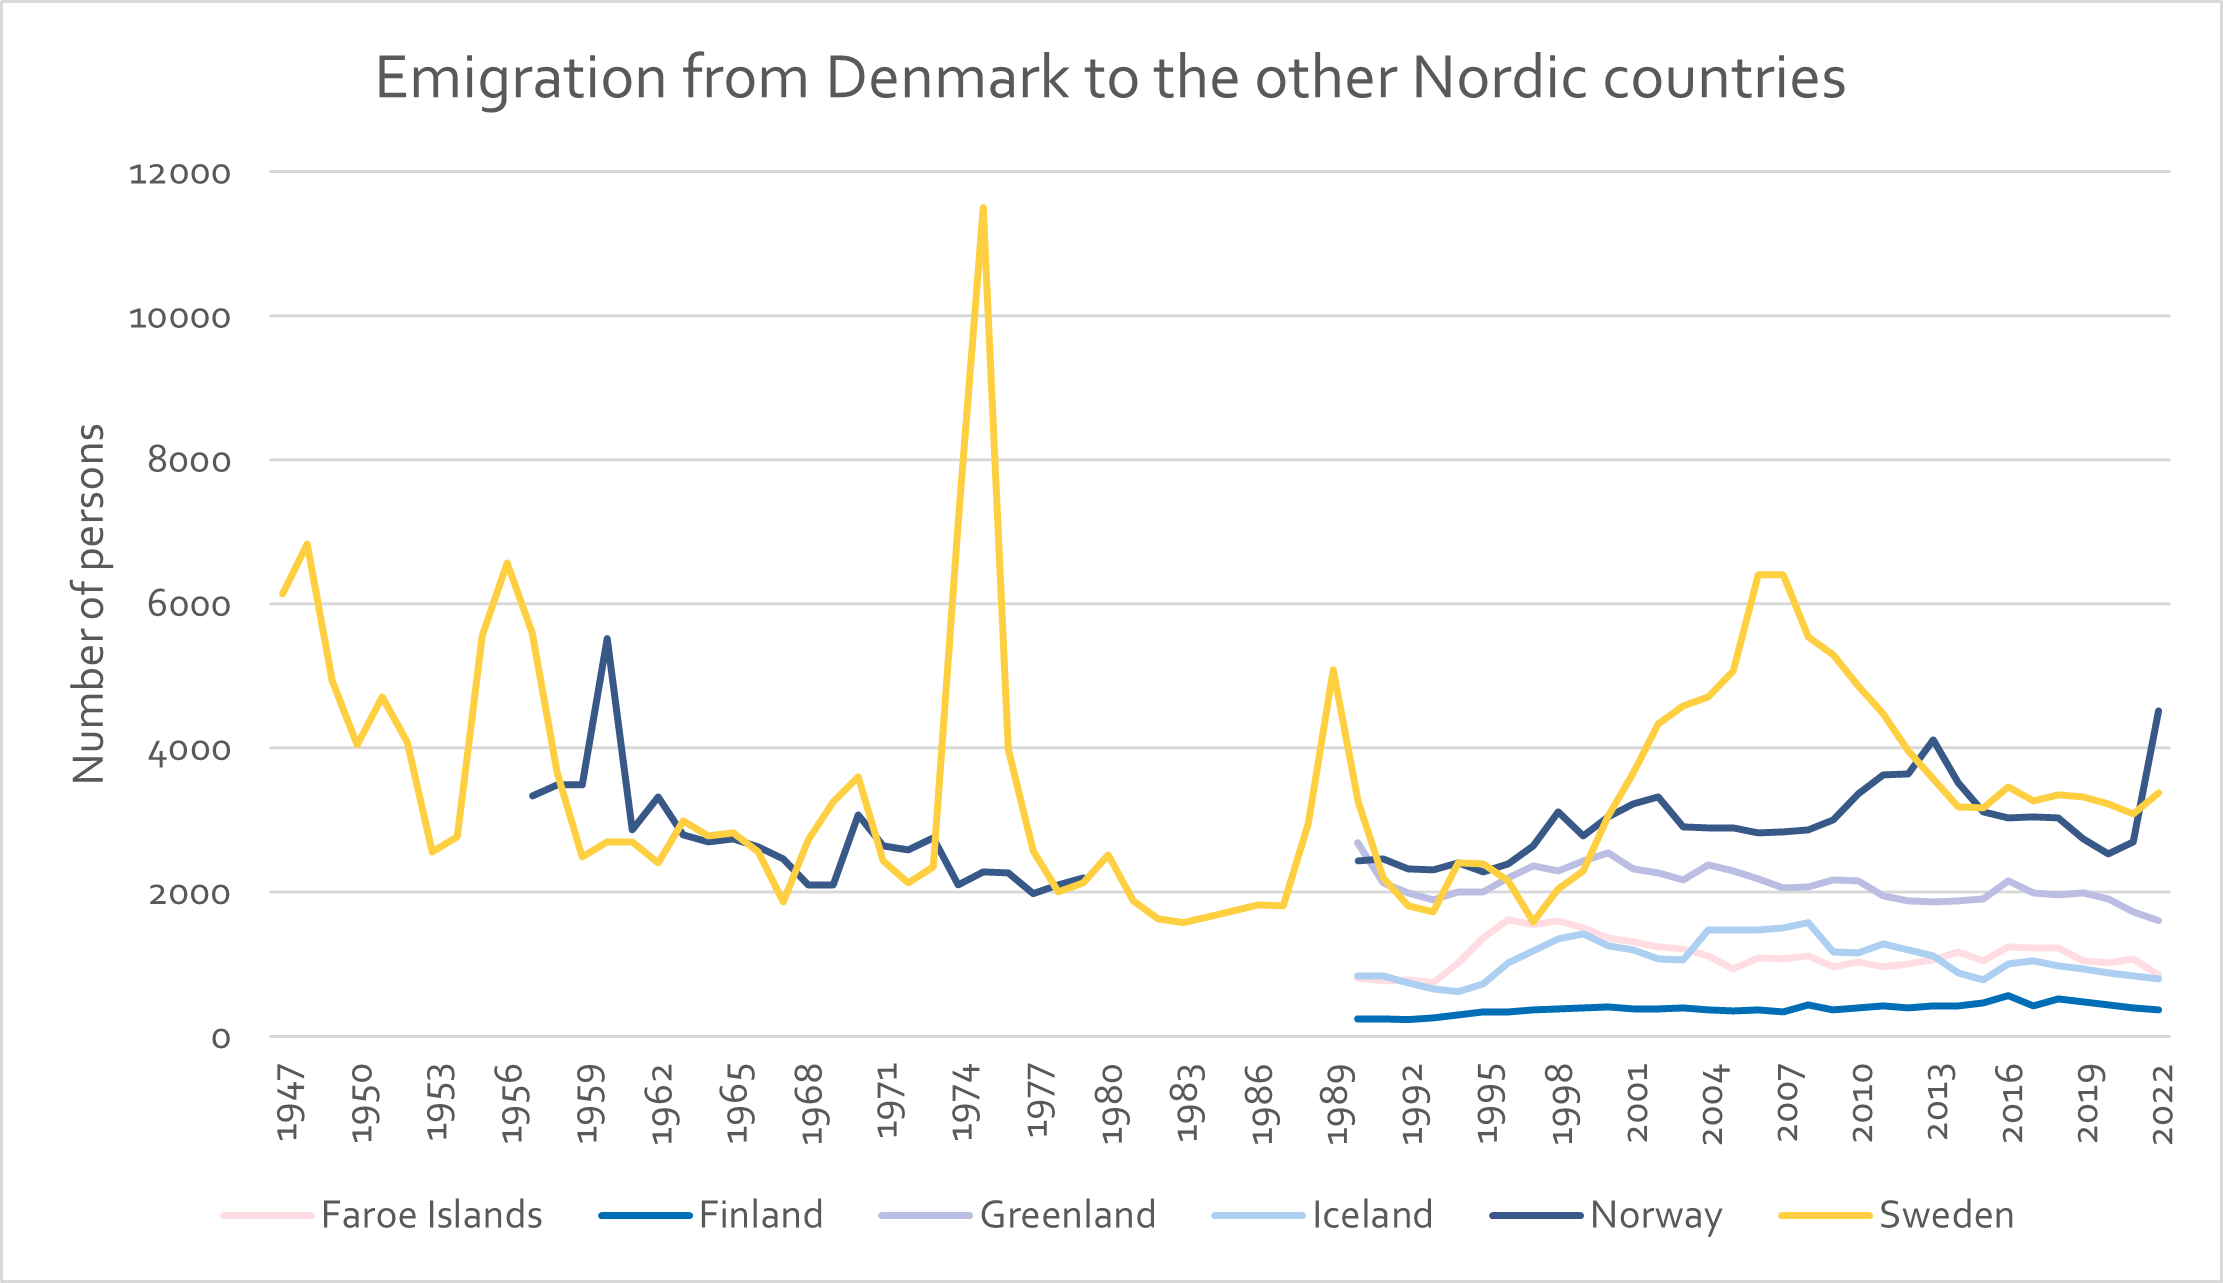
The biggest migration flow from Denmark was the emigration to Sweden in 1975, when almost 12,000 people emigrated.
For Denmark we only have full coverage of data on immigration from 1980 and data on emigration from 1990. The data from Norway and Sweden have been used to look at the migration patterns from these countries over a longer time period. Because of the smaller flows the picture looks more scattered than for Sweden, Finland and Norway.
Norway accounts for the second largest group of migrants to and from Denmark. However, what mainly stands out in Denmark is the high immigration from Greenland and, to a lesser extent, from the Faroe Islands. Although the figure has decreased somewhat over time, around 2,000 to 3,000 people move from Greenland to Denmark annually. Around 1,000 per year immigrate from the Faroe Islands. There was a clear peak in 1993-1995; in 1994 almost 3,000 people immigrated to Denmark, amounting for more than 6% of the whole Faroese population. That immigration was caused by an economic decline in the Faroe Islands, with mainly young people emigrating (Minorityrights, n.d.).
Finland
Figure 11: Immigration to Finland from the other Nordic countries.
Data source: Own calculations based on Nordic Statistics (from 1990) and NSIs (before 1990)
Data source: Own calculations based on Nordic Statistics (from 1990) and NSIs (before 1990)
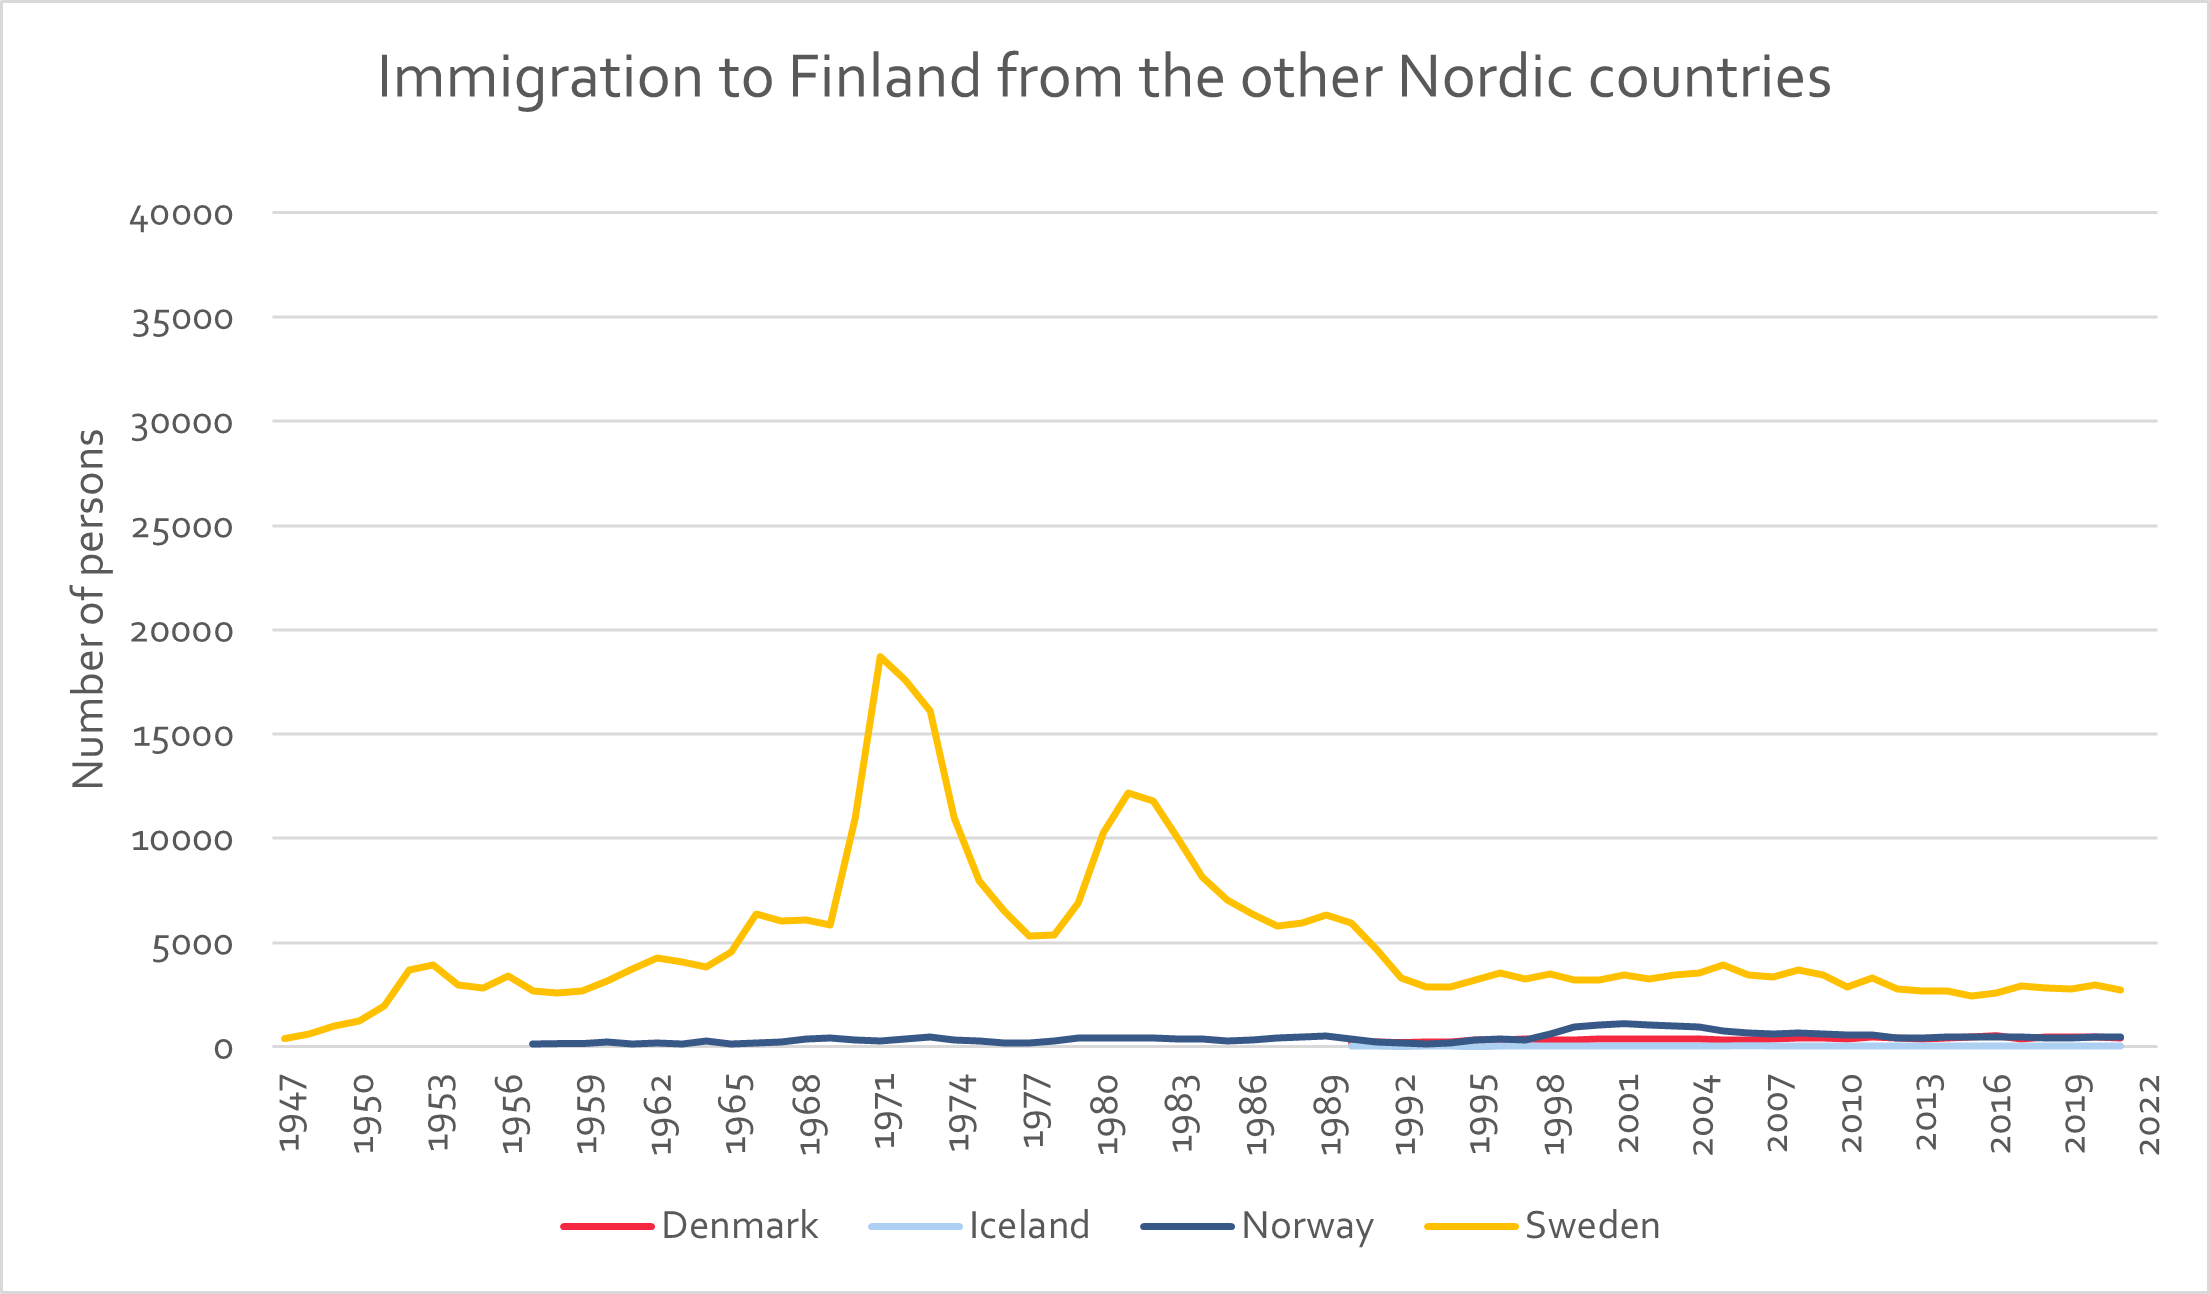
Figure 12: Emigration from Finland to the other Nordic countries.
Data source: Own calculations based on Nordic Statistics (from 1990) and NSIs (before 1990)
Data source: Own calculations based on Nordic Statistics (from 1990) and NSIs (before 1990)
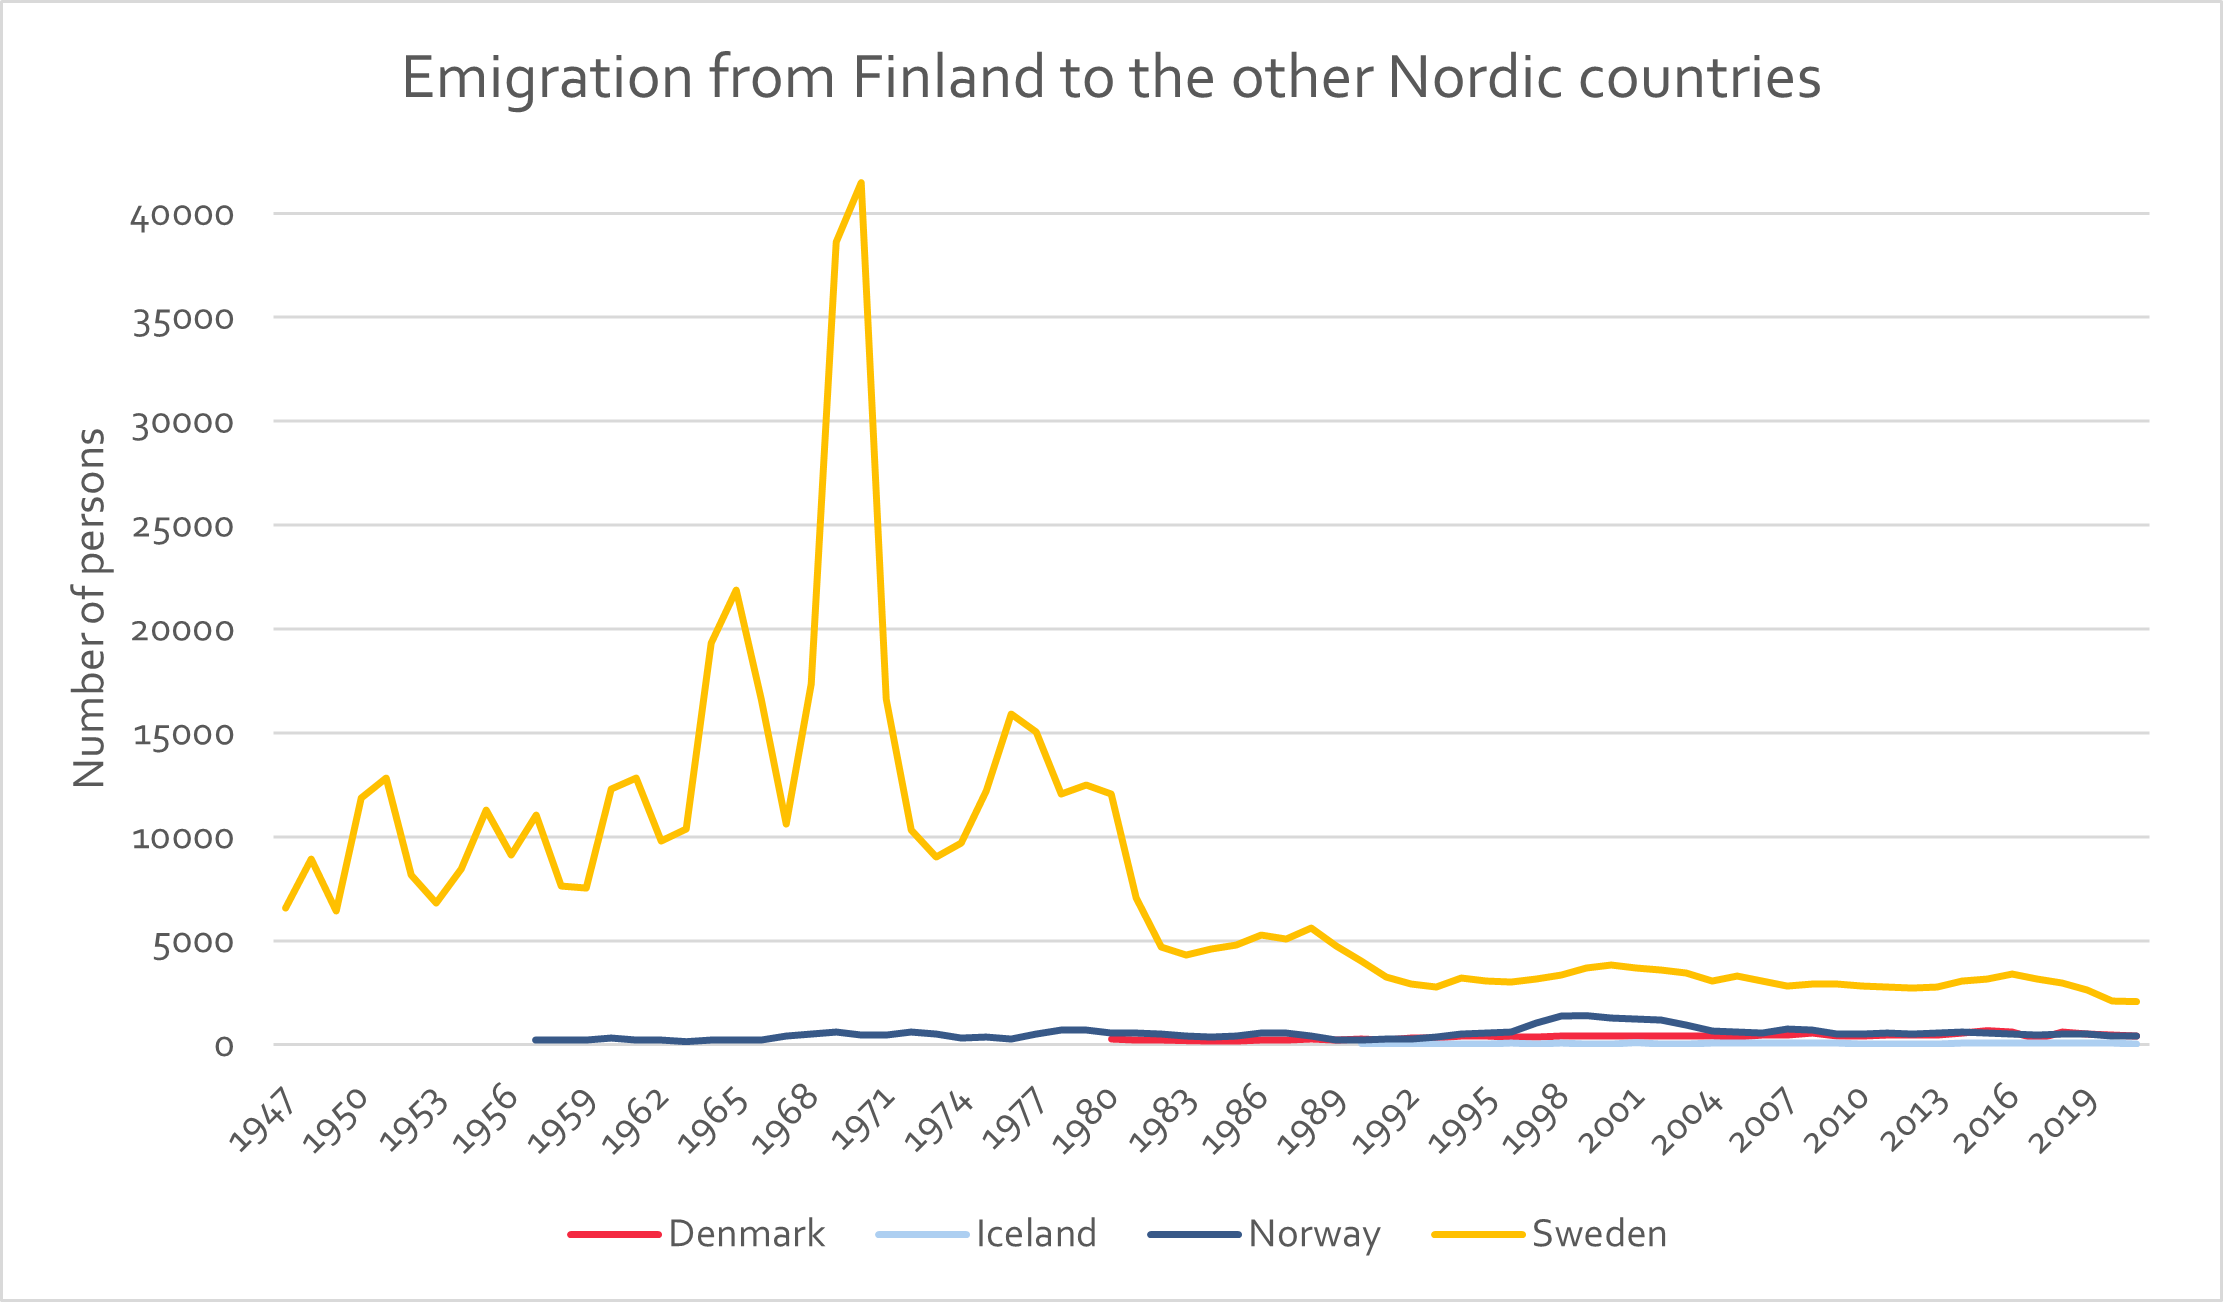
Intra-Nordic migration to and from Finland mainly concerns emigration to Sweden and return migration from Sweden. Emigration from Finland to Sweden was fairly high even before the agreement on the common Nordic labour market in 1954. As mentioned previously, the strong economy and new policies requiring a work permit for non-Nordic citizens in Sweden in 1967 led to even greater demand for labour from Finland, and the emigration peaked in the end of the 1960s and early 1970s with more than 40, 000 people registered. The emigration remained high until the early 1980s, and has since stabilised at around 3, 000 people per year.
Out-migration from Finland is indeed a mirror of in-migration since a majority of those who out-migrated to Sweden returned to Finland. Since 1983 Finland has had a positive intra-Nordic net migration of 21,000 people.
Iceland
Figure 13: Immigration to Iceland from the other Nordic countries.
Data source: Own calculations based on Nordic Statistics (from 1990) and NSIs (before 1990)
Data source: Own calculations based on Nordic Statistics (from 1990) and NSIs (before 1990)
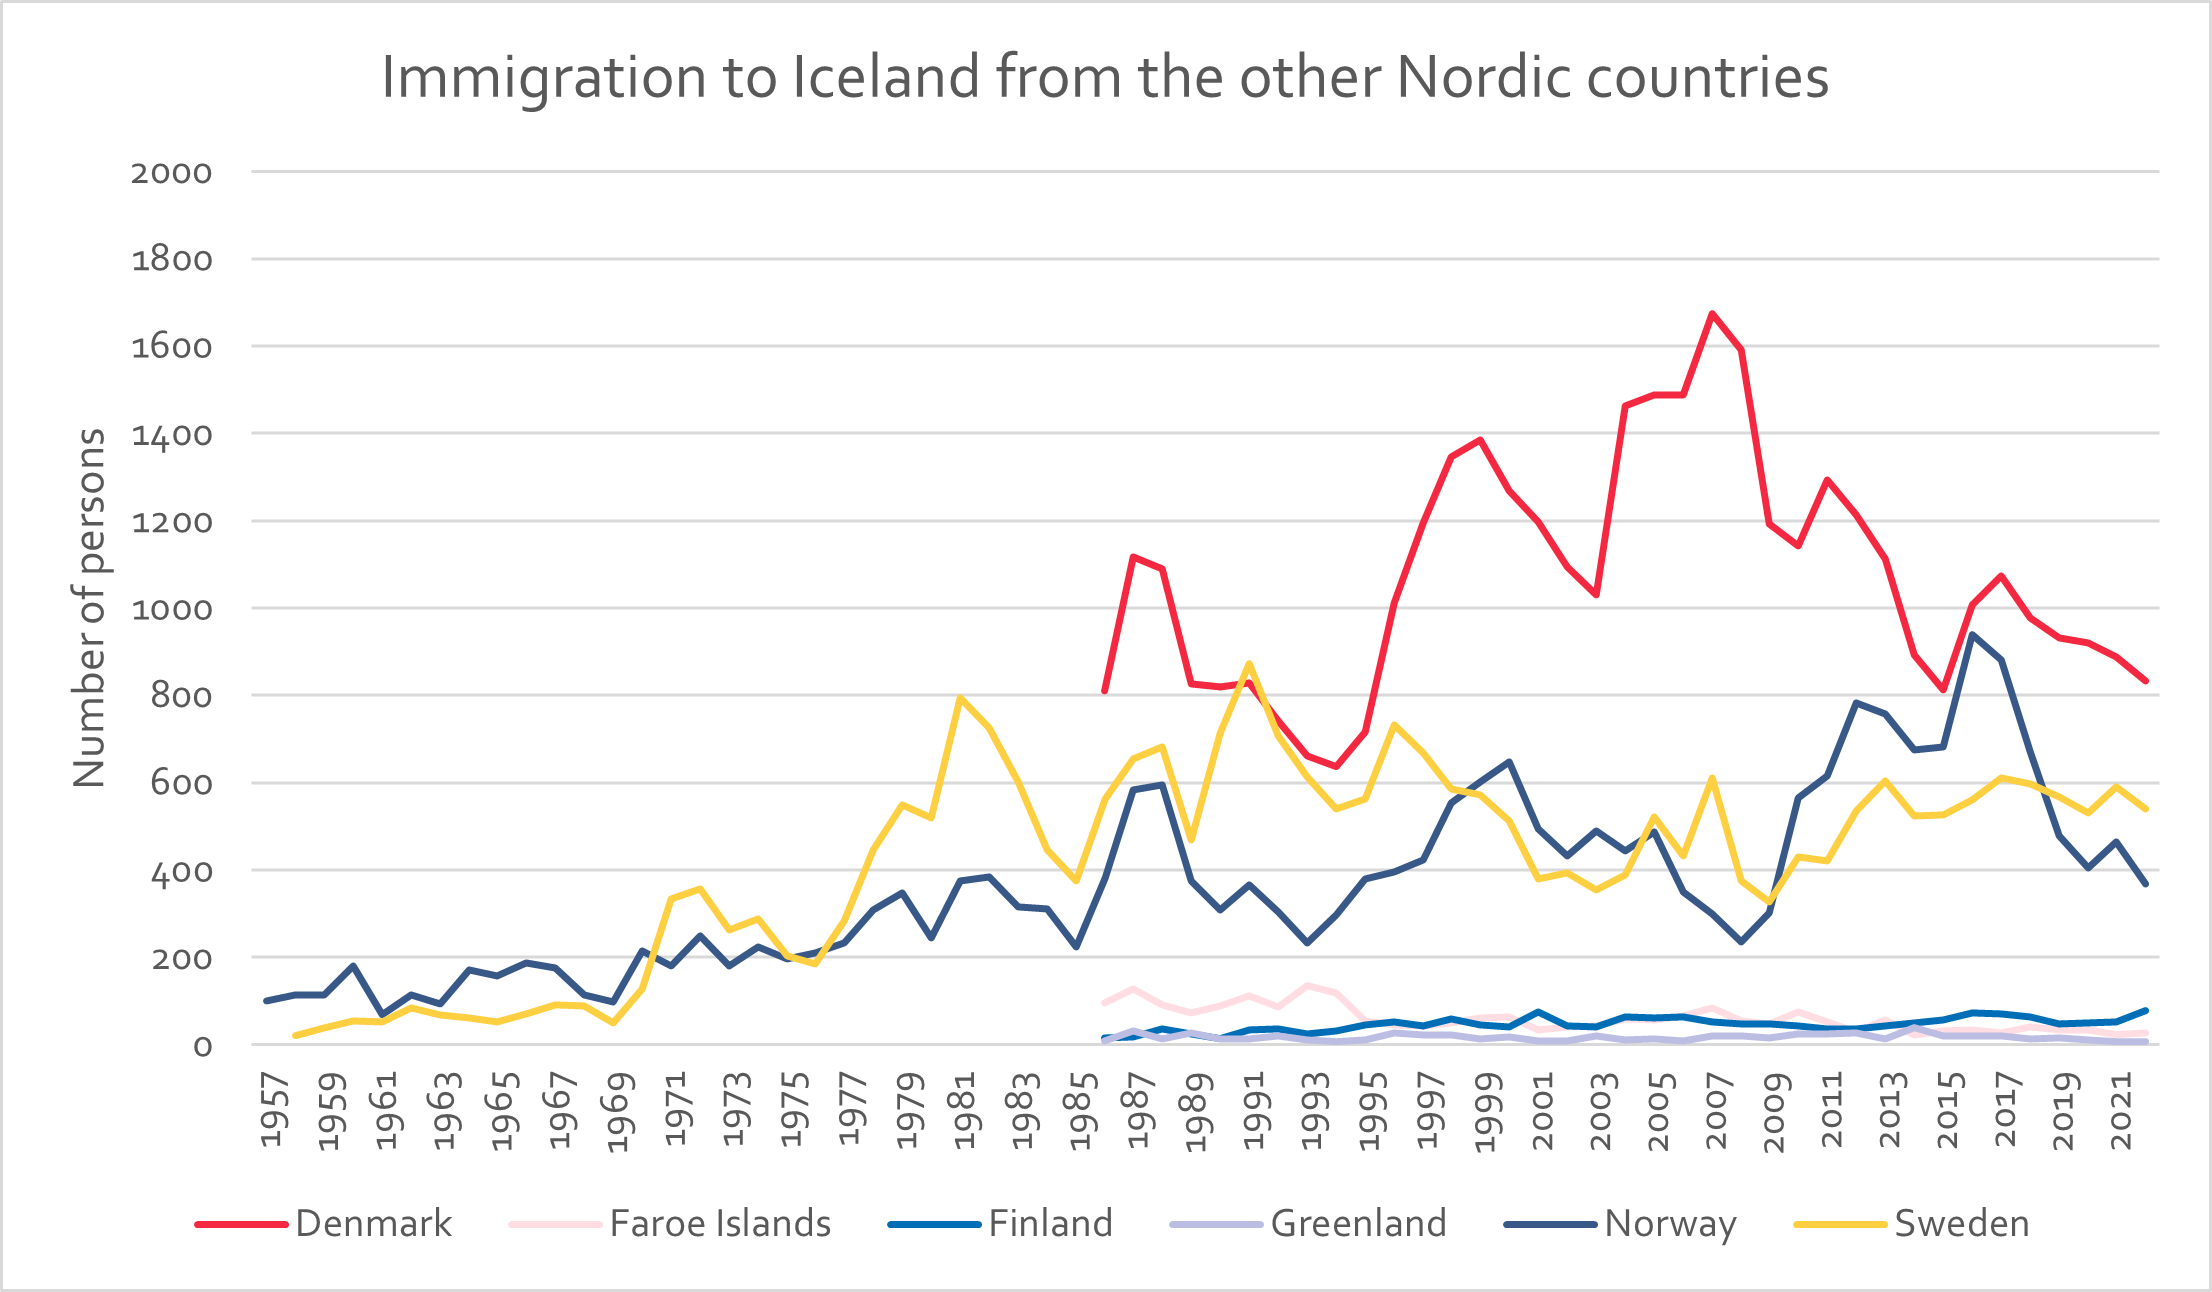
Figure 14: Emigration from Iceland to the other Nordic countries.
Data source: Own calculations based on Nordic Statistics (from 1990) and NSIs (before 1990)
Data source: Own calculations based on Nordic Statistics (from 1990) and NSIs (before 1990)
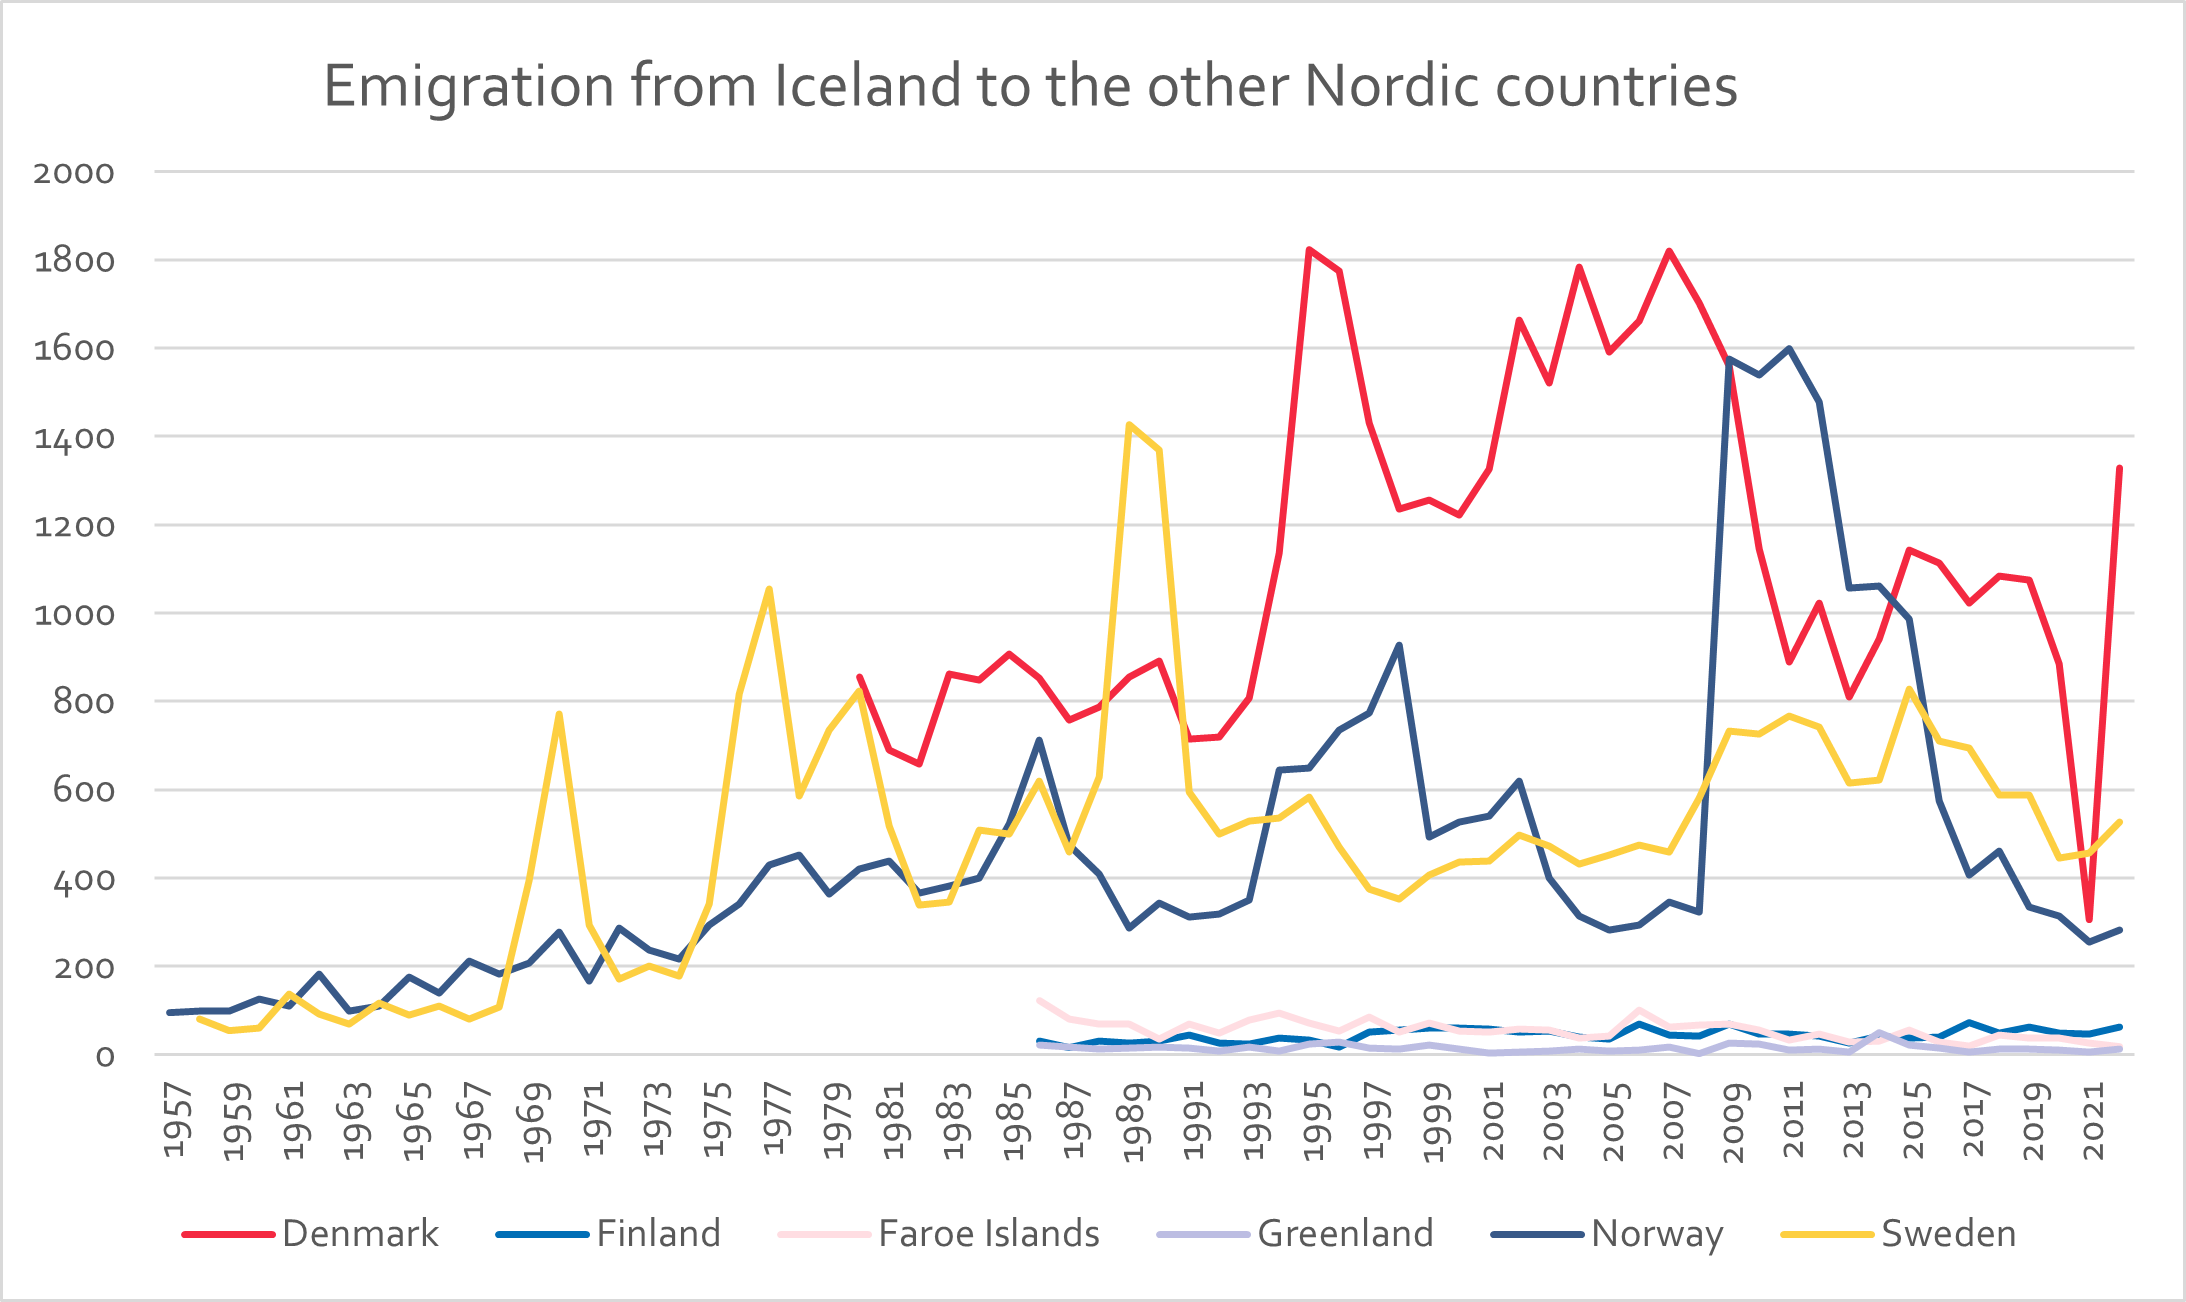
While the other Nordic countries show fairly stable patterns with a few peaks, Icelandic migration patterns are fairly volatile, with migration to Denmark, Sweden and Norway. Migration to Sweden occurred in waves during the 60s, 70s and 80s, peaking in 1989. The largest numbers of immigrants to Iceland come from Denmark. Denmark has also been a popular country for emigration from Iceland and in the 1990s until the financial crisis of 2008, by far the highest number of people emigrated to Denmark. Iceland was hit hard by the financial crisis and there was a big shift in emigration to Norway in 2009. 2009 was also the year with the biggest net out-migration (around 5,000 people) from Iceland since 1887.
A clear majority of immigration to Iceland consists of re-migration; as many as around 80% of those who immigrated to Iceland from Norway, Denmark and Sweden were Icelandic citizens.
Why do Nordic migrants move?
Compared to the extensive research on migration from economically disadvantaged nations to affluent nations, there has been a lack of research on the drivers of emigration from economically prosperous and politically stable countries. That means that research questions such as whether emigration from wealthy nations is voluntary or involuntary, incentivised by better economic opportunities abroad or driven by personal aspirations remain largely unanswered.
Yet the growing body of literature demonstrates that highly skilled individuals are more likely to emigrate from rich nations, including studies in Sweden and Denmark (Birgier et al., 2022; Borjas et al., 2019; Erlinghagen et al., 2021; Haberfeld et al., 2020; Monti, 2020; Rosso, 2019; Weber & Saarela, 2019). Previous studies on cross-Nordic migration indicate that emigration tends to be temporary (Jensen & Pedersen, 2007; Monti, 2020; Weber & Saarela, 2019), predominantly comprising young individuals (Birgier et al., 2022; Fuentes Monti & Tønnessen, 2023; Koikkalainen et al., 2016; Nekby, 2006) and that economic circumstances alone are not sufficient explanation for such migration flows, with other factors also being important (Birgier et al., 2022; Fuentes Monti & Tønnessen, 2023; Hedberg & Kepsu, 2003, 2003; Weber & Saarela, 2019, 2023). Moreover, the costs and benefits of migration and re-migration need to be taken into account (McCann et al., 2010; Tervonen, 2015; Vadean & Piracha, 2010; Weber & Saarela, 2019).
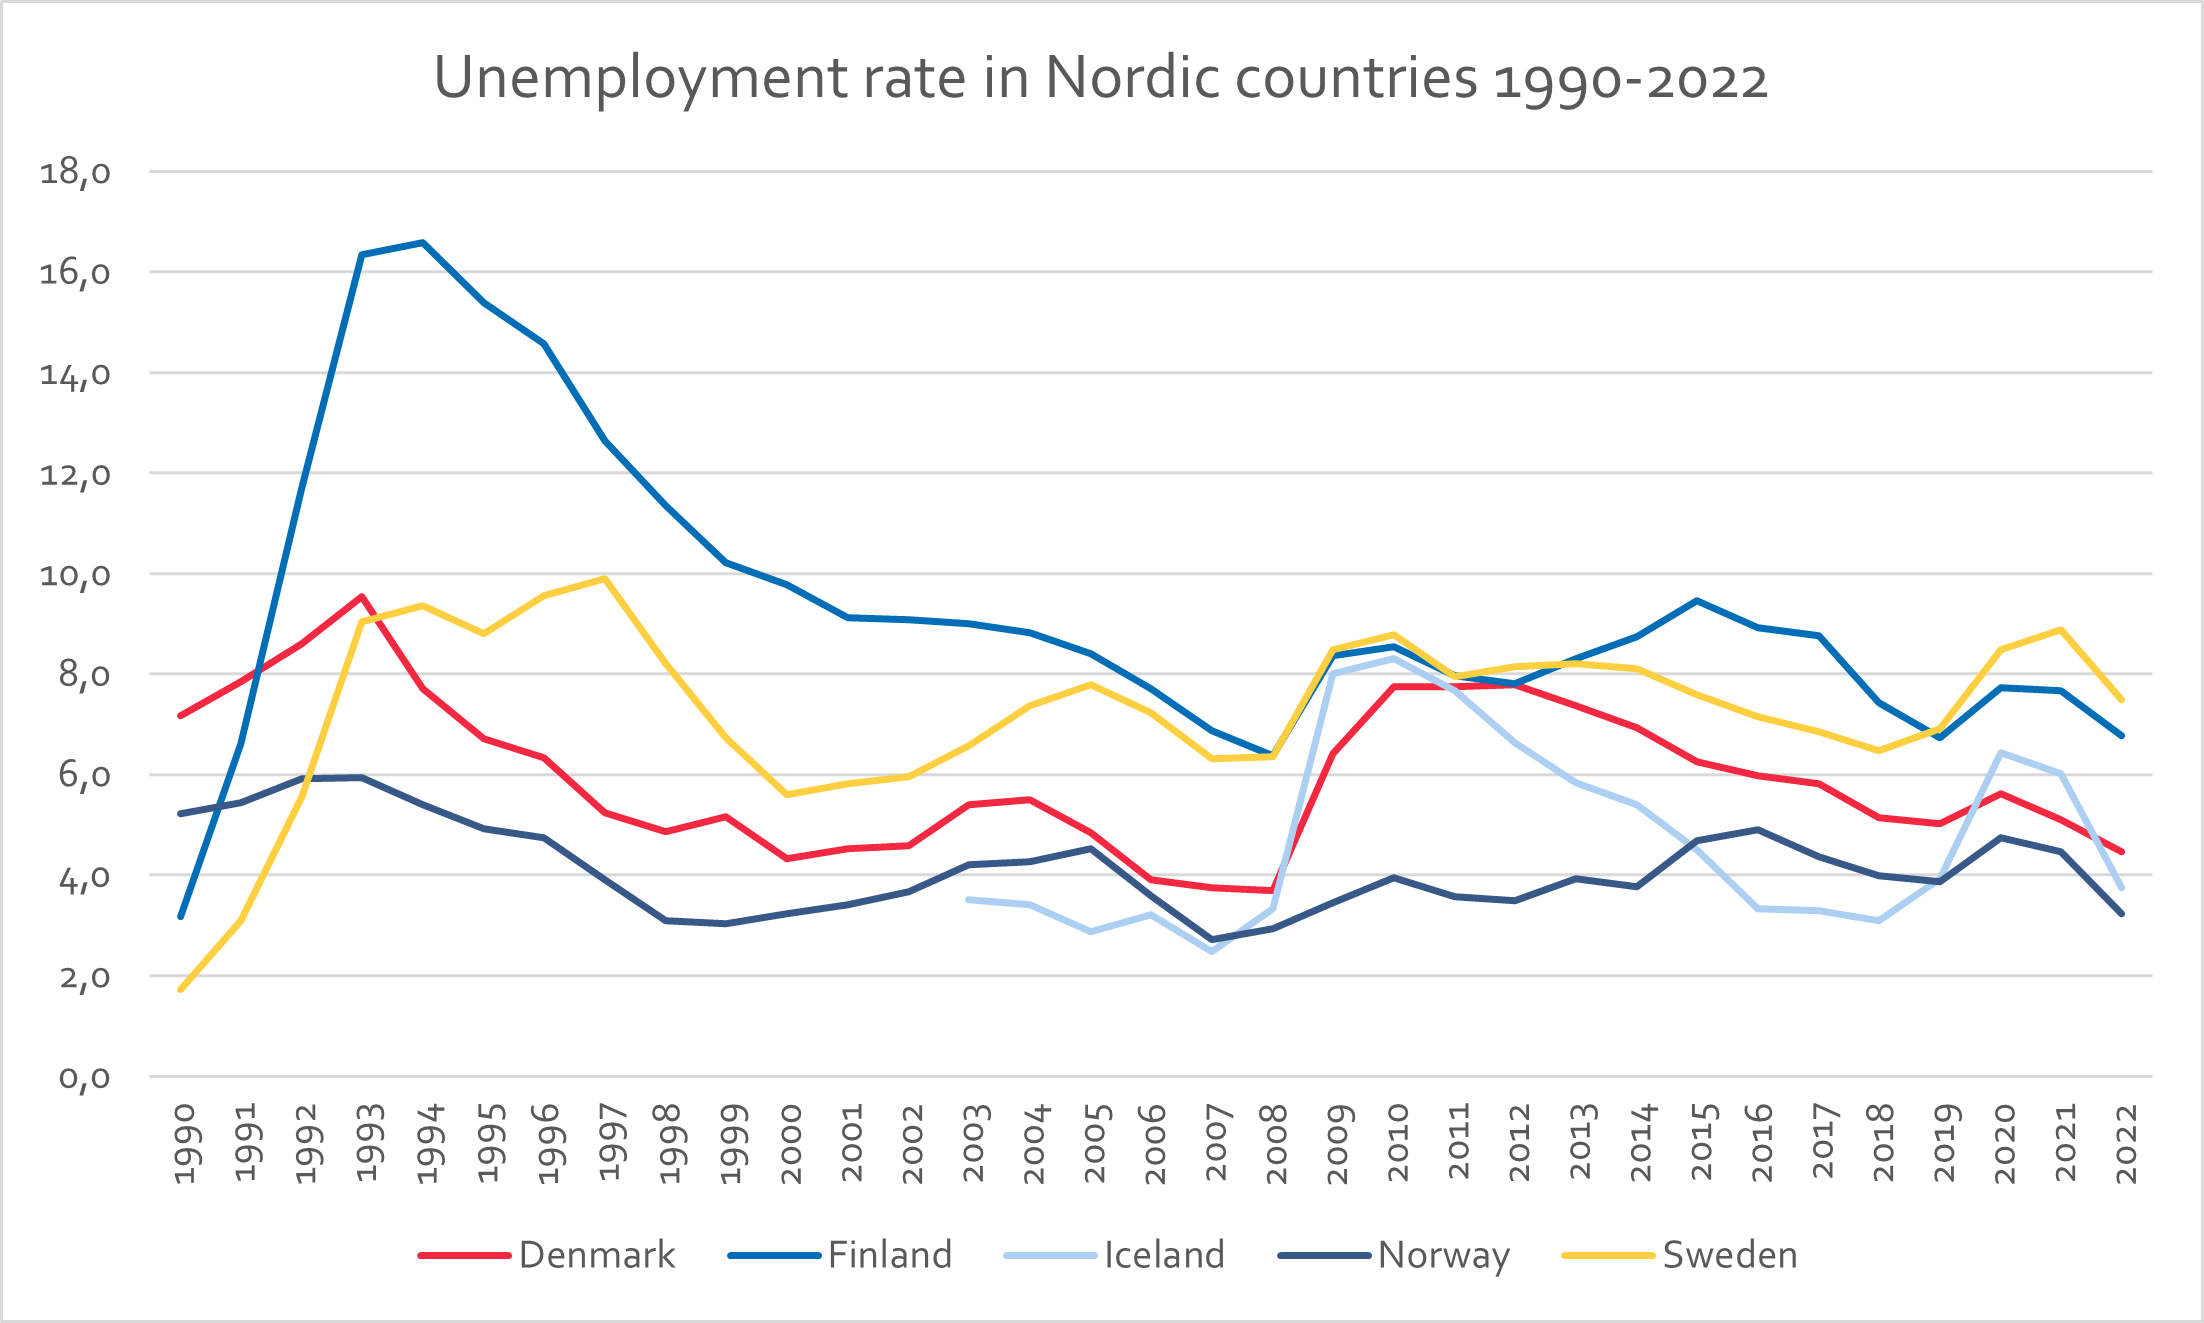
Before delving further into migration flows across the Nordic Region, Figure 15 illustrates unemployment rates among Nordic countries from 1990 to 2022. It is evident that, in the majority of years, Norway has consistently had lower unemployment rates than all other Nordic countries, maintaining remarkable stability ranging from 2.7 to 5.2%. While previous studies focusing on the years 1960-2003 identify Sweden as the main recipient of migration due to its size and other factors (Pedersen et al., 2008), Figure 15 reveals that Norway had a much more stable labour market in the period 1990-2022. It is noteworthy that during the pre-crisis years of the 1990s (between 1990 and 1991), Sweden and Finland experienced remarkable low unemployment rates. In the case of Finland, following the collapse of the Soviet Union, a significant influx of immigrants coincided with the economic crisis of the 1990s, resulting in extremely high levels of unemployment, peaking at 16.6% in 1994 (Pedersen et al., 2008).
Furthermore, the impact of the 2008 economic crisis on unemployment levels is evident across all countries except Norway. The most pronounced effect is observed in Iceland, where unemployment more than doubled from under 3% to 8.5% in just one year. However, the effect is also marked in Denmark, Finland and Sweden.
Figure 15. The unemployment rate in the Nordic countries 1990-2022.
Source: OECD (2024) Infra-annual Labour Statistics: Monthly Unemployment Rates (Database)
Source: OECD (2024) Infra-annual Labour Statistics: Monthly Unemployment Rates (Database)
Figures 16-20 illustrate the immigration and emigration patterns of Nordic migrants across various Nordic labour markets, juxtaposed with the respective unemployment rates, between 1990 to 2022. As discussed in the preceding section, immigration and emigration flows of Nordic migrants exhibit significant variability over time in all Nordic countries, but two main trends emerge.
First, during periods of economic crisis, such as the economic downturn of the 1990s – marked by elevated unemployment rates – overall migration flows, both inbound and outbound, among Nordic countries tend to diminish in the initial stage relative to pre-crisis levels, with emigration rising as the downturn persists. That trend is particularly conspicuous in Sweden, Norway and Finland. Second, distinct cross-border migration patterns can be observed during specific intervals.
As mentioned earlier, previous studies on migration in the Nordic Region also highlight the temporary nature of migration, with individuals often migrating for relatively short periods before returning. For example, between 2008 and 2012, emigration from Sweden to Norway increased, coinciding with elevated unemployment levels in Sweden and other Nordic nations, contrasting with Norway's comparatively low unemployment rate.
When examining the Norwegian patterns, two key observations present themselves. First, emigration and immigration flows largely reflect trends observed in Sweden. In Norway, immigration nearly doubled from 2004 to 2011, primarily attributed to emigration from Sweden, which significantly contributed to that surge. During that period, Sweden experienced fluctuating unemployment rates of between 6 to 8%, while Norway's unemployment rate ranged from 2.7 to 4.5%. Second, following each substantial influx of immigrants, there is a subsequent surge in emigration within two to three years, with a considerable proportion of individuals returning to their home country. Those patterns are most pronounced during the periods from 1995 to 2000 and from 2007 to 2011. Post-2008, Norway consistently maintains substantially lower unemployment rates, averaging between 3-4%, than other Nordic nations, which often experience rates twice as high. That divergence may partially account for the marked influx of migrants from other Nordic countries to Norway during this period.
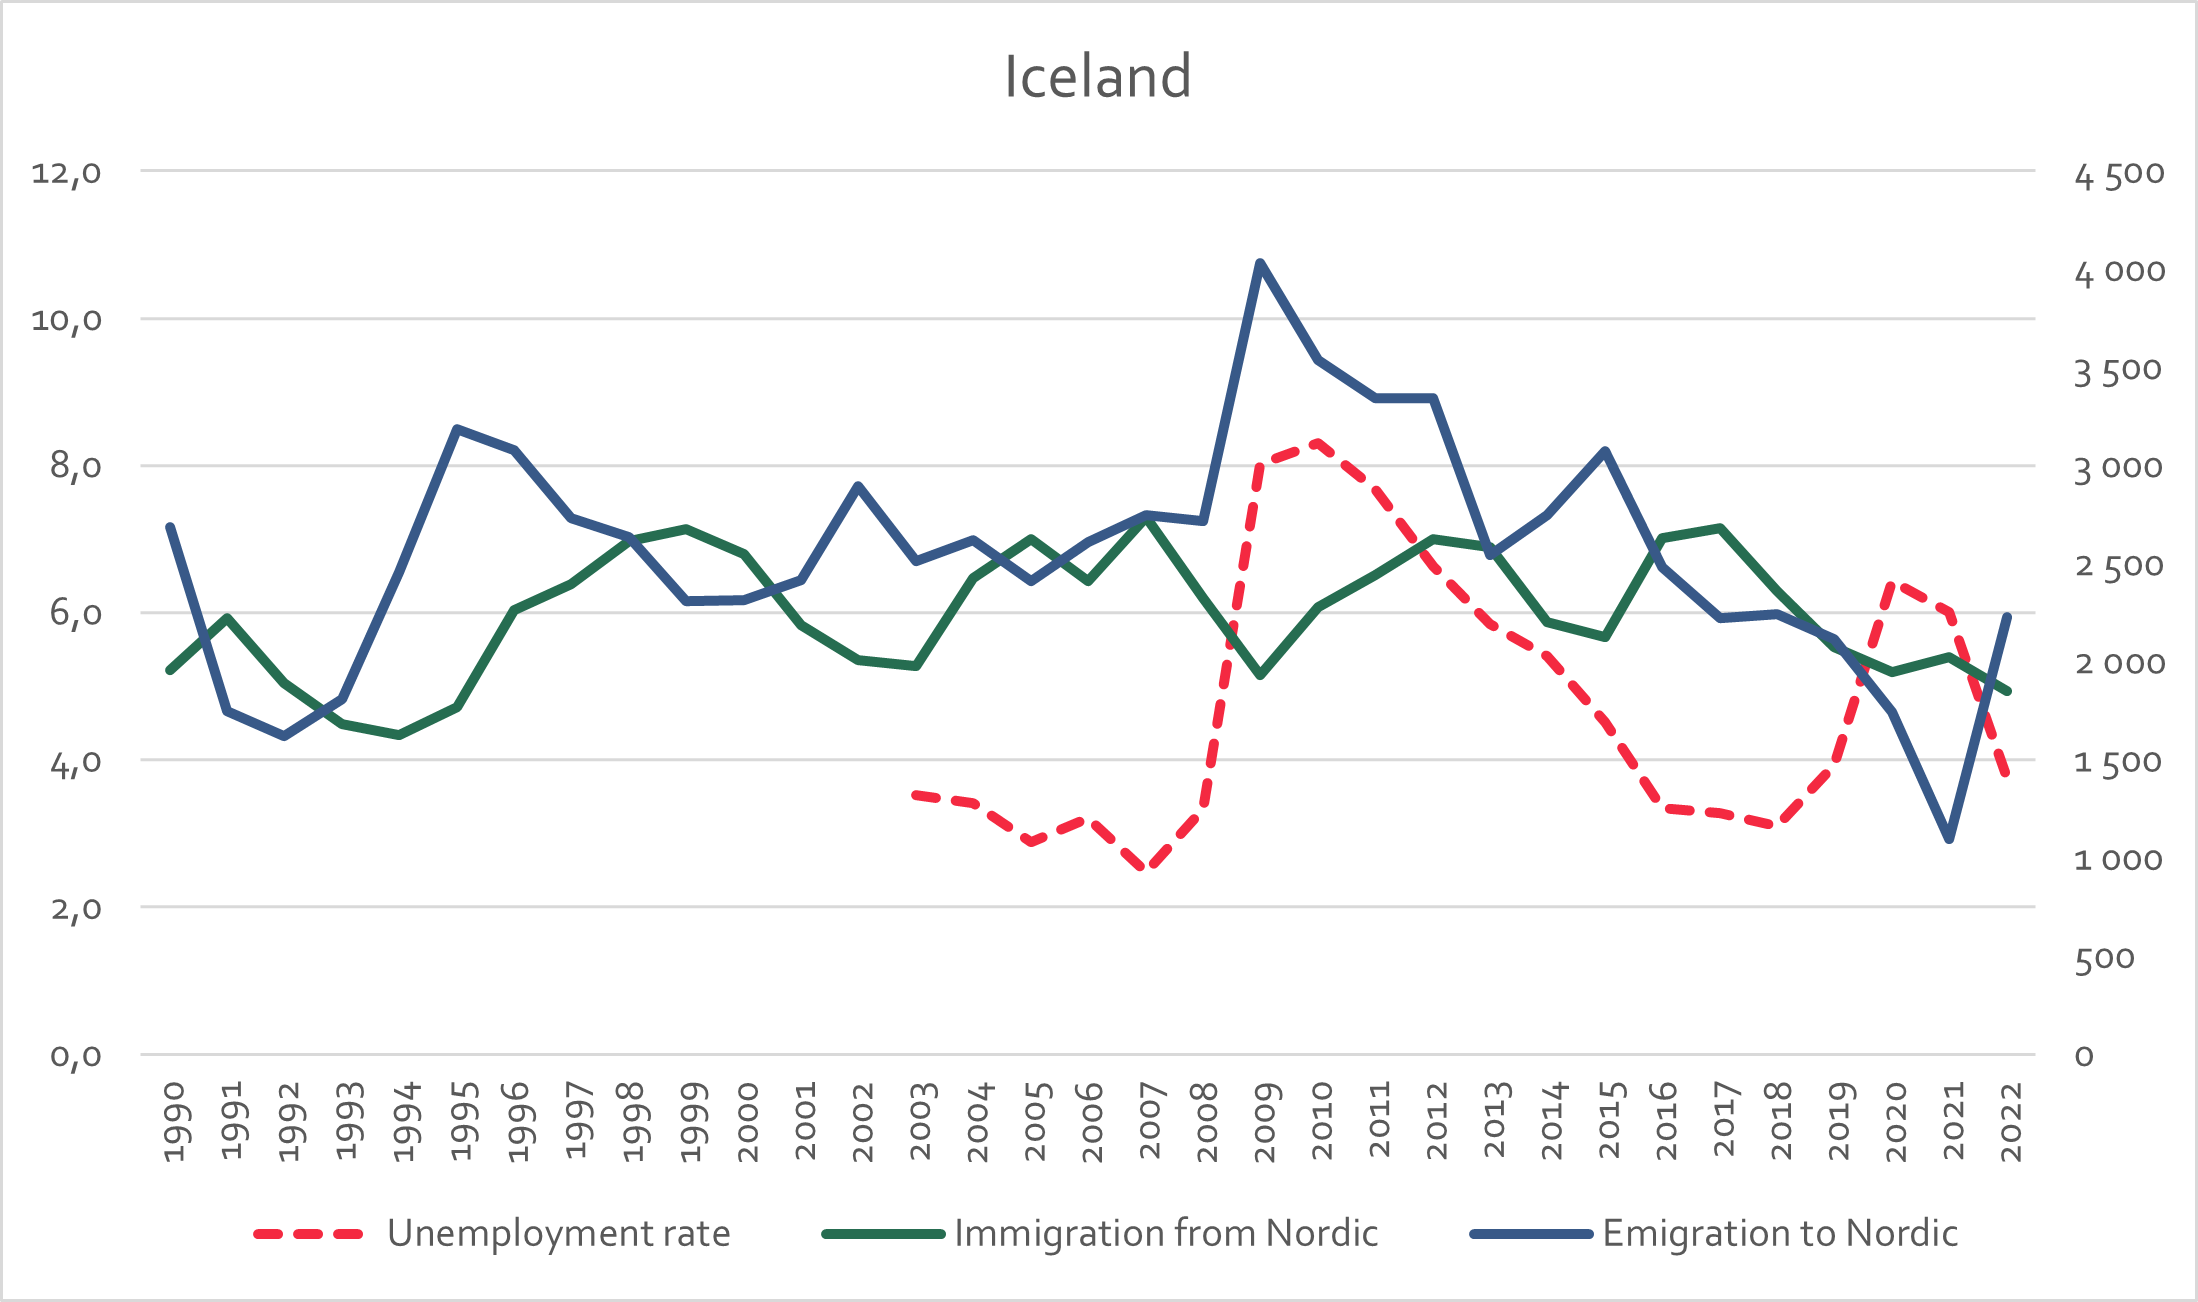
Finally, a striking example of the impact of economic downturn is observed in the case of Iceland. Between 2008 and 2009, unemployment more than doubled, leading to a nearly 50% increase in emigration to other Nordic countries (while emigration to other destinations increased by just 2%). Additionally, in 2009, immigration to Iceland from other Nordic countries dropped to less than 2,000 individuals (compared to over 2,700 in 2007).
Figure 16: Immigration and emigration flows between Sweden and other Nordic countries, alongside the unemployment rate.
Source: Nordic Statistics data and OECD (2024) Infra-annual Labour Statistics: Monthly Unemployment Rates (Database).
Source: Nordic Statistics data and OECD (2024) Infra-annual Labour Statistics: Monthly Unemployment Rates (Database).
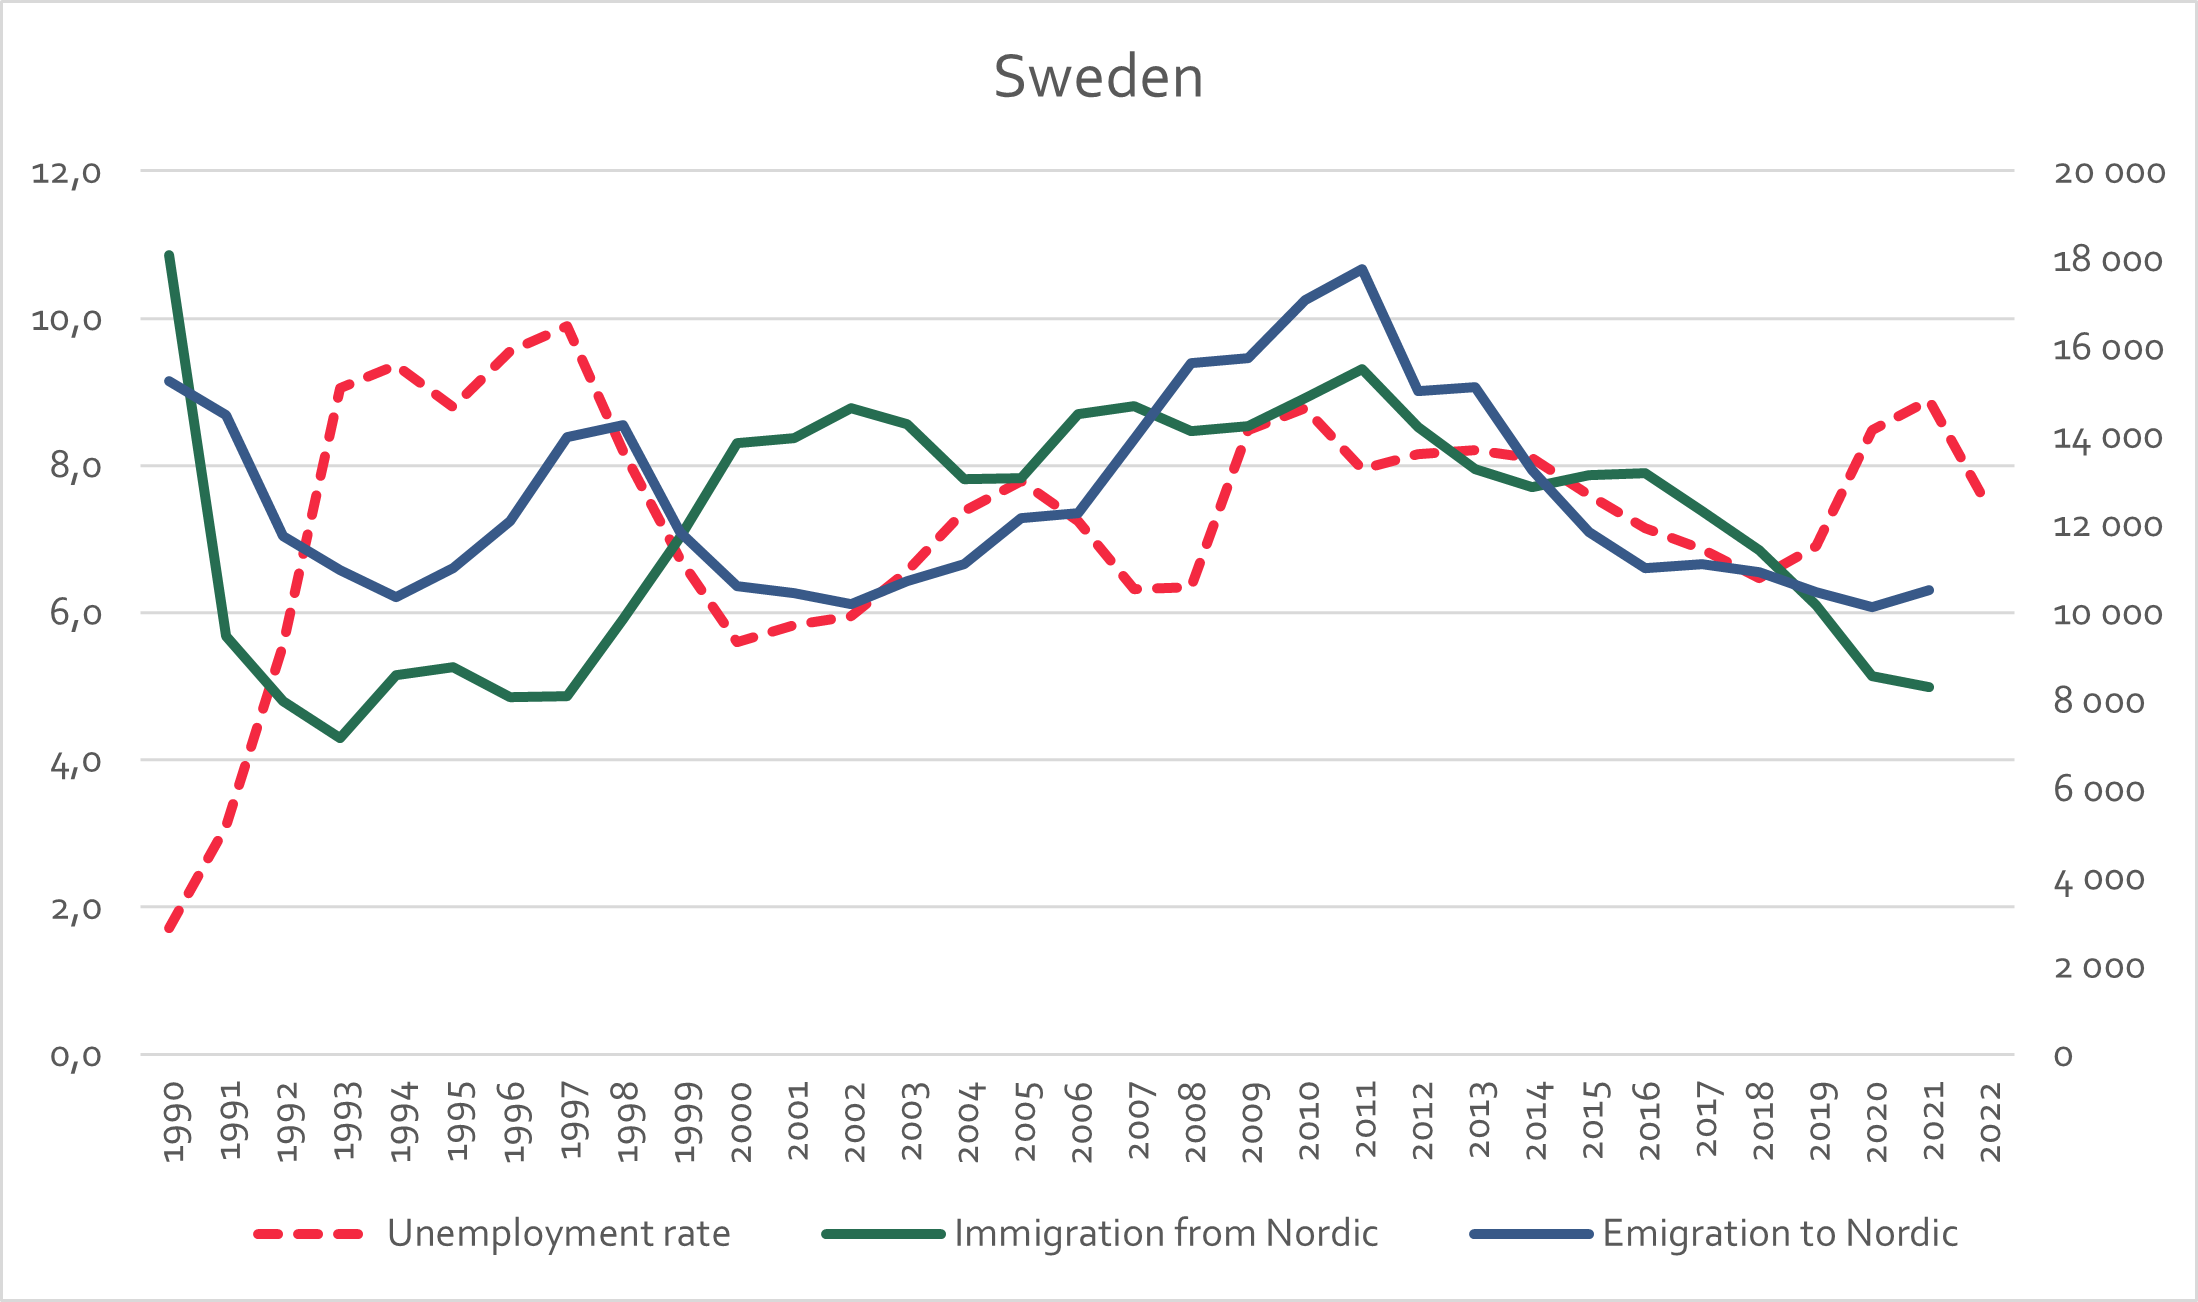
Figure 17: Immigration and emigration flows between Norway and other Nordic countries, alongside the unemployment rate.
Source: Nordic Statistics data and OECD (2024) Infra-annual Labour Statistics: Monthly Unemployment Rates (Database).
Source: Nordic Statistics data and OECD (2024) Infra-annual Labour Statistics: Monthly Unemployment Rates (Database).
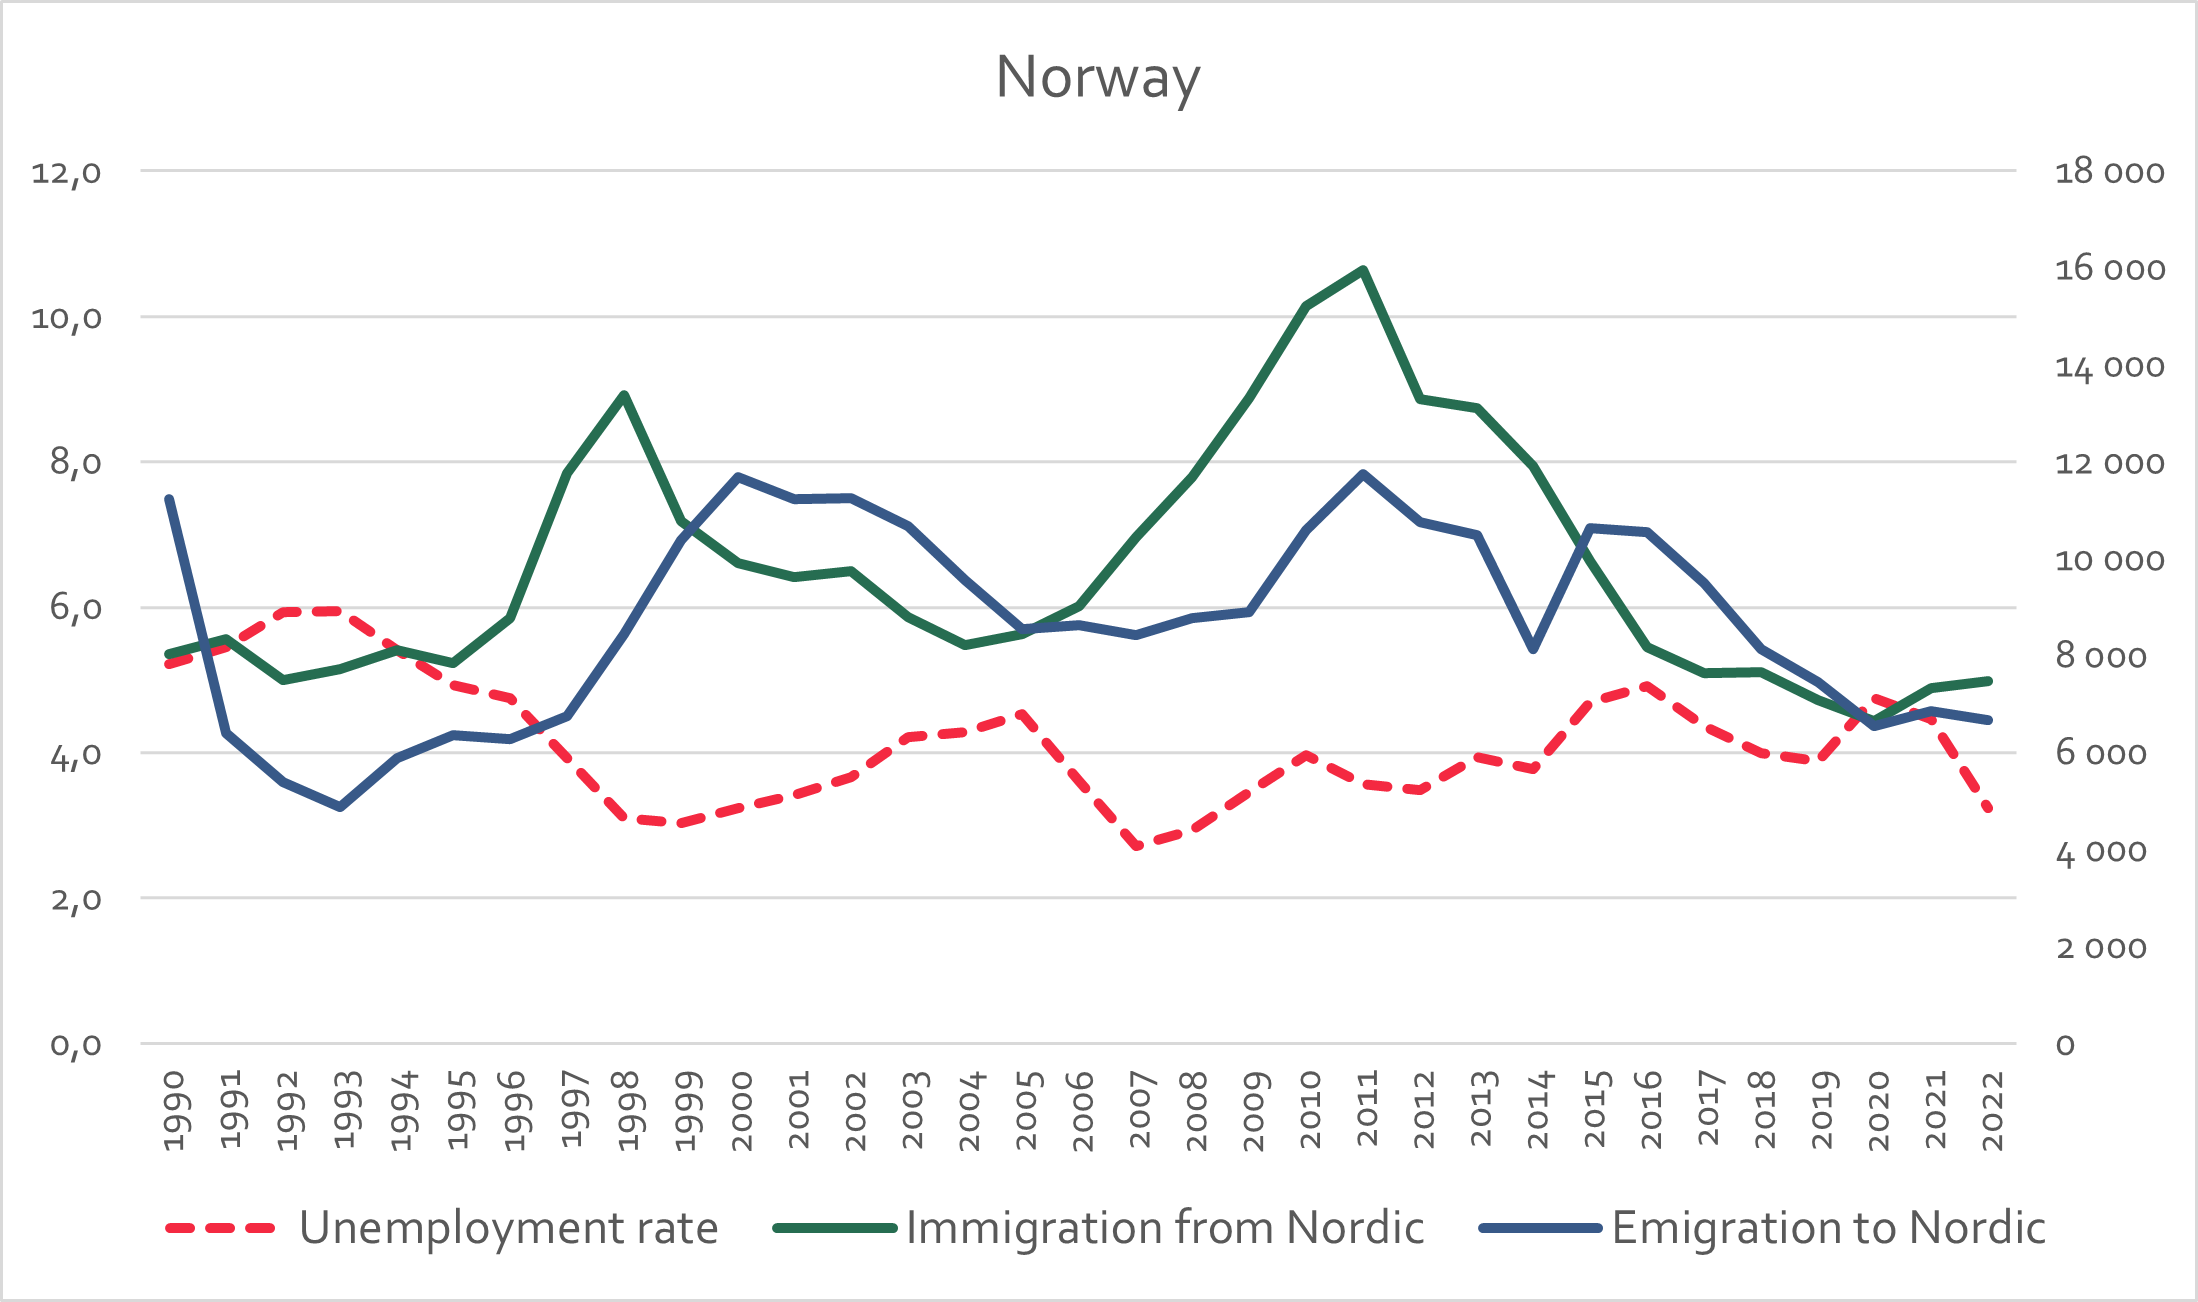
Figure 18: Immigration and emigration flows between Demark and other Nordic countries, alongside the unemployment rate.
Source: Nordic Statistics data and OECD (2024) Infra-annual Labour Statistics: Monthly Unemployment Rates (Database).
Source: Nordic Statistics data and OECD (2024) Infra-annual Labour Statistics: Monthly Unemployment Rates (Database).
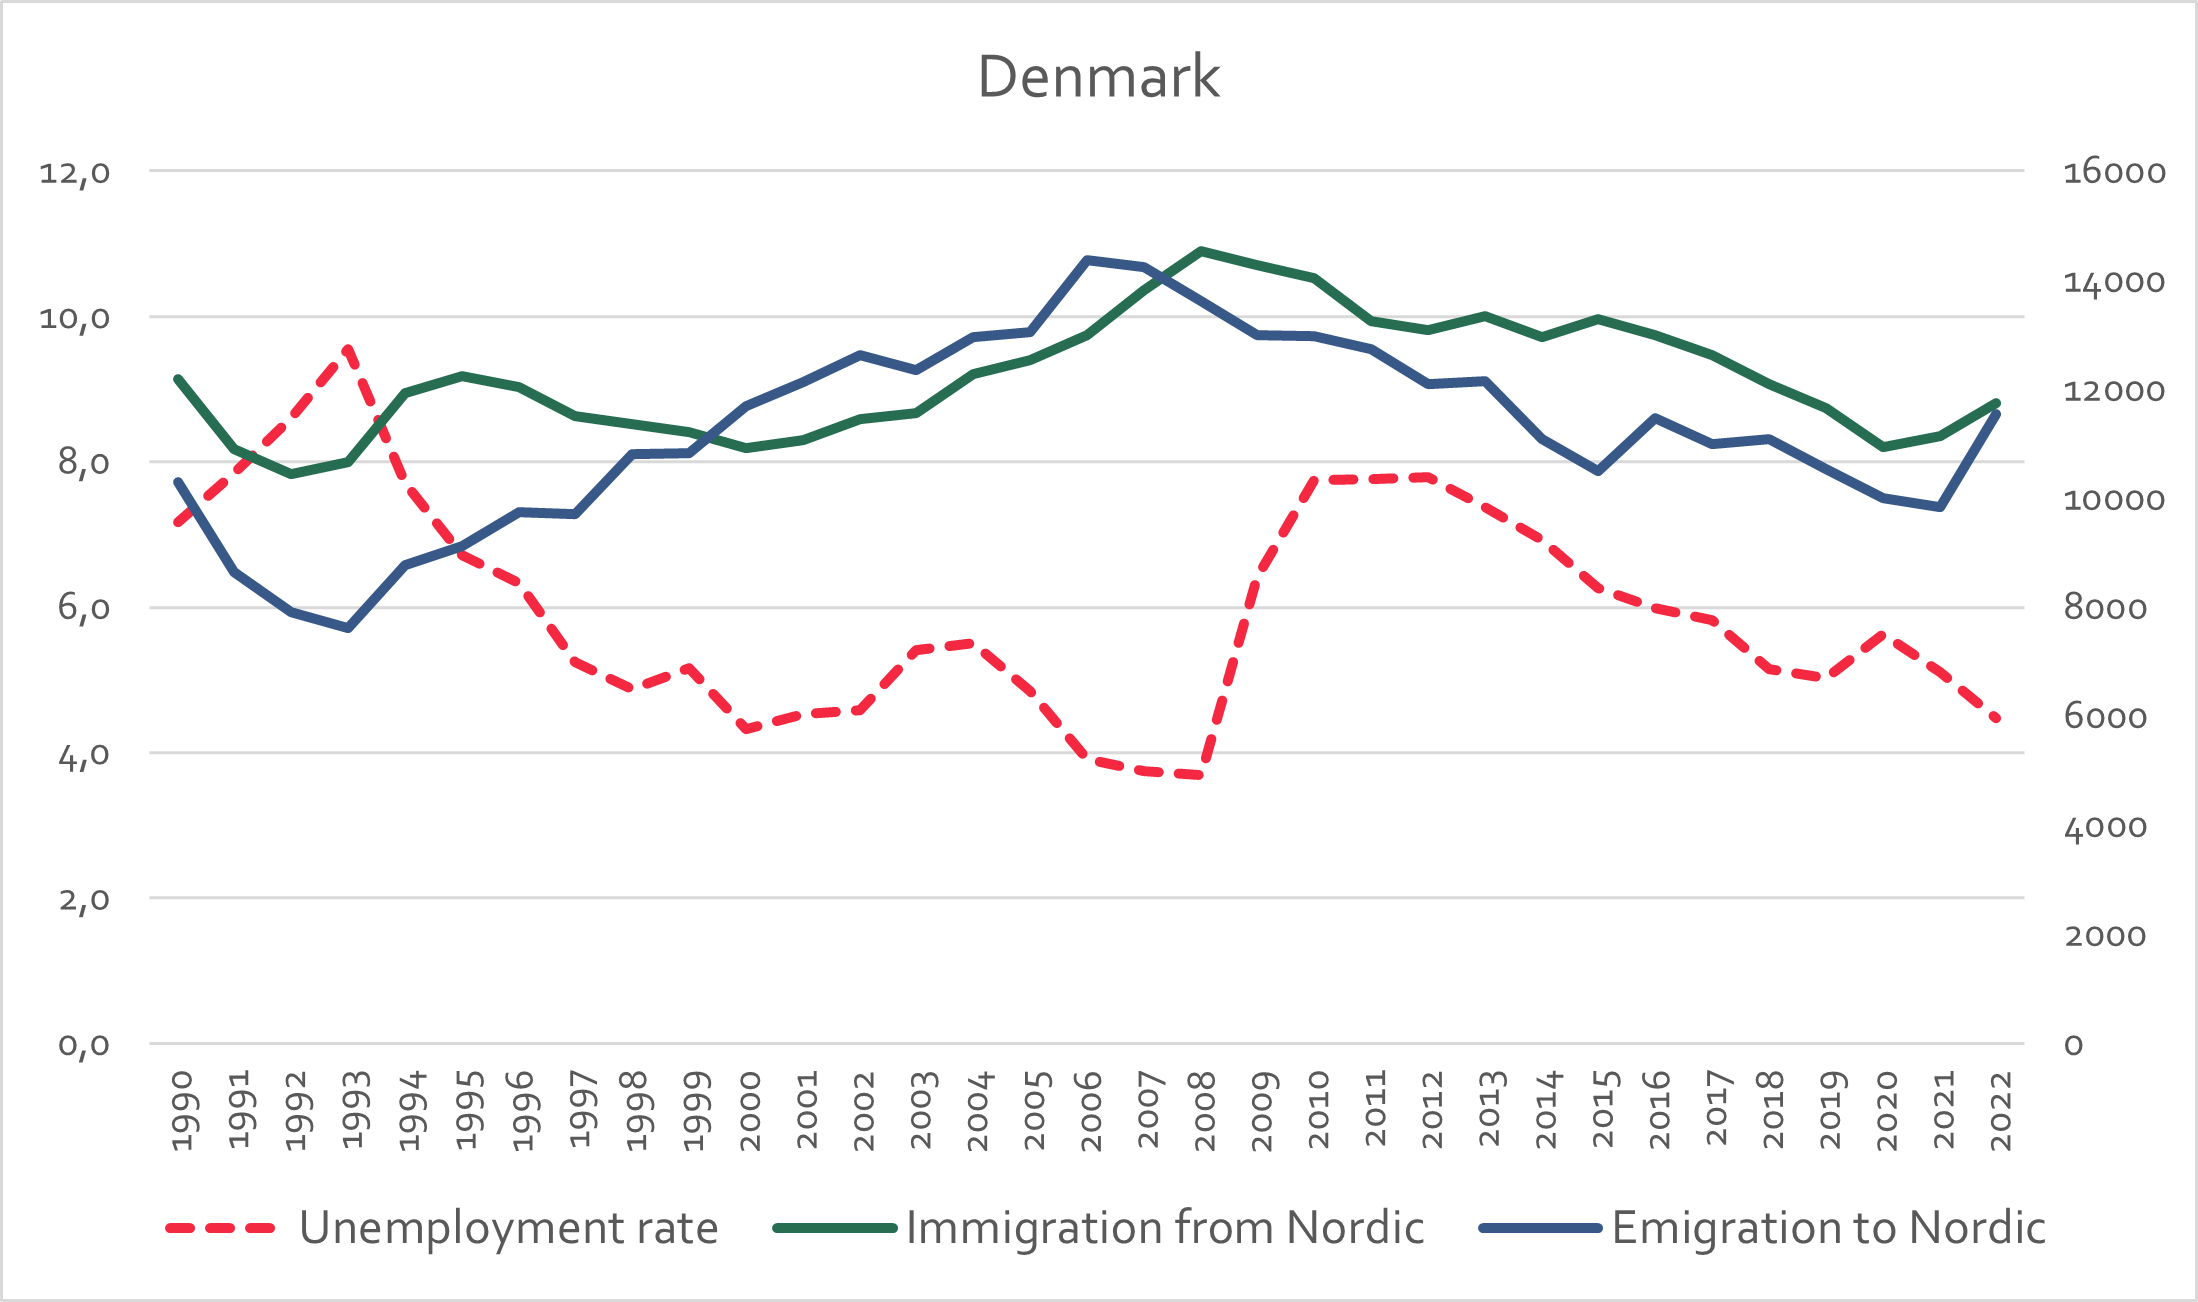
Figure 19: Immigration and emigration flows between Finland and other Nordic countries, alongside the unemployment rate.
Source: Nordic Statistics data and OECD (2024) Infra-annual Labour Statistics: Monthly Unemployment Rates (Database).
Source: Nordic Statistics data and OECD (2024) Infra-annual Labour Statistics: Monthly Unemployment Rates (Database).
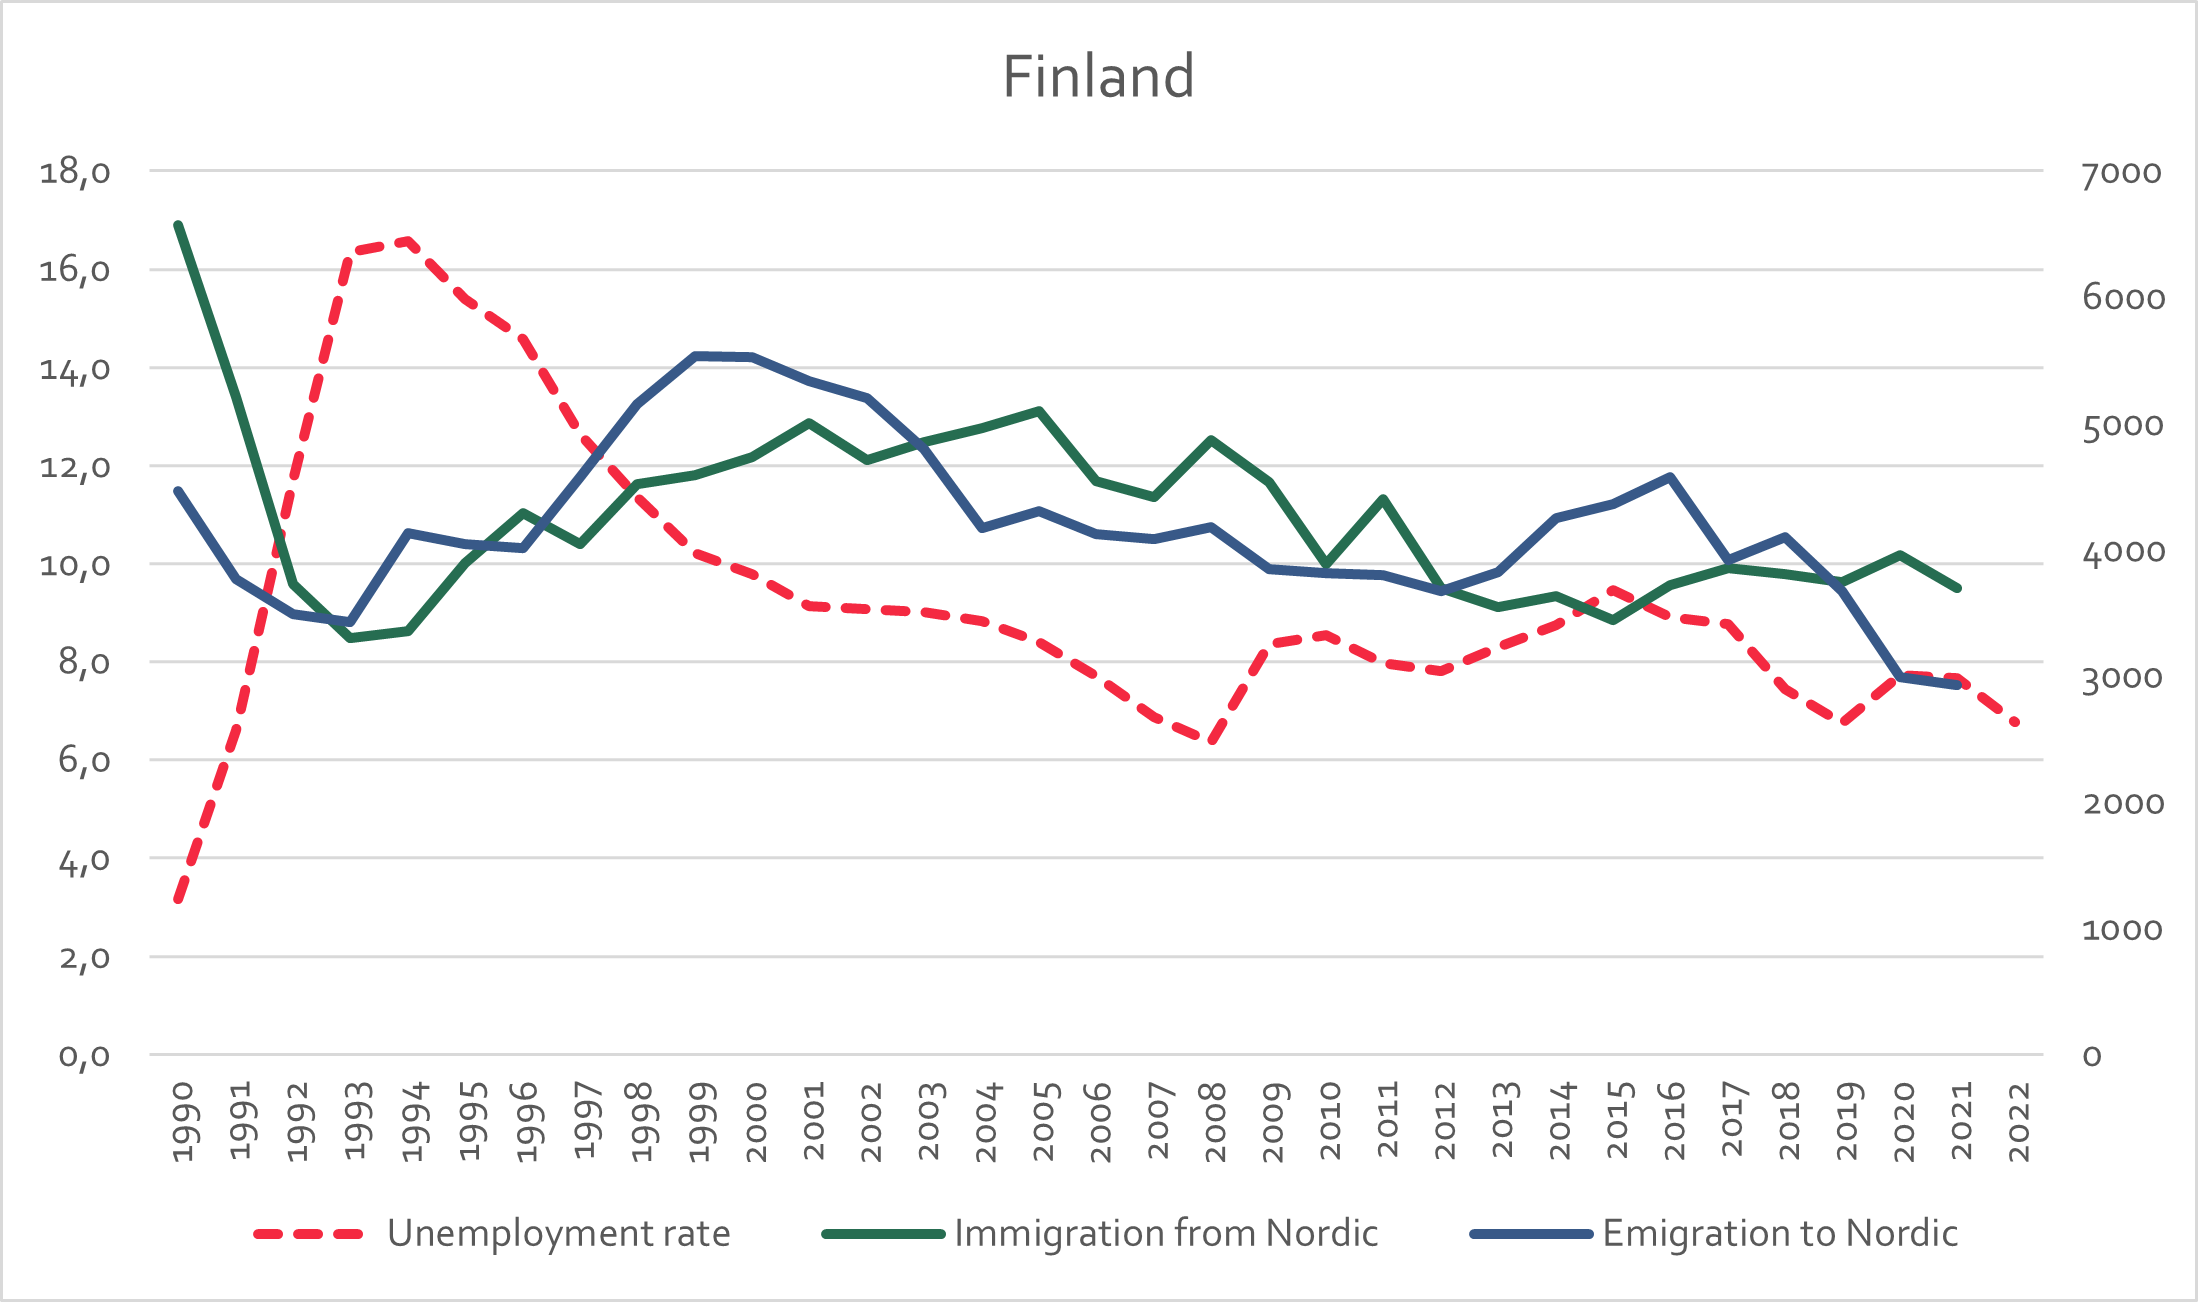
Figure 20: Immigration and emigration flows between Iceland and other Nordic countries, alongside the unemployment rate.
Source: Nordic Statistics data and OECD (2024) Infra-annual Labour Statistics: Monthly Unemployment Rates (Database).
Source: Nordic Statistics data and OECD (2024) Infra-annual Labour Statistics: Monthly Unemployment Rates (Database).
In conclusion, while the research literature on why people migrate from developed countries is relatively limited, economic circumstances form only one part of the explanation (Birgier et al., 2022; Fuentes Monti & Tønnessen, 2023; Hedberg & Kepsu, 2003, 2003; Weber & Saarela, 2019, 2023). The statistical data from 1990-2022 indicate that high levels of unemployment in a particular Nordic country can lead to increased emigration flows. That was evident in Finland during the early 1990s, with significant emigration to Sweden and, to some extent, between 2008 and 2012, with increased immigration to Norway. That confirms previous studies on migration flows within the Nordic Region, which indicated that unemployment and structural change at specific times could act as a financial incentive for migration (Pedersen and Røed (2008). In other words, intra-Nordic migration was also shaped by an imbalance in employment opportunities. Individuals tended to relocate when faced with job scarcity in their home country and greater prospects elsewhere in the Nordic Region (Fischer and Straubhaar 1996, Pedersen, Røed and Wadensjö 2008). However, the robust social security systems in Nordic countries allowed many to stay put even in times of prolonged unemployment (Fischer and Straubhaar 1996).
How does Nordic migration relate to international migration?
The period examined here, i.e. 1954 until today, is one of increased levels of international migration globally. As a consequence, the share of Nordic migration has decreased in most parts of the Nordic Region. It is only in Åland, the Faroe Islands and Greenland that the share of Nordic migration is higher than other international migration.
Figure 21 shows the proportion of emigrants to other Nordic countries relative to total emigration since 1990. While significant variability is evident across the Nordic nations, two notable trends emerge. First, in the 1990s, the proportion of emigrants relocating to other Nordic countries was considerable, ranging from 30 to 70%. Second, there has been a declining trend in the share of emigration to other Nordic countries as a proportion of overall emigration flows in most Nordic countries, reaching approximately 20% by 2021. The most pronounced drops occurred in the early 1990s, concurrent with the economic crises experienced across the region, with partial recoveries observed after 1996, 1997 and 1999 for Sweden, Finland and Norway respectively.
Iceland is a distinct case, with a predominant proportion of emigration being to other Nordic countries, marked by a few but significant declines (1992, 2008 and 2015) and harmonisation with the levels of other Nordic countries. One decline took place in 1992, coinciding with the economic crisis prevalent in the Nordic Region during that period, while the other occurred in 2008, coinciding with the substantial economic downturn experienced in Iceland in particular. It is noteworthy that in 2008, despite an overall increase in emigration (see Figure 13), a larger portion of individuals leaving Iceland opted for destinations outside the Nordic Region.
It is pertinent to highlight that, among the Nordic countries, Denmark has the most stable pattern, with the share of emigrants relocating to other Nordic countries comprising approximately 30% of total emigration for most periods until 2007, followed by a gradual decline, reaching its lowest point in 2019 of 14%.
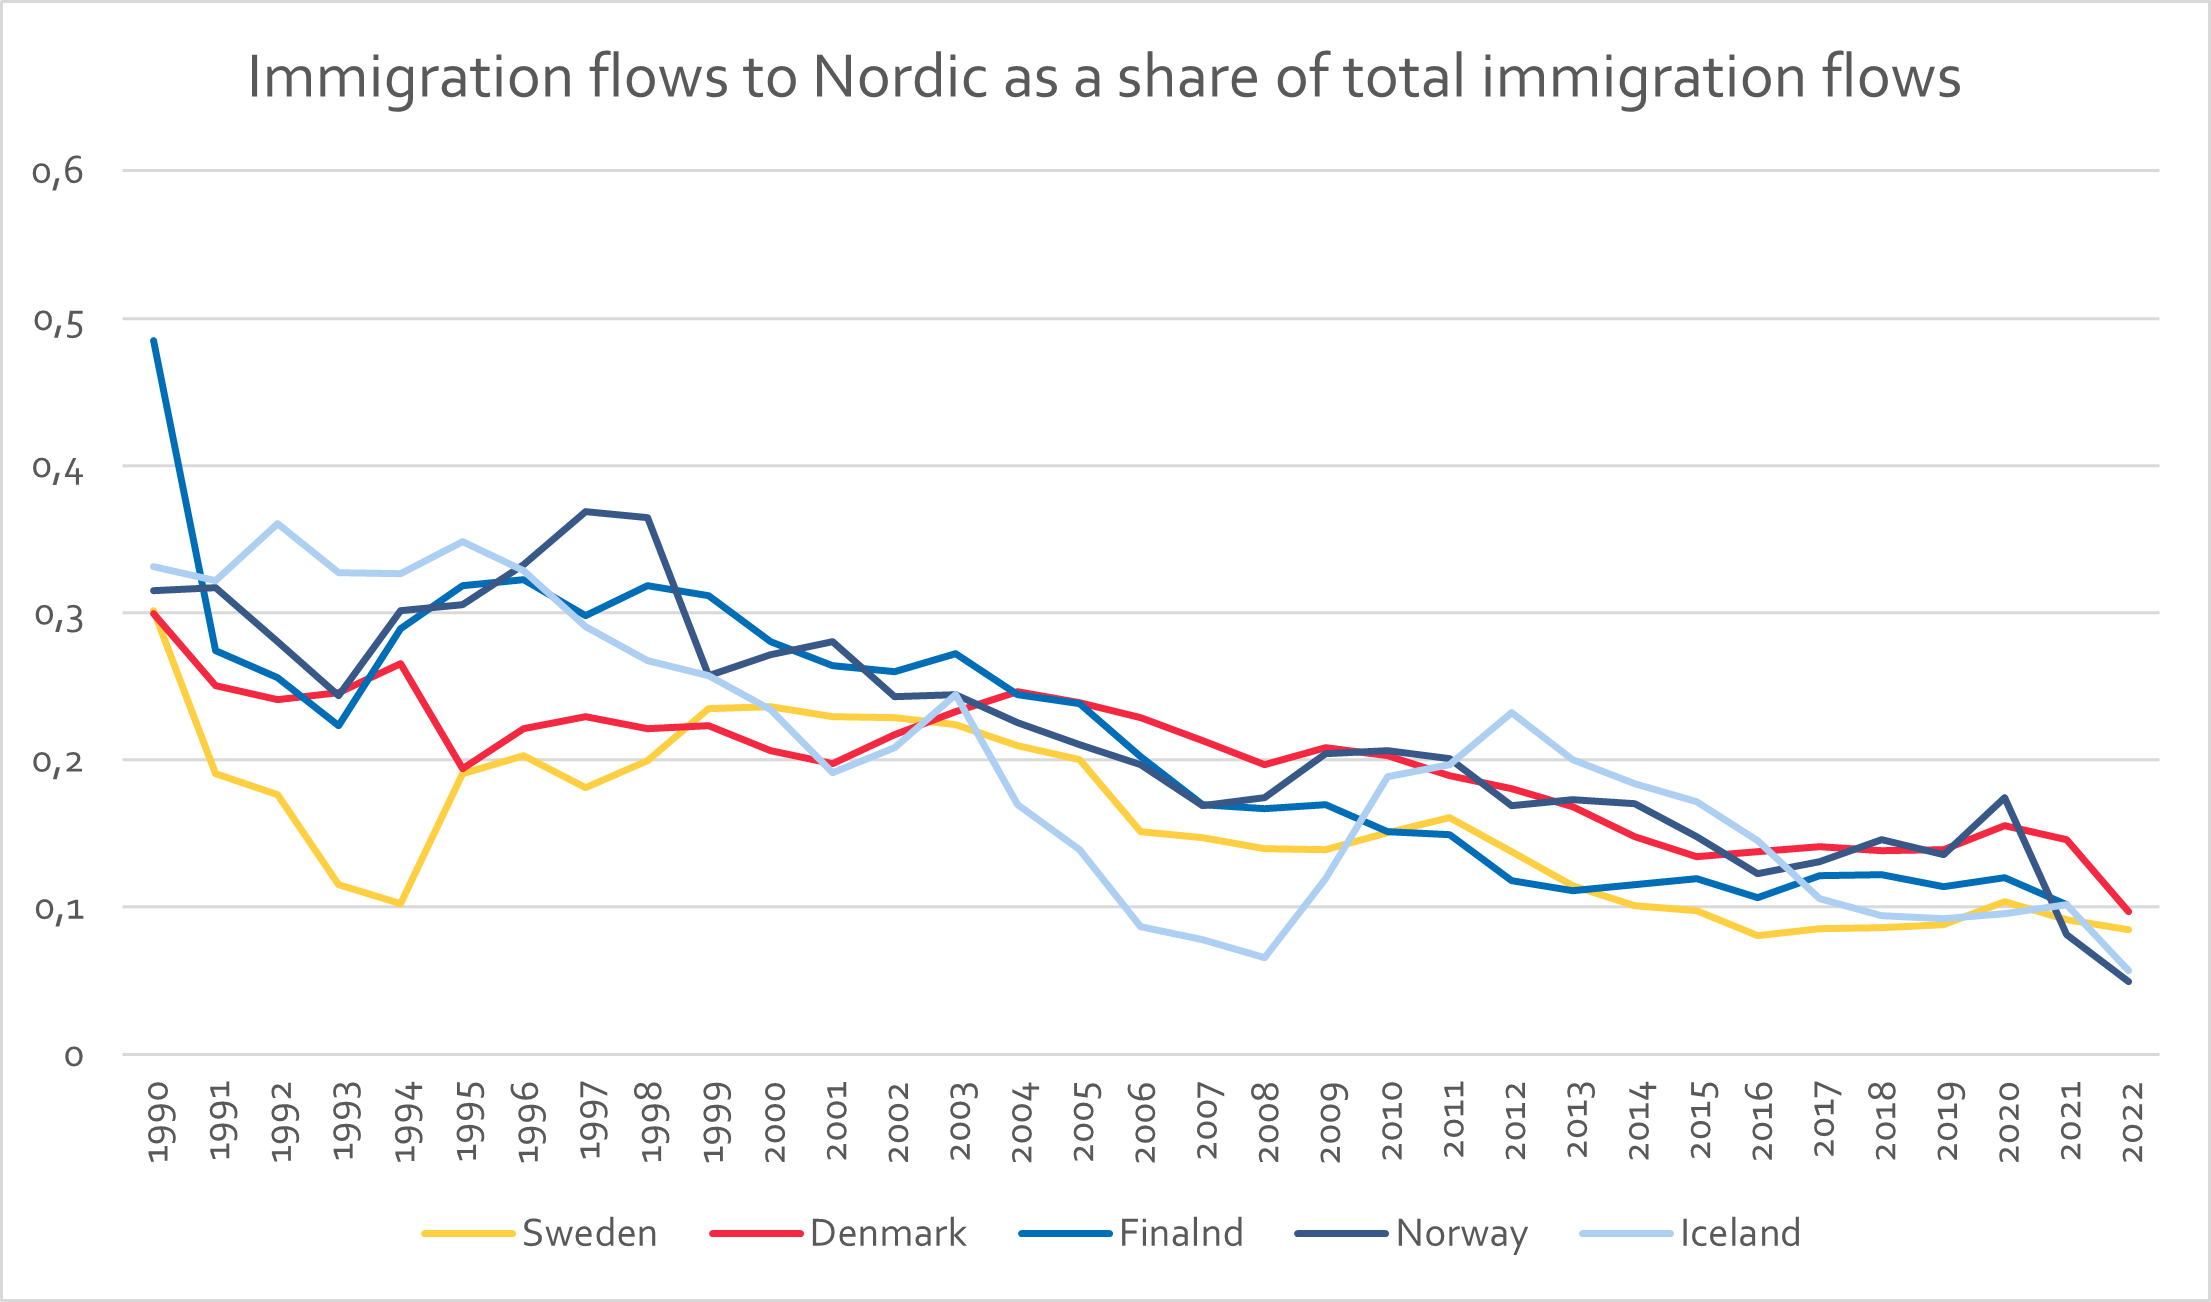
Figure 21 further illustrates the proportion of Nordic immigrants relative to the total immigrant influx in each Nordic country by year. That figure underscores a discernible declining trend, with Nordic immigrants accounting for between 10 to 20% of total immigration by the end of the period in question.
Figure 21: Emigration flows to Nordic countries as a share of total emigration flow.
Source: Own calculation based on Nordic Statistics data
Source: Own calculation based on Nordic Statistics data
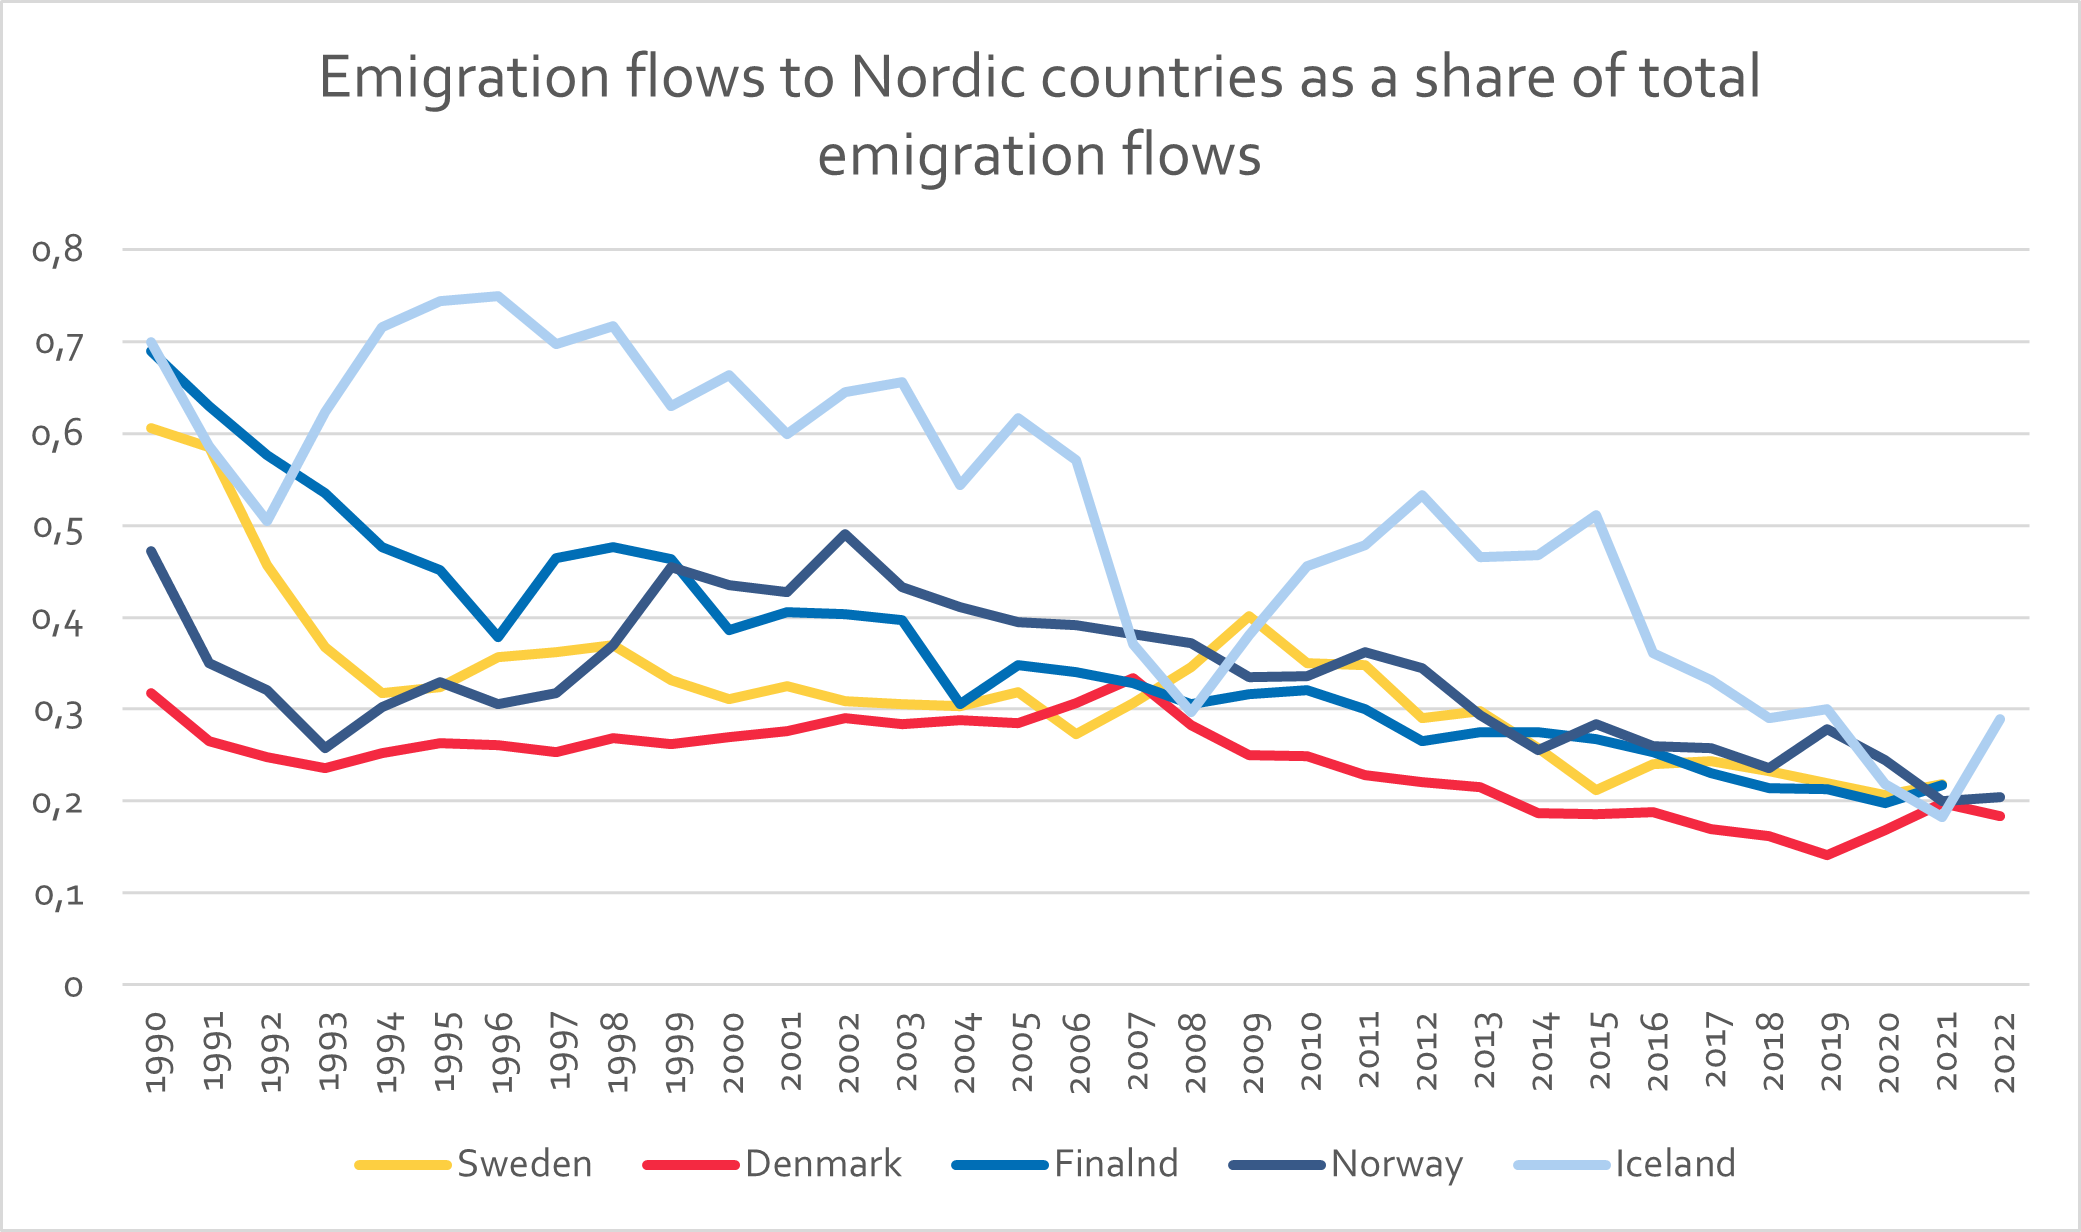
Figure 22: Immigration flows to Nordic as a share of total immigration flows.
Source: Own calculation based on Nordic Statistics data
Source: Own calculation based on Nordic Statistics data
How many Nordic migrants live in another Nordic country?
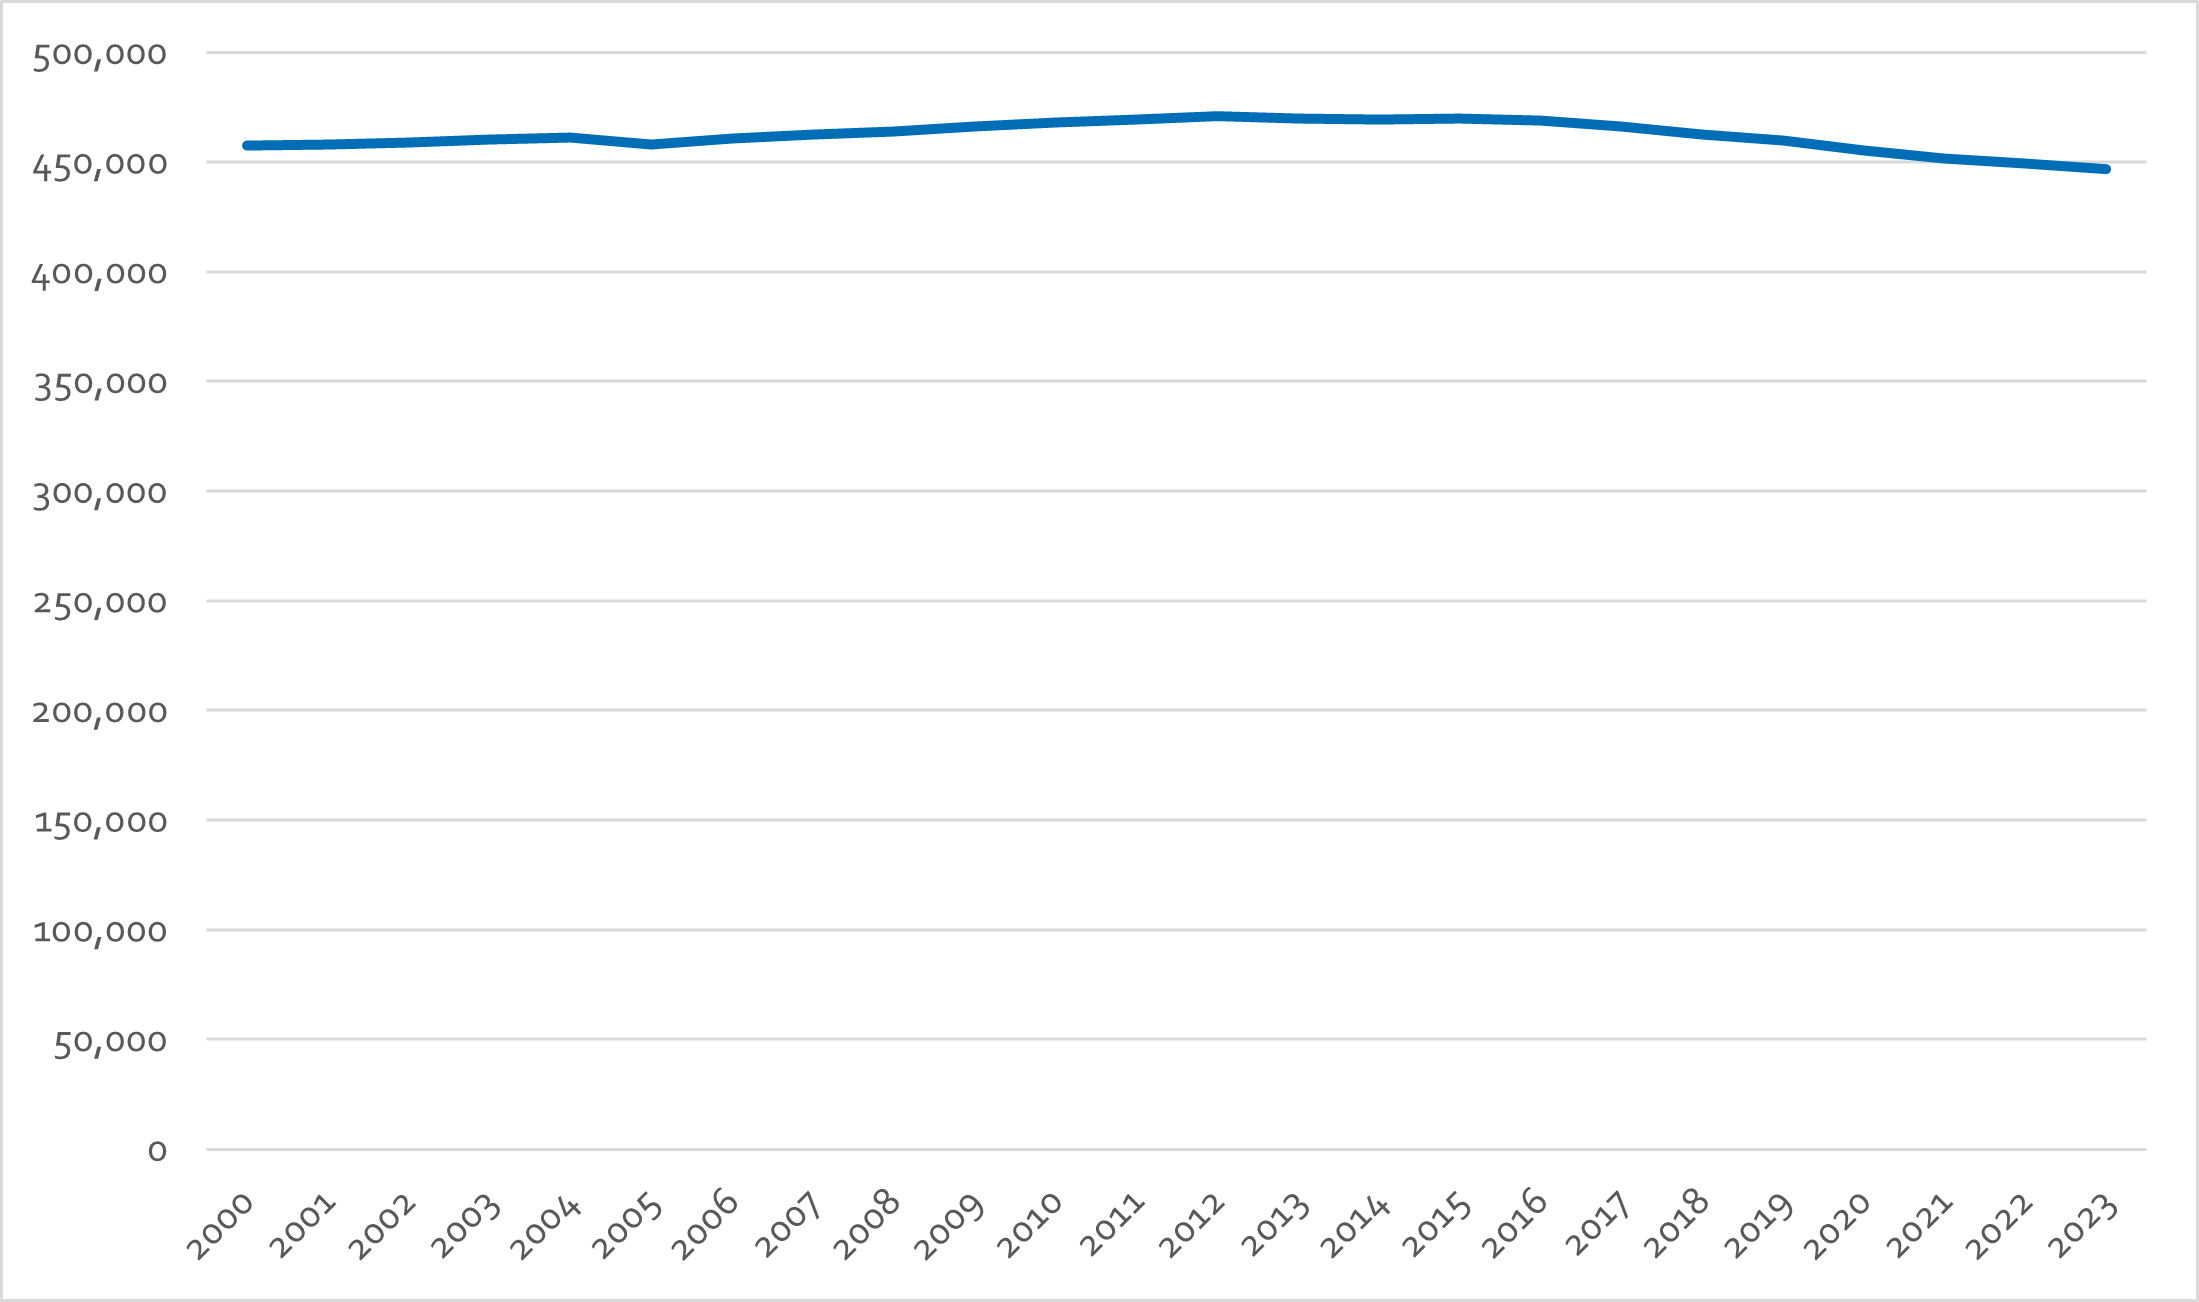
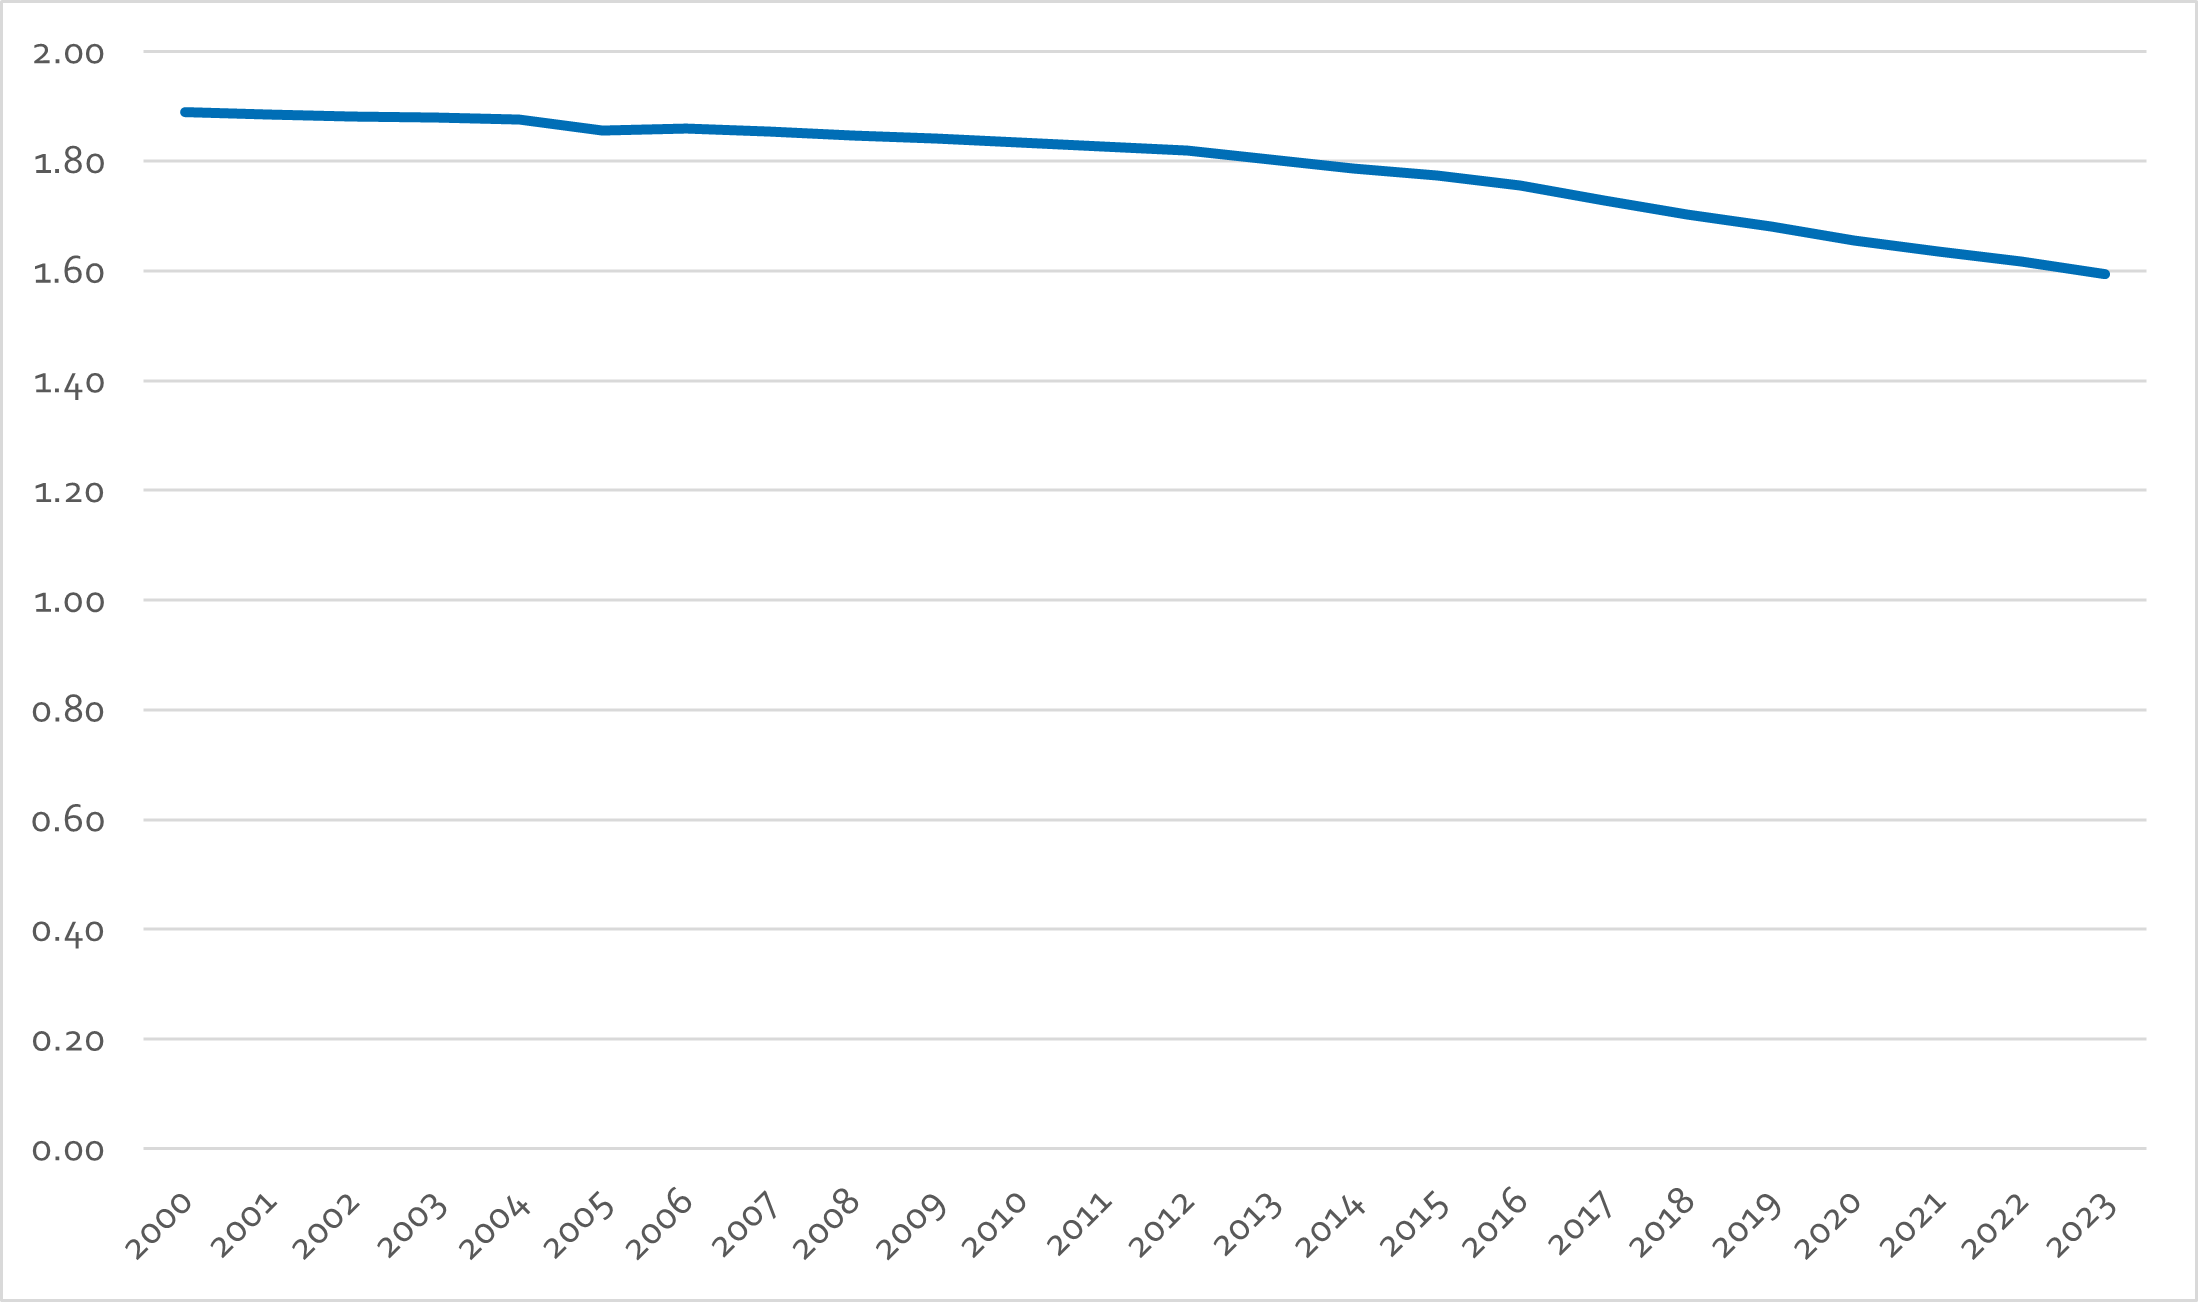
At the beginning of the millennium, in 2000, there were 457,600 Nordic people living in a different Nordic country from the one in which they were born (Figure 23). That corresponds to 1.9% of the entire Nordic population. In other words, one in fifty Nordic-born people had moved from their birth country to another Nordic country.
Note that we do not have information concerning the proportion of Nordic citizens living in other countries outside the Nordic Region.
In 2023, around 446,500 Nordic people were living in another Nordic country, corresponding to 1.6% of the total Nordic population. That implies that fewer people are taking advantage of the freedom of movement that the common Nordic labour market offers. The share of Nordic migrants among the total population is also lower than the comparative number of internal migrants in the European Single Market, which allows freedom of movement to EU citizens. At EU level, 3.9% of European citizens of working age lived in an EU member state other than their country of birth in 2021 (European Commission, 2023).
Figure 23: Nordic migrants, 2000-2023 (in absolute numbers and in percent)
Source: Own calculations based on Nordic Statistics Database.
Source: Own calculations based on Nordic Statistics Database.
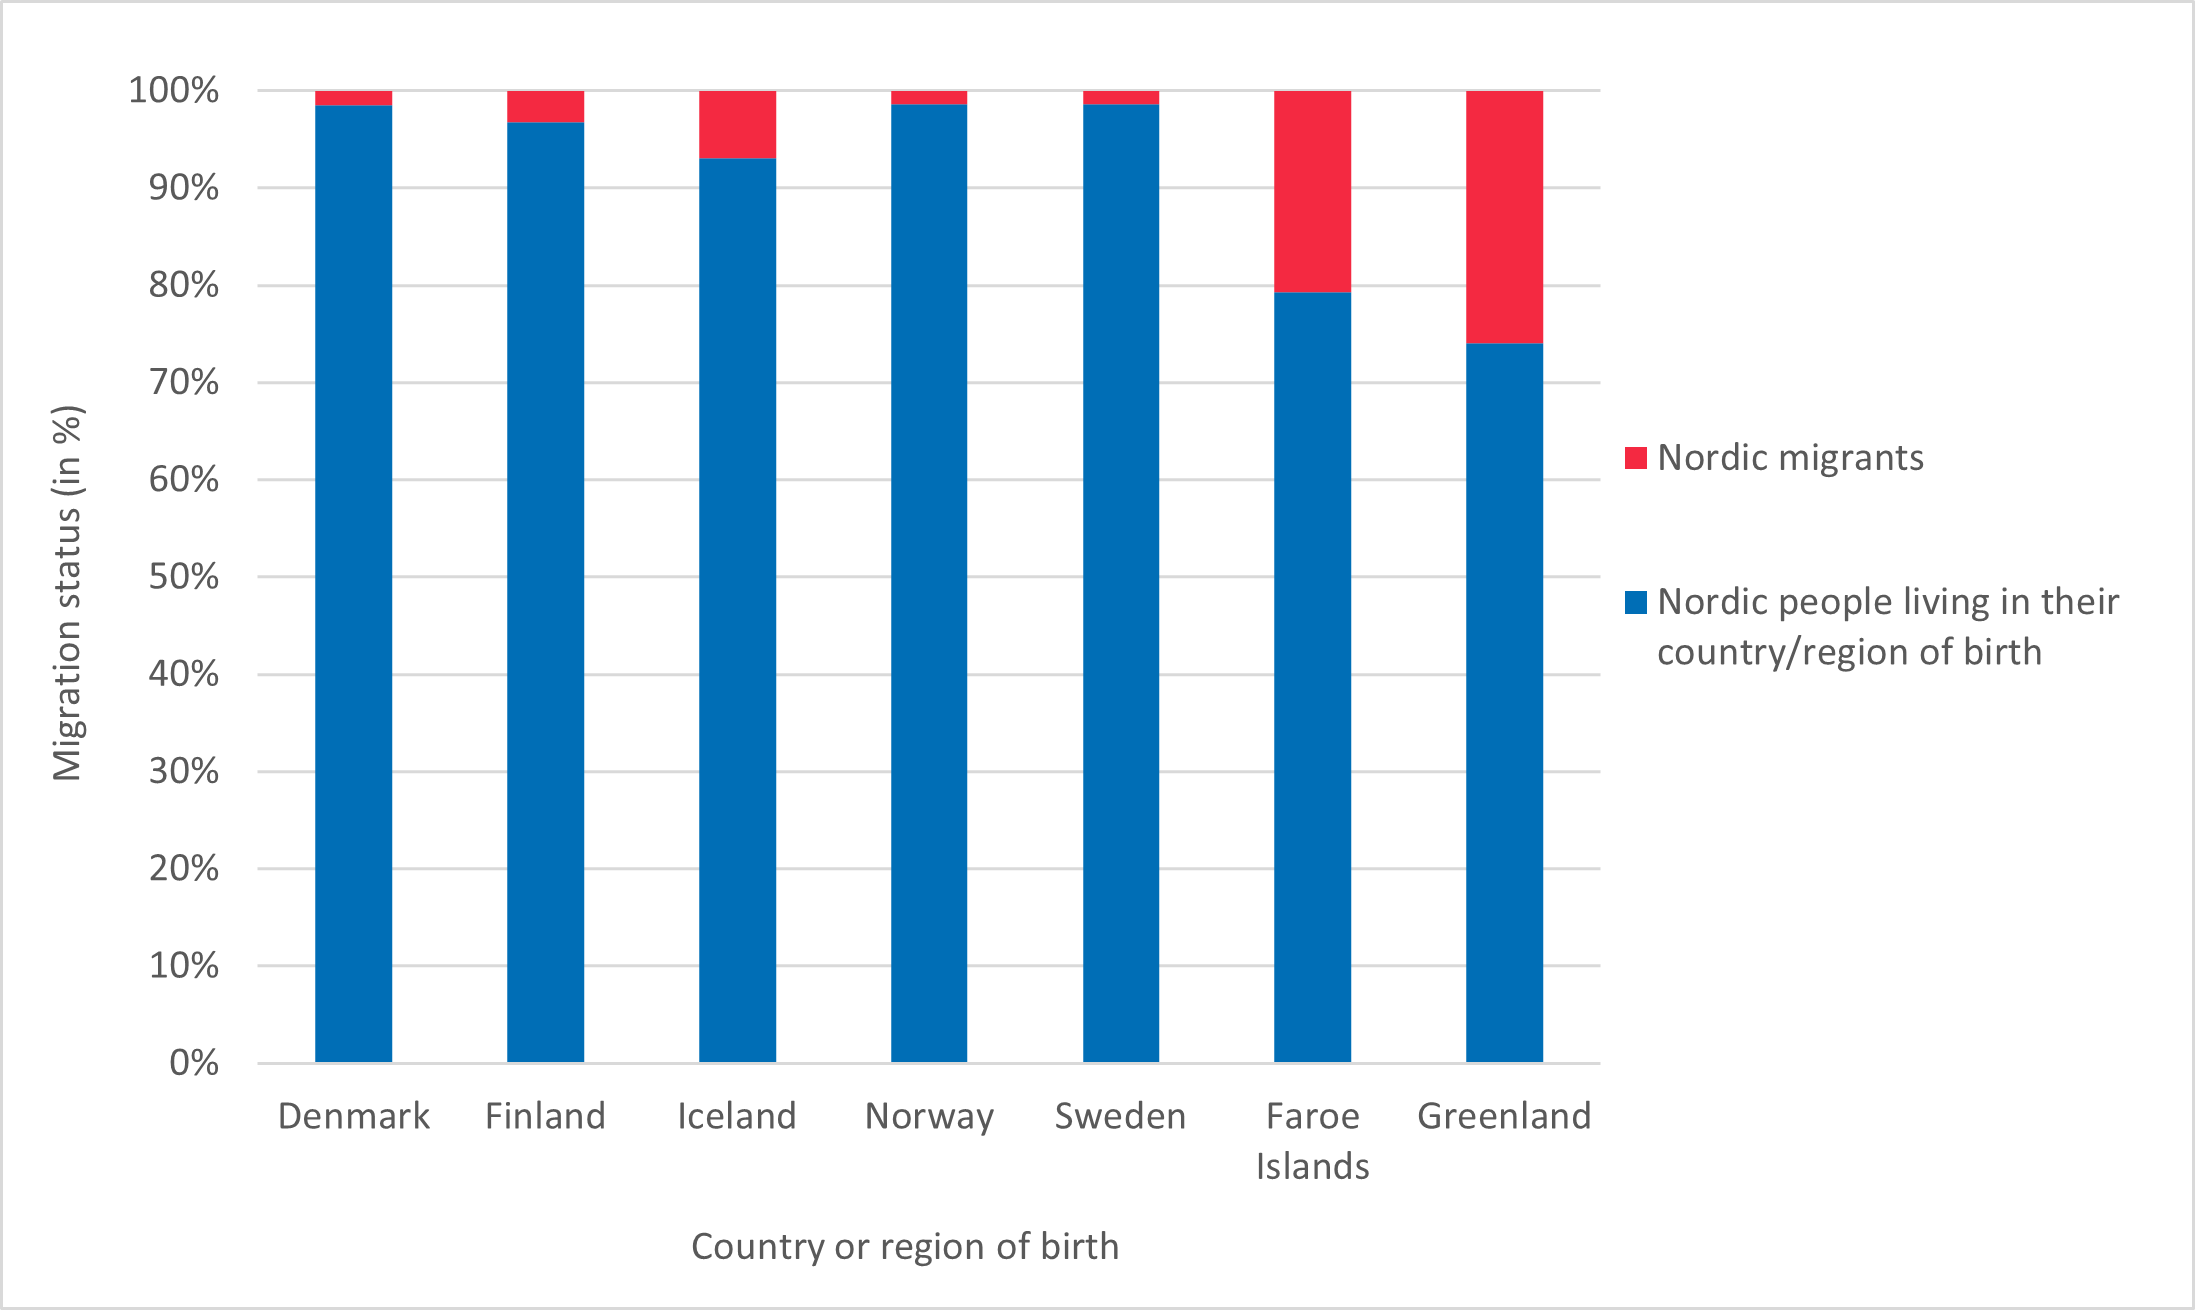
In Nordic comparison, people from some countries and autonomous regions are more prone to move than others, as seen in Figure 24. The figure considers all people who were born and still live in the Nordic Region and then distinguishes between those who live in their country or autonomous territory of birth and those who live in another Nordic country or territory.
Note that the figure does not include people who were born in one of the Nordic countries or autonomous regions and have since moved to third countries outside the Nordic Region. Those emigrants are not included in the statistics that were used to create the figure.
Figure 24: Nordic migrants and Nordic people living in their country or autonomous region of birth, 2023 (in % of population).
Note: Existing statistics show the composition of Nordic migrants who live in Åland, but data are not available regarding the residence of people from Åland abroad. People born in Åland who live elsewhere in the Nordic Region are registered as Finnish born in the statistics of other Nordic countries.
Source: Nordic Statistics Database.
Where do Nordic migrants live?
Interesting patterns emerge when analysing where Nordic migrants live. Some Nordic countries appear to be more popular destinations than others (Figure 25). Proximity, a shared language and migration history all seem to play a role (Pedersen, Røed & Wadensjö, 2008; Lundgren & Wøien Meijer, 2022). Most notably, among people who were born in Greenland and the Faroe Islands, almost all live in Denmark. Indeed, according to Mortensen Nolsøe (2017) and Hayfield (2017), a Faroese expression states that “half of all Faroe Islanders have lived in Denmark at some stage of their lives”, contributing to an ingrained “culture of migration”. According to the same studies, key reasons for Faroese people to move to Denmark include access to more diverse education and career opportunities. Importantly, as many as half of all Faroese islanders who have completed tertiary education abroad return to the Faroe Islands later in their lives, thereby counteracting a permanent brain drain (Mortensen Nolsøe, 2017). Similarly, many young people from Greenland move to Denmark to study and consider their education not only as important for themselves, but also for Greenland’s future (Flora, 2017).
Figure 25: Nordic migrants by place of birth and place of residence (in %), 2023
Note: Data on the number of Faroese- and Greenland- born people living in Sweden and Finland are not available. For Åland, data availability is limited: available statistics show Nordic migrants who live in Åland, but data are not available regarding the residence of people from abroad. People born in Åland who live elsewhere in the Nordic Region are registered as Finnish citizens in the statistics of other Nordic countries.
Source: Nordic Statistics Database.
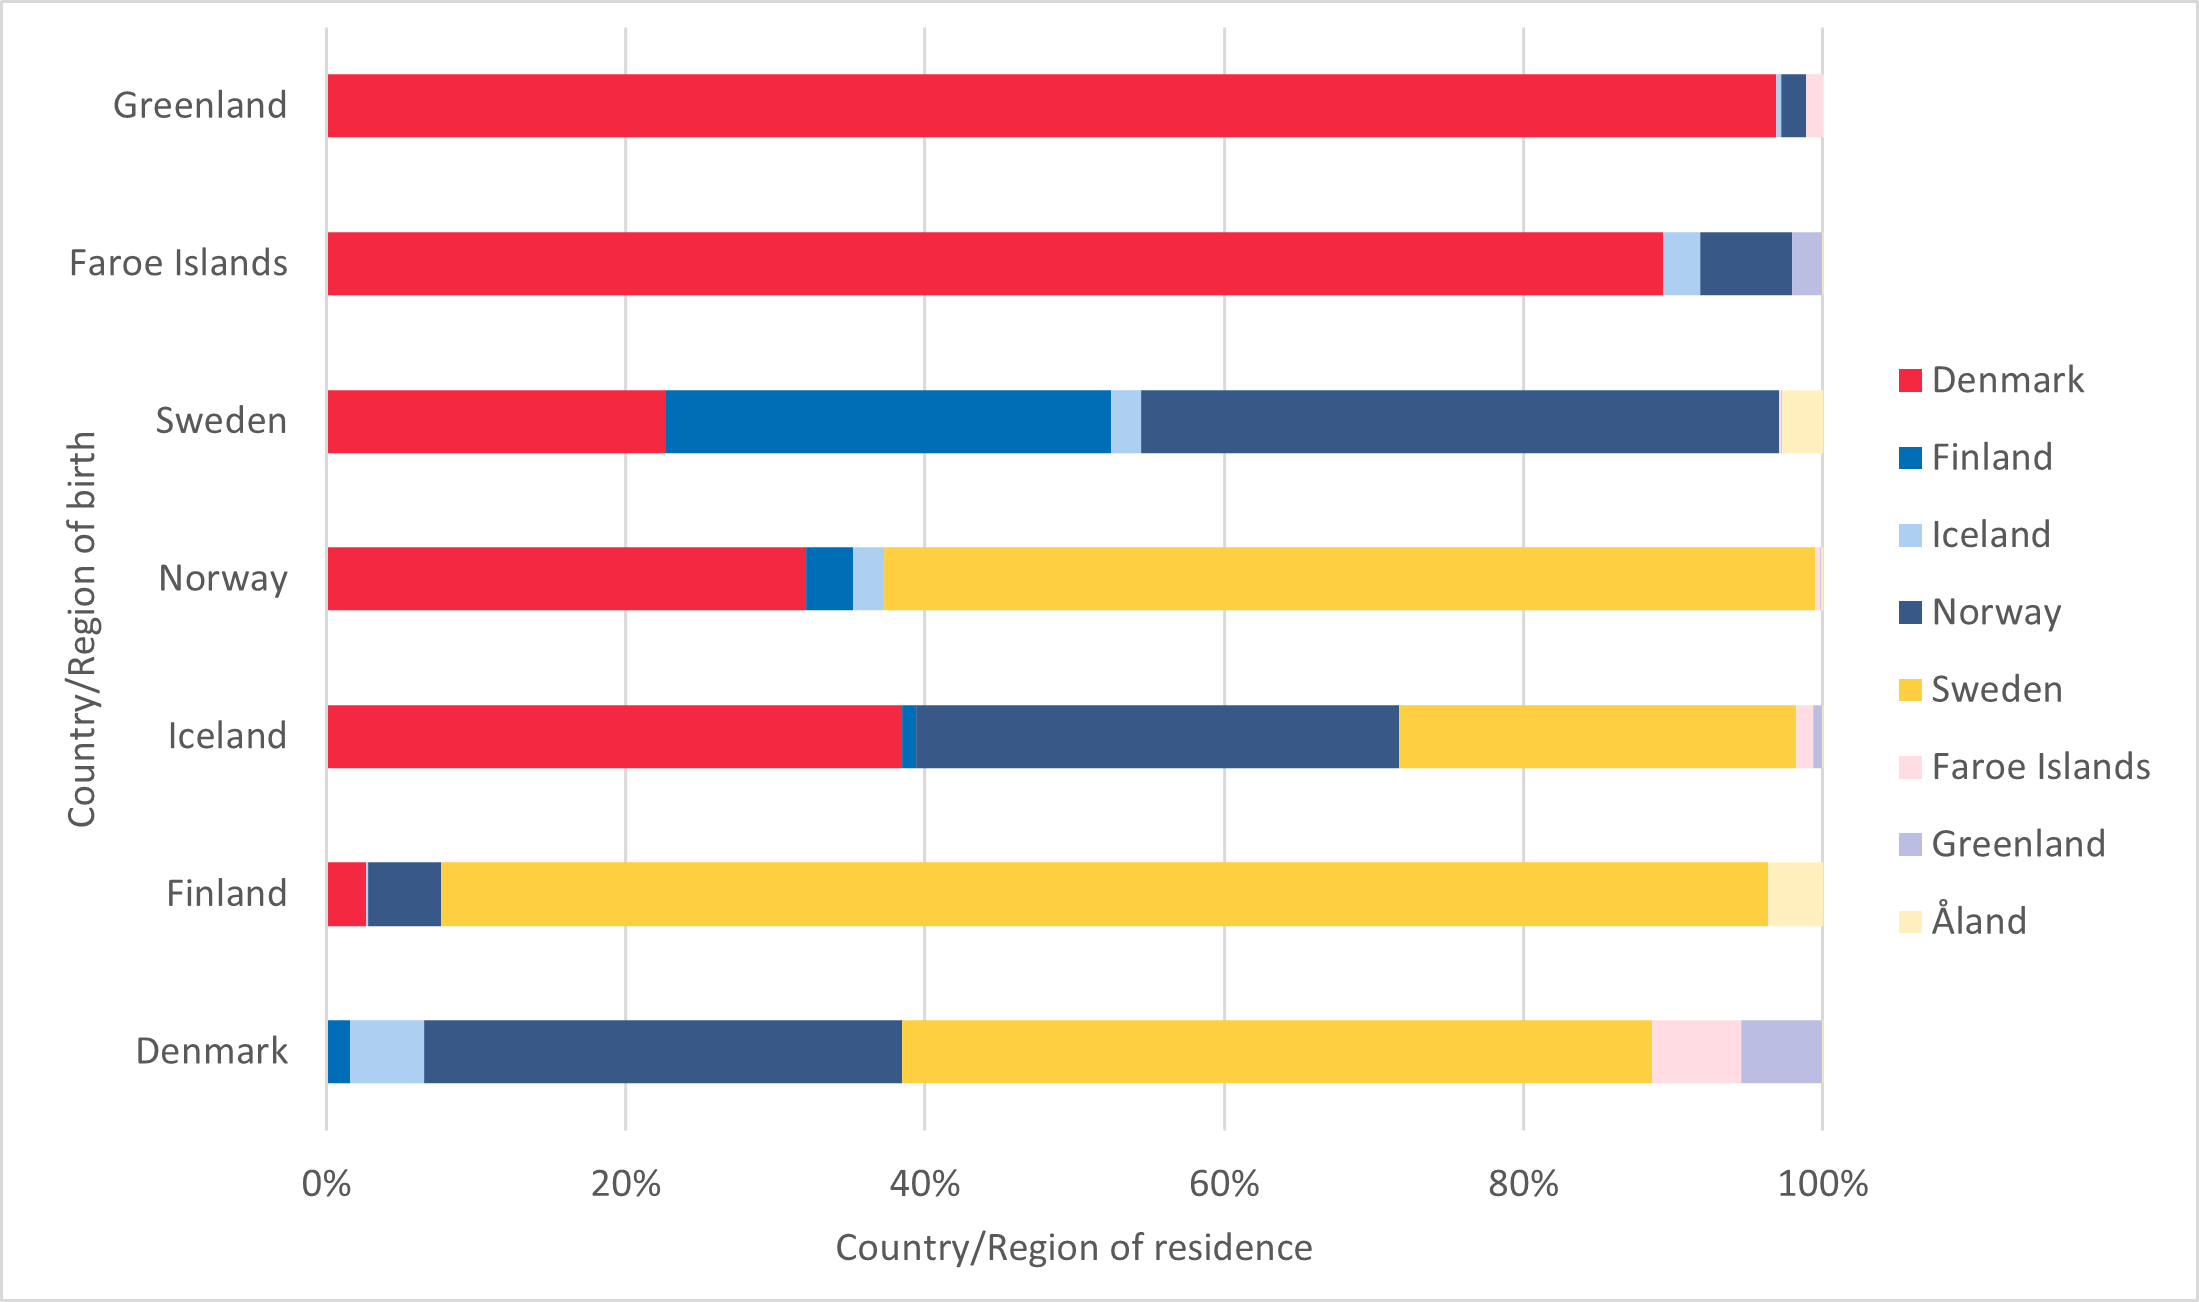
Among Finnish migrants in the Nordic Region, a large majority (89%) live in Sweden. Sweden was a particularly important destination country for Finnish emigrants during the late 1960s (see Chapter 2.2). Many Finns moved to Sweden during this period to work and many of them have remained. Åland and Norway also host groups of Finnish-born migrants (between 4% and 5% of Finnish migrants in the Nordic Region).
For the other Nordic countries, patterns are more mixed, with less pronounced preferences when it comes to choosing a country of destination. Among Swedish-born migrants in the Nordic Region Norway is a popular place to live, but so too are Denmark and Finland. There are fairly large numbers of people born in Iceland living in Denmark, but also in Norway and Sweden, while many migrants from Denmark have settled in Sweden and Norway.
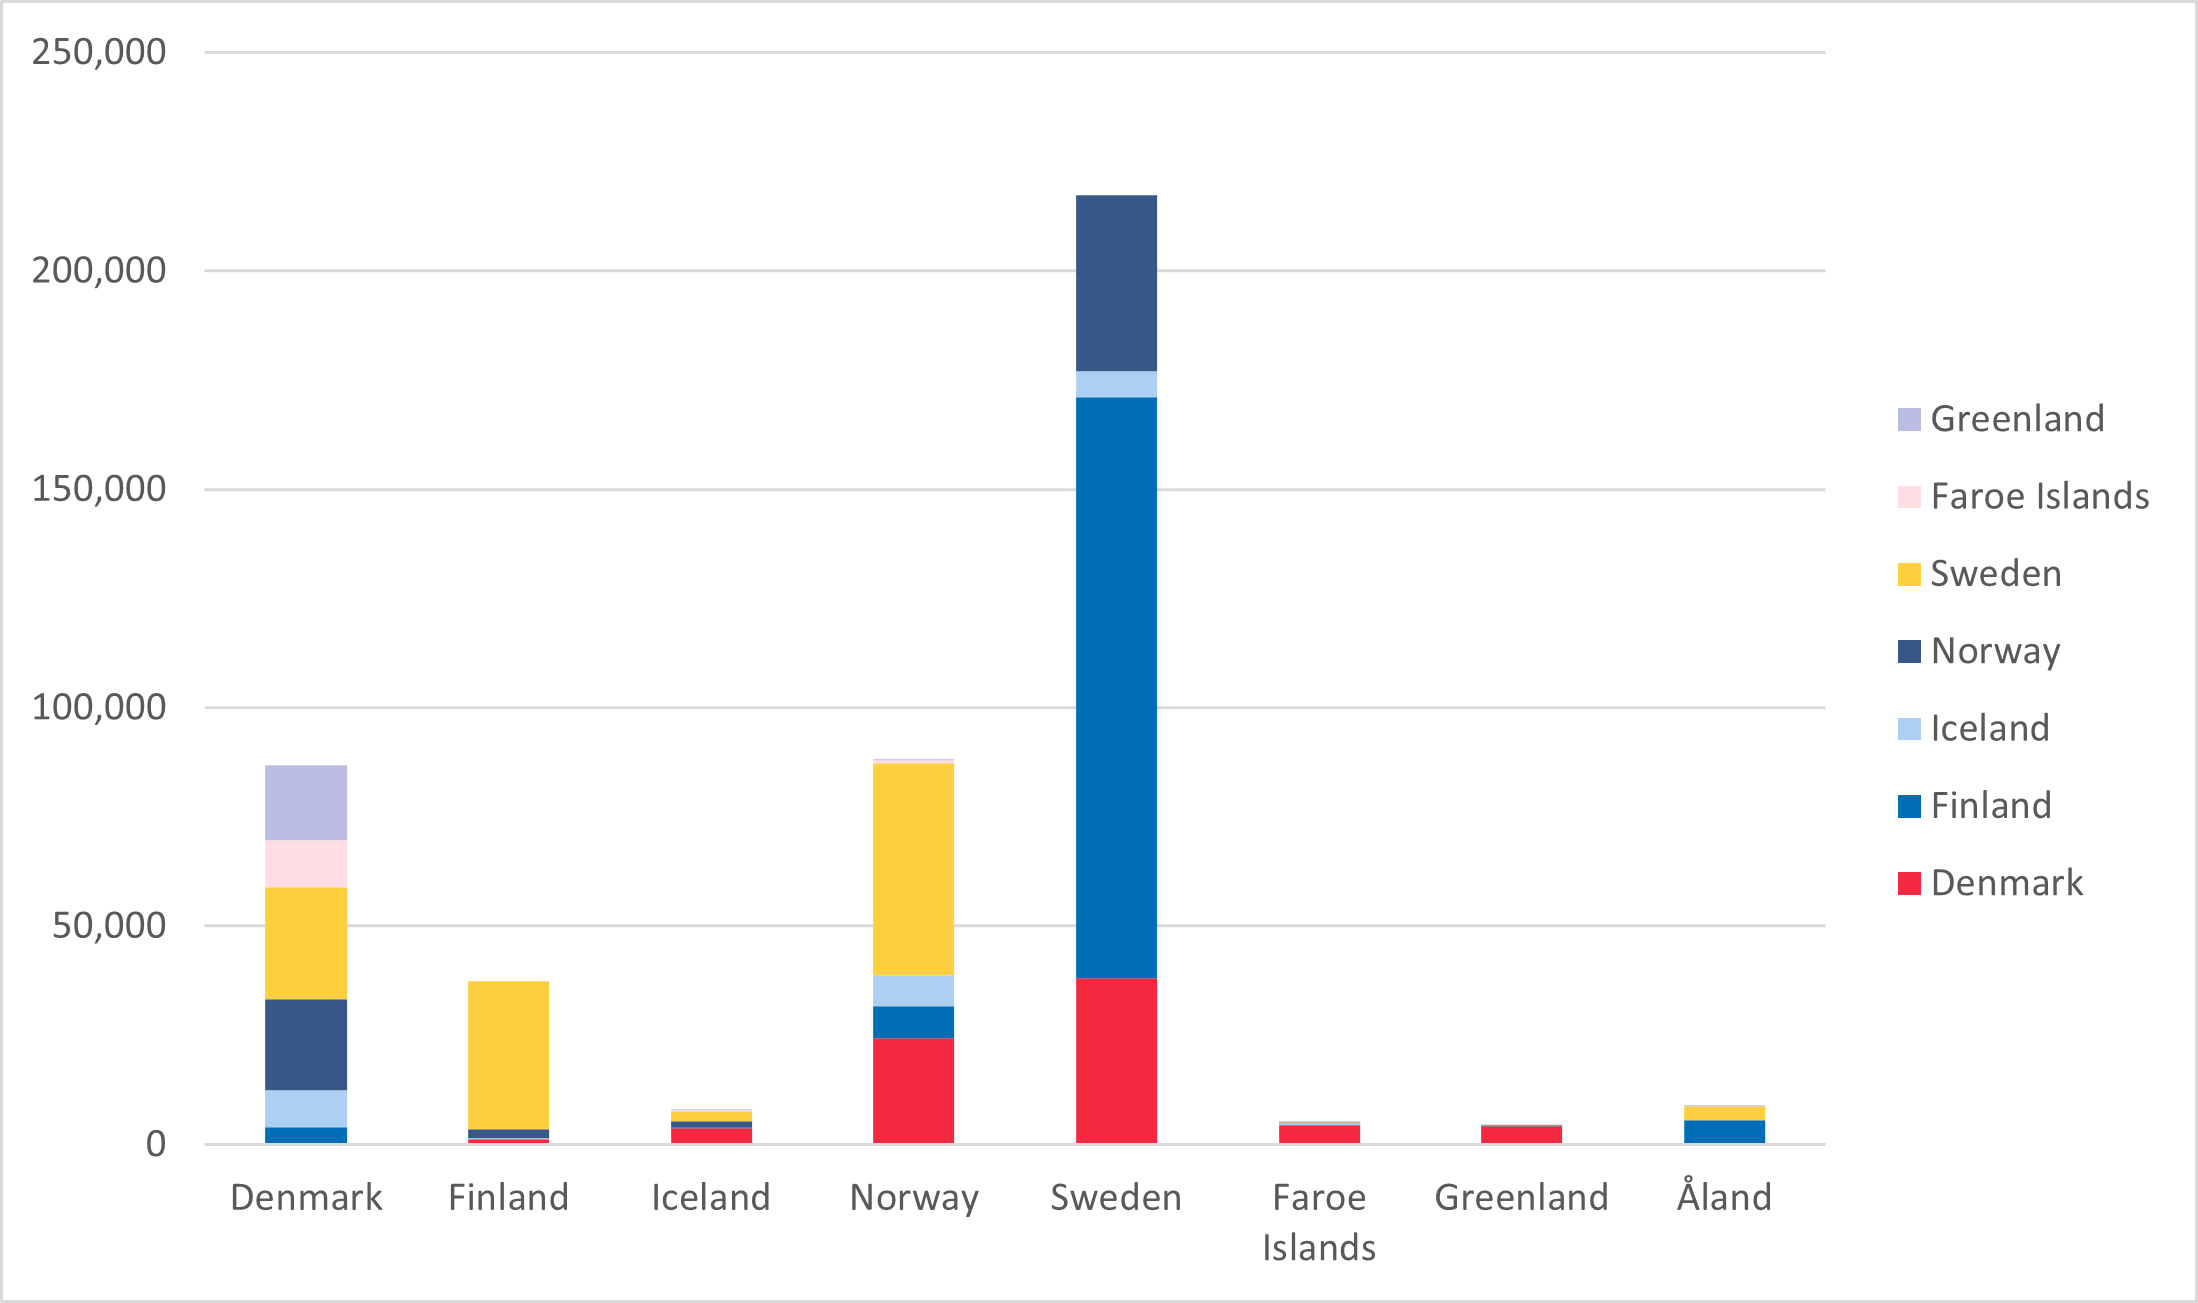
Looking at the absolute number of Nordic migrants, Sweden is the most popular destination (Figure 26). Around 217,300 Nordic migrants live there according to the most recent data, with the majority (around 133,000 persons) coming from Finland. Denmark and Norway host relatively equal numbers of Nordic migrants, namely around 87,000 and 88,000 persons respectively. In both countries, the largest group of Nordic migrants come from Sweden. The other Nordic countries and autonomous regions have smaller groups of Nordic migrants.
Figure 26: Total number of Nordic migrants living in each Nordic country and autonomous region (2023)
Note: Data on the number of Faroese- and Greenland- born people living in Sweden and Finland are not available.
Source: Nordic Statistics Database.
Note: Data on the number of Faroese- and Greenland- born people living in Sweden and Finland are not available.
Source: Nordic Statistics Database.
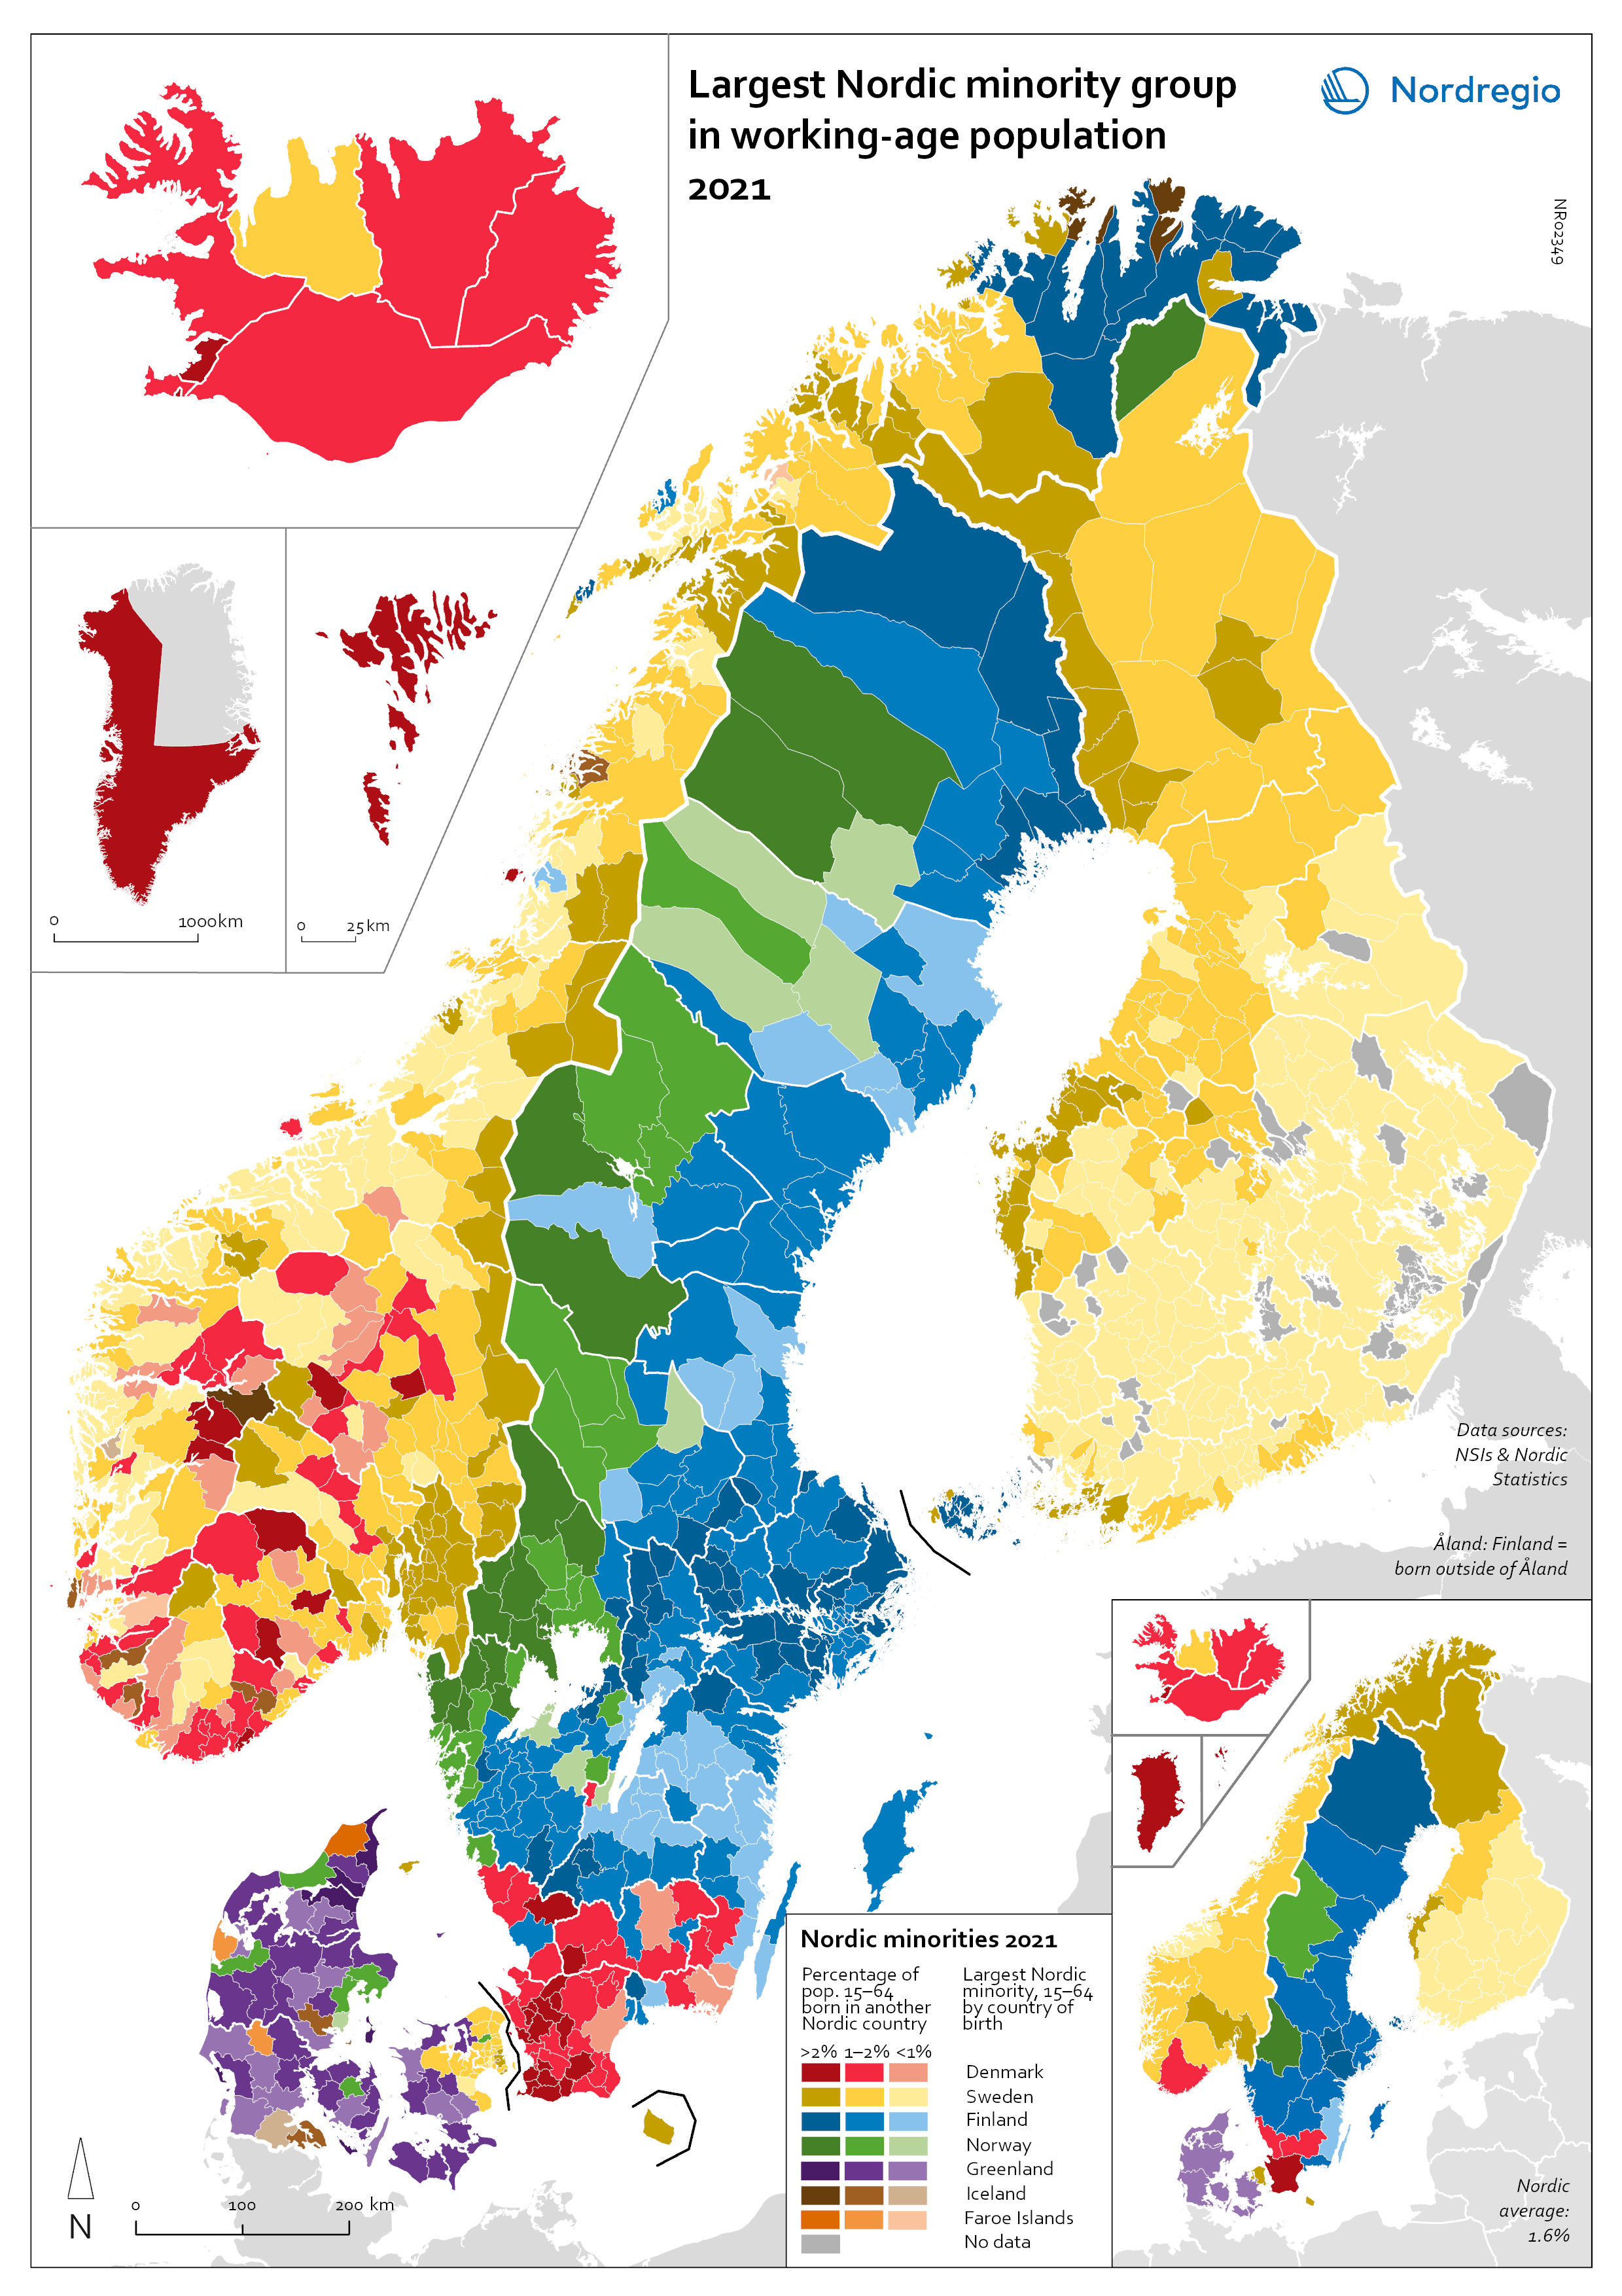
When Nordic citizens move to another Nordic country, many prefer to settle close to their country of birth, as indicated by Map 1. For each Nordic municipality, the map shows the largest Nordic minority group that has settled there. The darker the colour, the larger the Nordic population as a share of the total local population. As can be seen, many migrants from Finland have settled in the northern and eastern parts of Sweden and northern Norway. Swedish-born migrants live in greater numbers in municipalities across Finland, in Norway and across the Öresund Strait in Denmark, while many Norwegians live just across the Swedish border. Danes have settled in larger numbers in southern Sweden and southern Norway – again, in closer proximity to their country of birth.
Map 1: Largest Nordic minority group in working-age population 2021.
Source: Norlén et al. (2022)
Who are the Nordic migrants?
Existing research literature on international migration tells us that migrants tend to be young (Yeung et al., 2023; Rogers and Castro, 1981). Possible reasons for this are that young people have not yet invested in property and careers in their home countries to the same extent as their older peers, are less likely to have started a family
Note, however, that some young migrants already have children and very young children also tend to be overrepresented among international migrants. That changes once children reach school age, when families become less prone to move internationally.
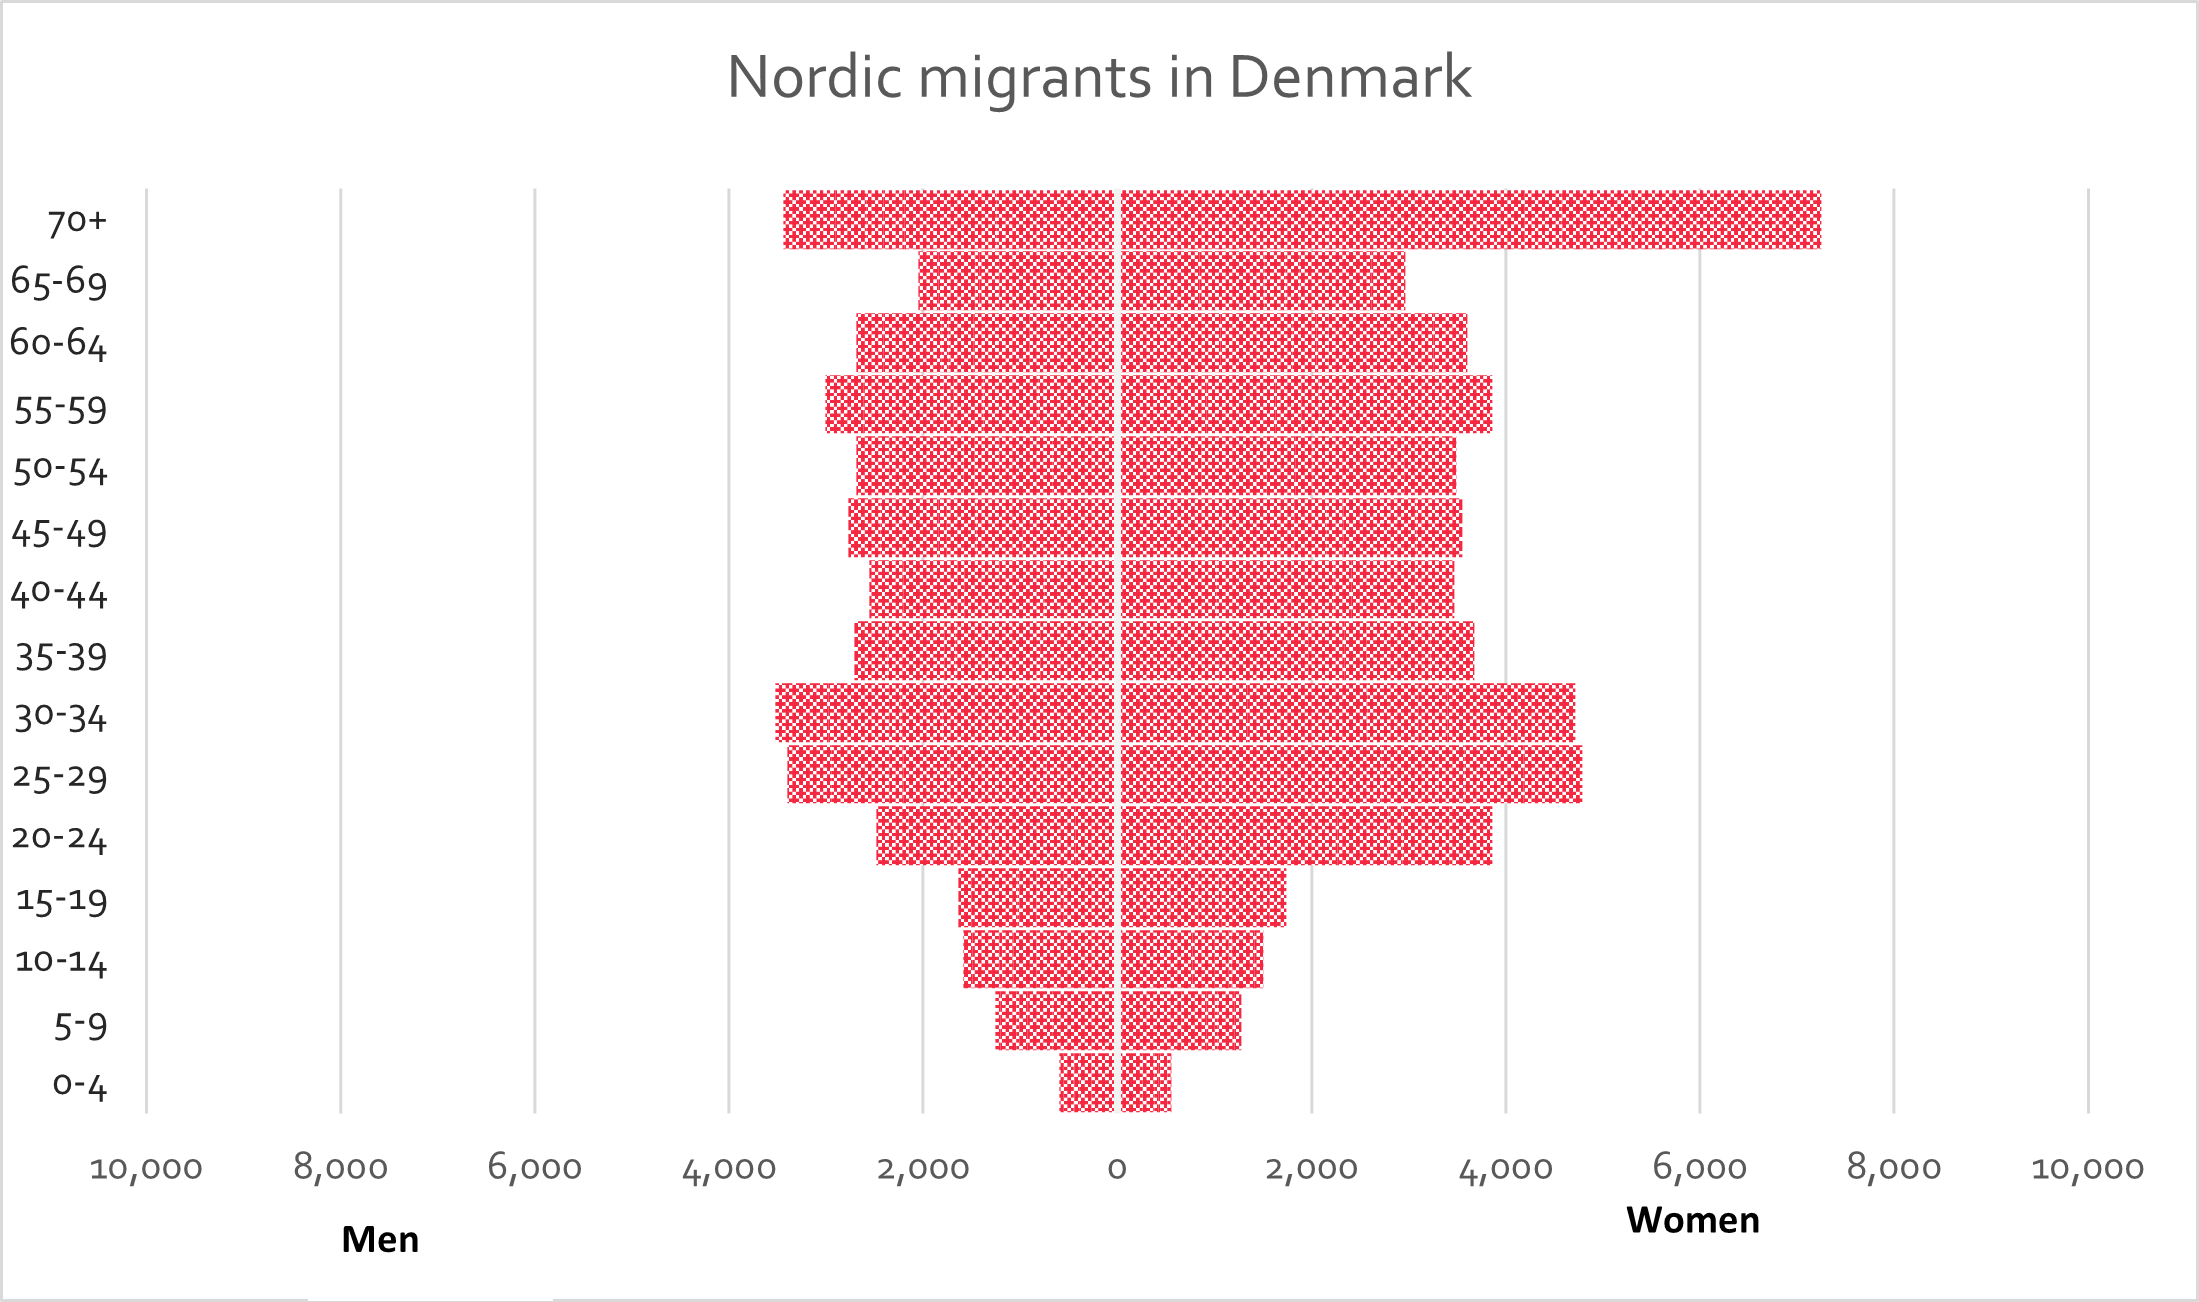
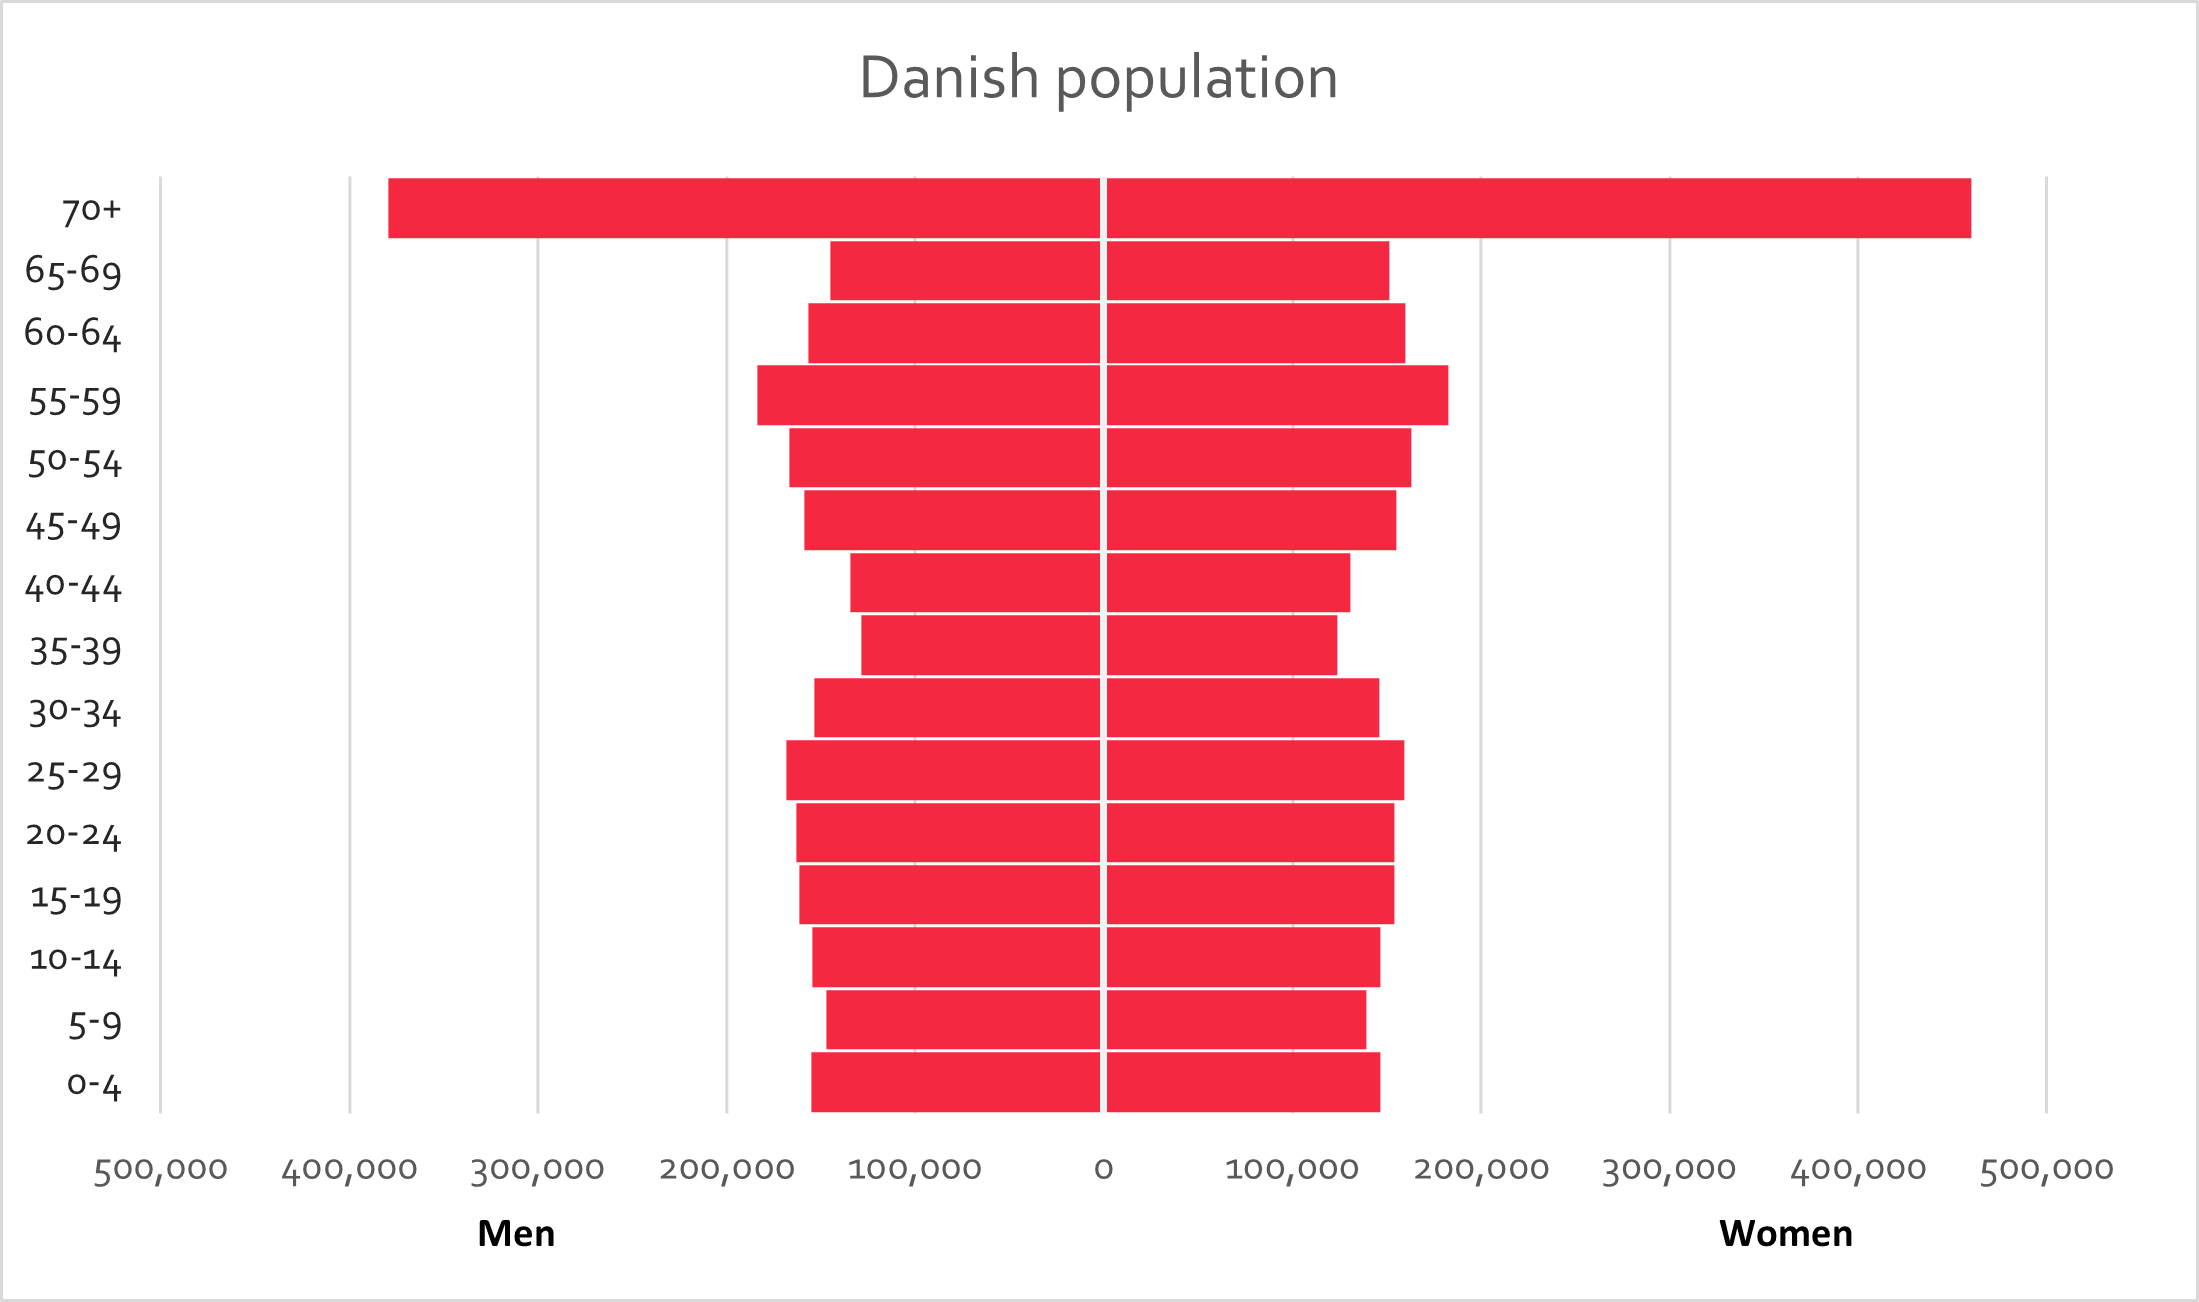
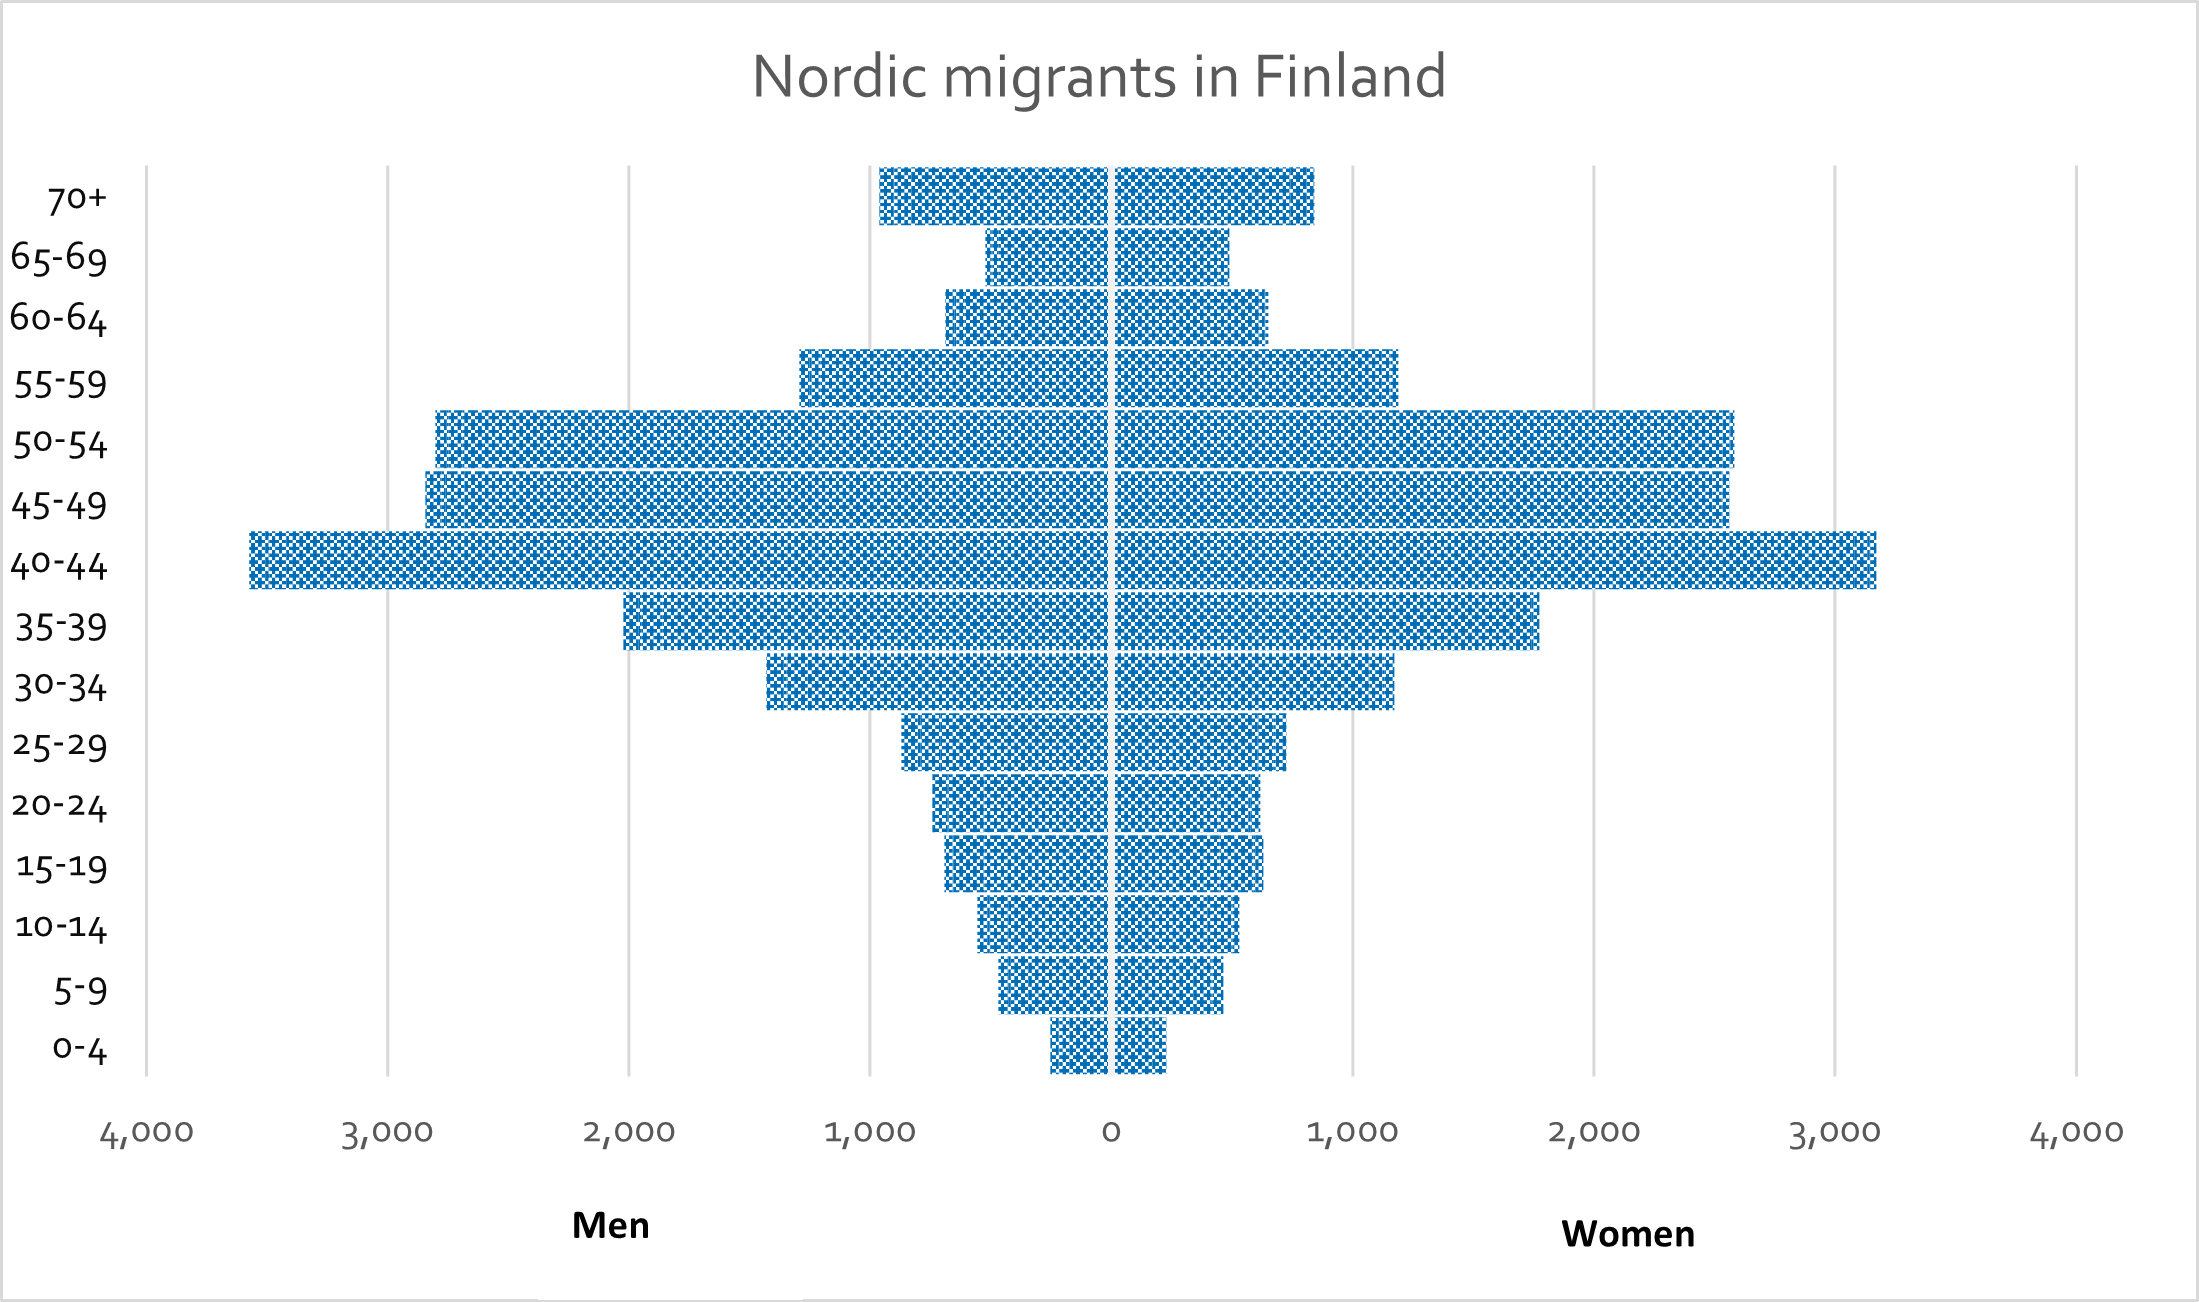
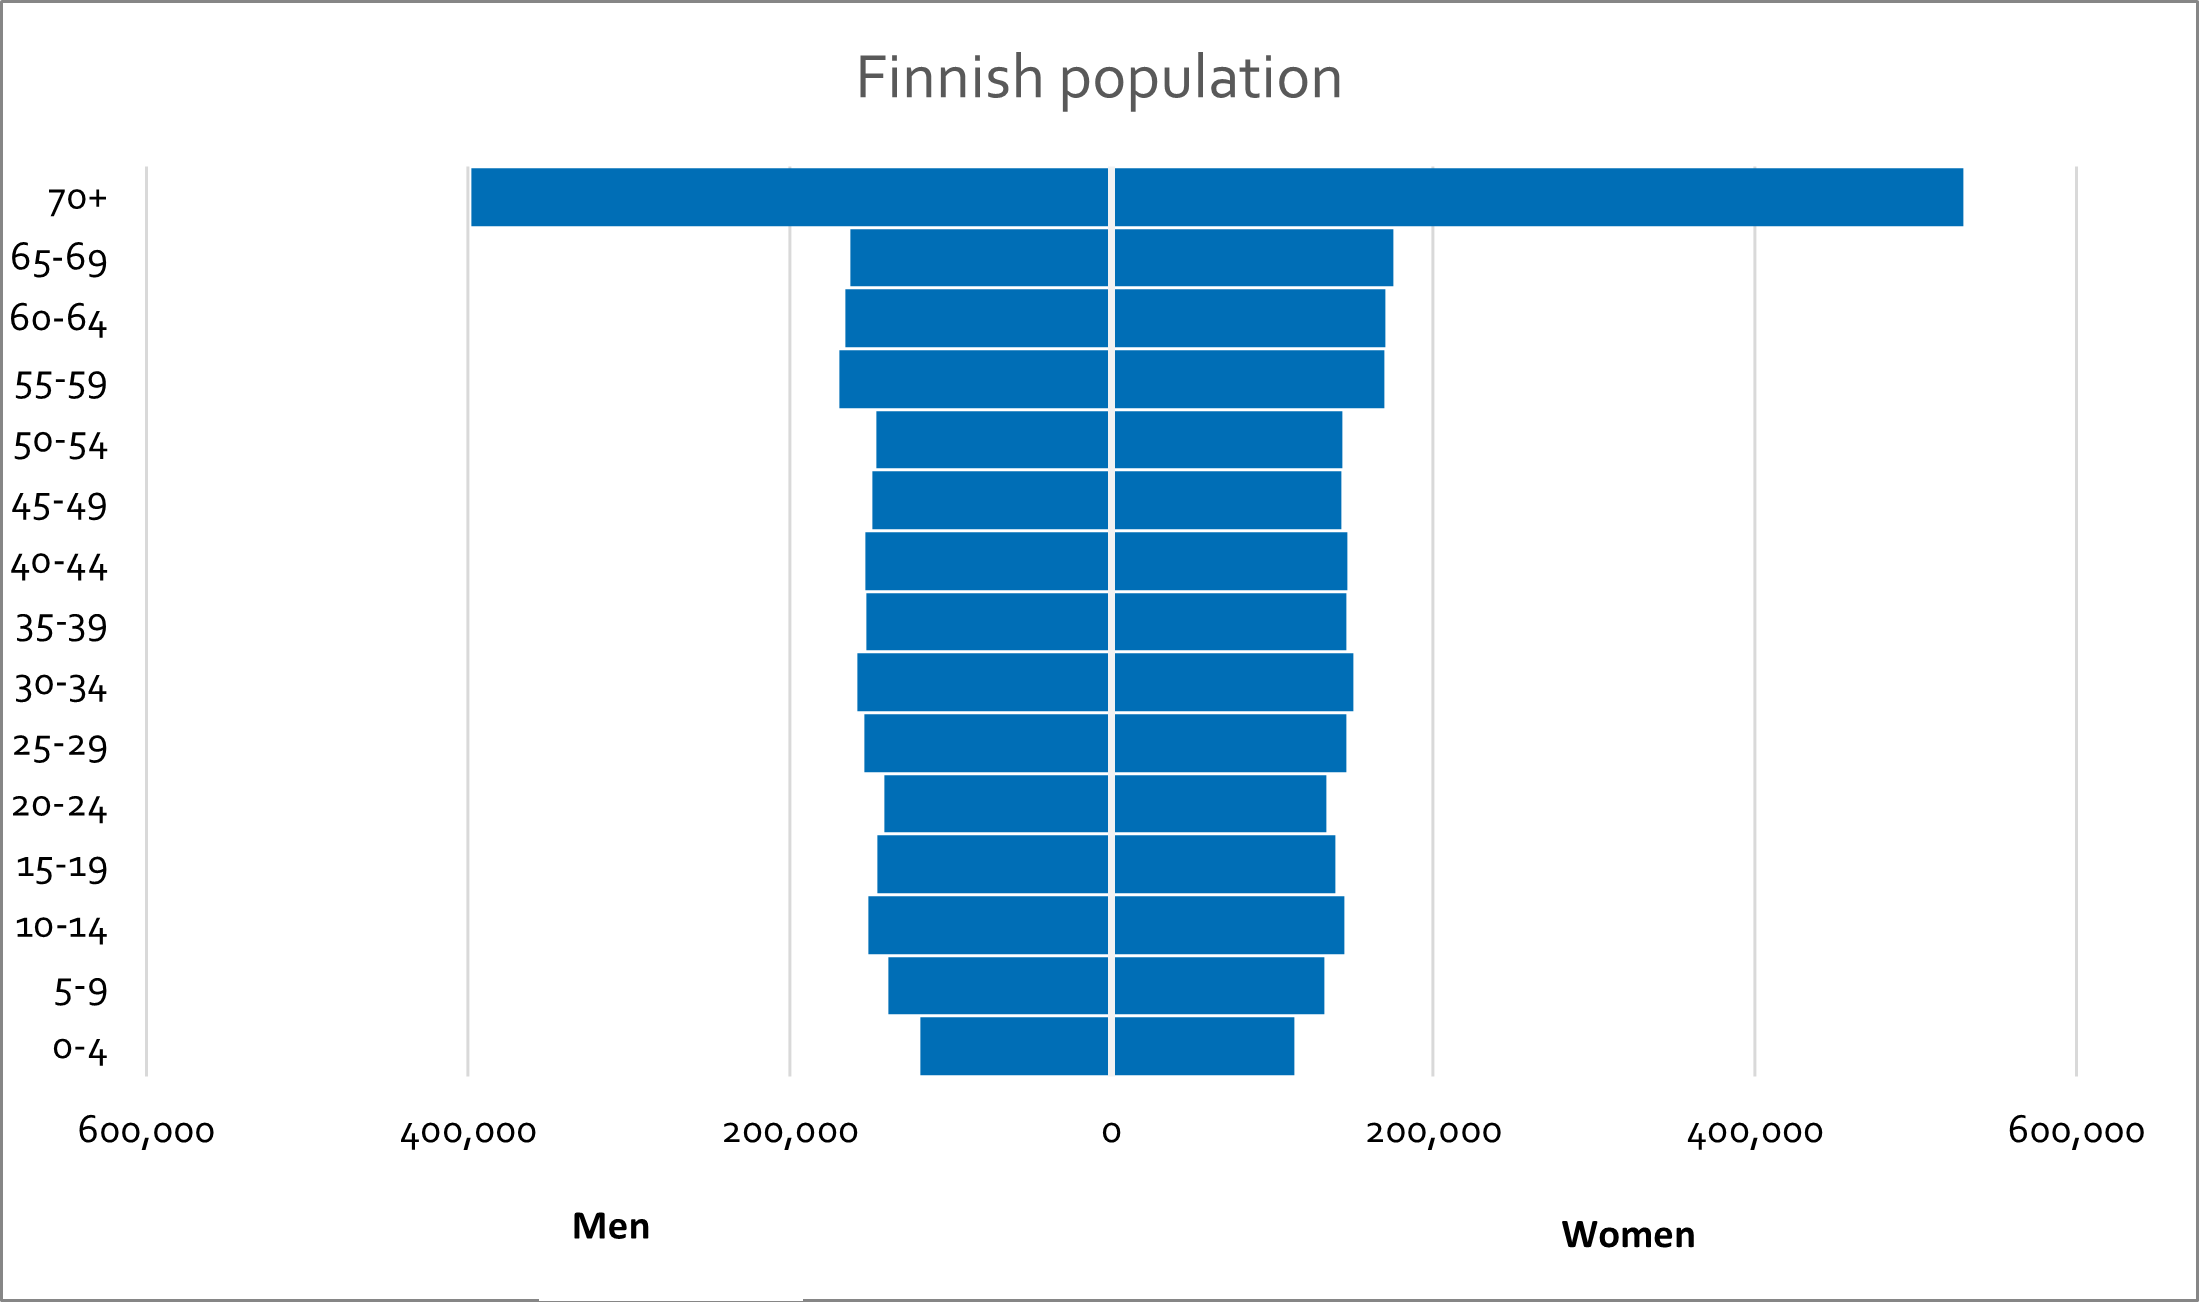
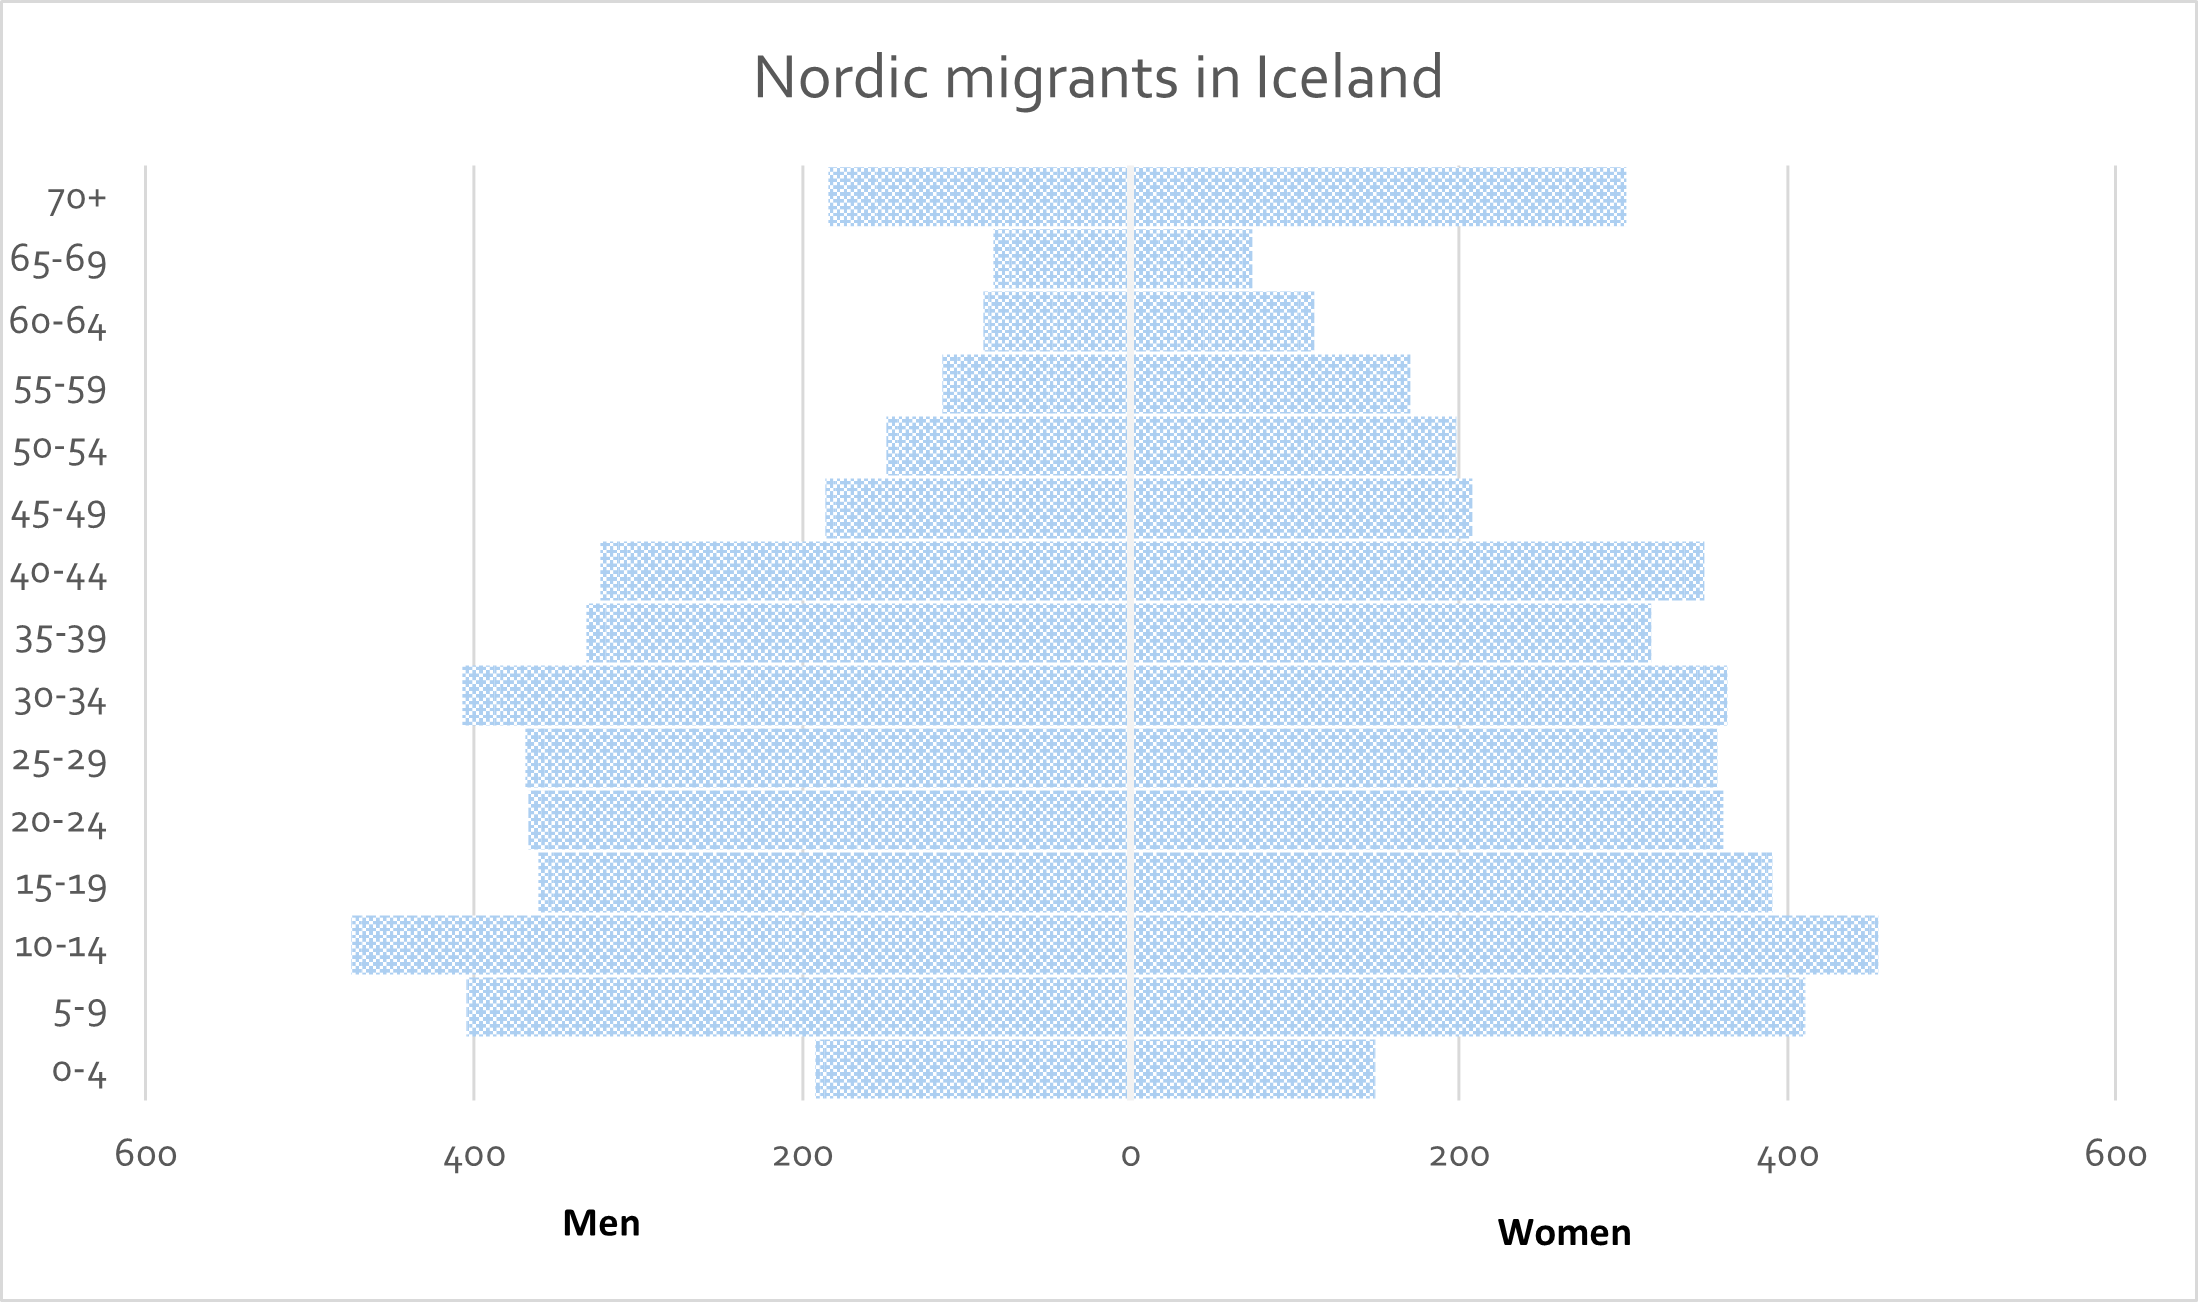
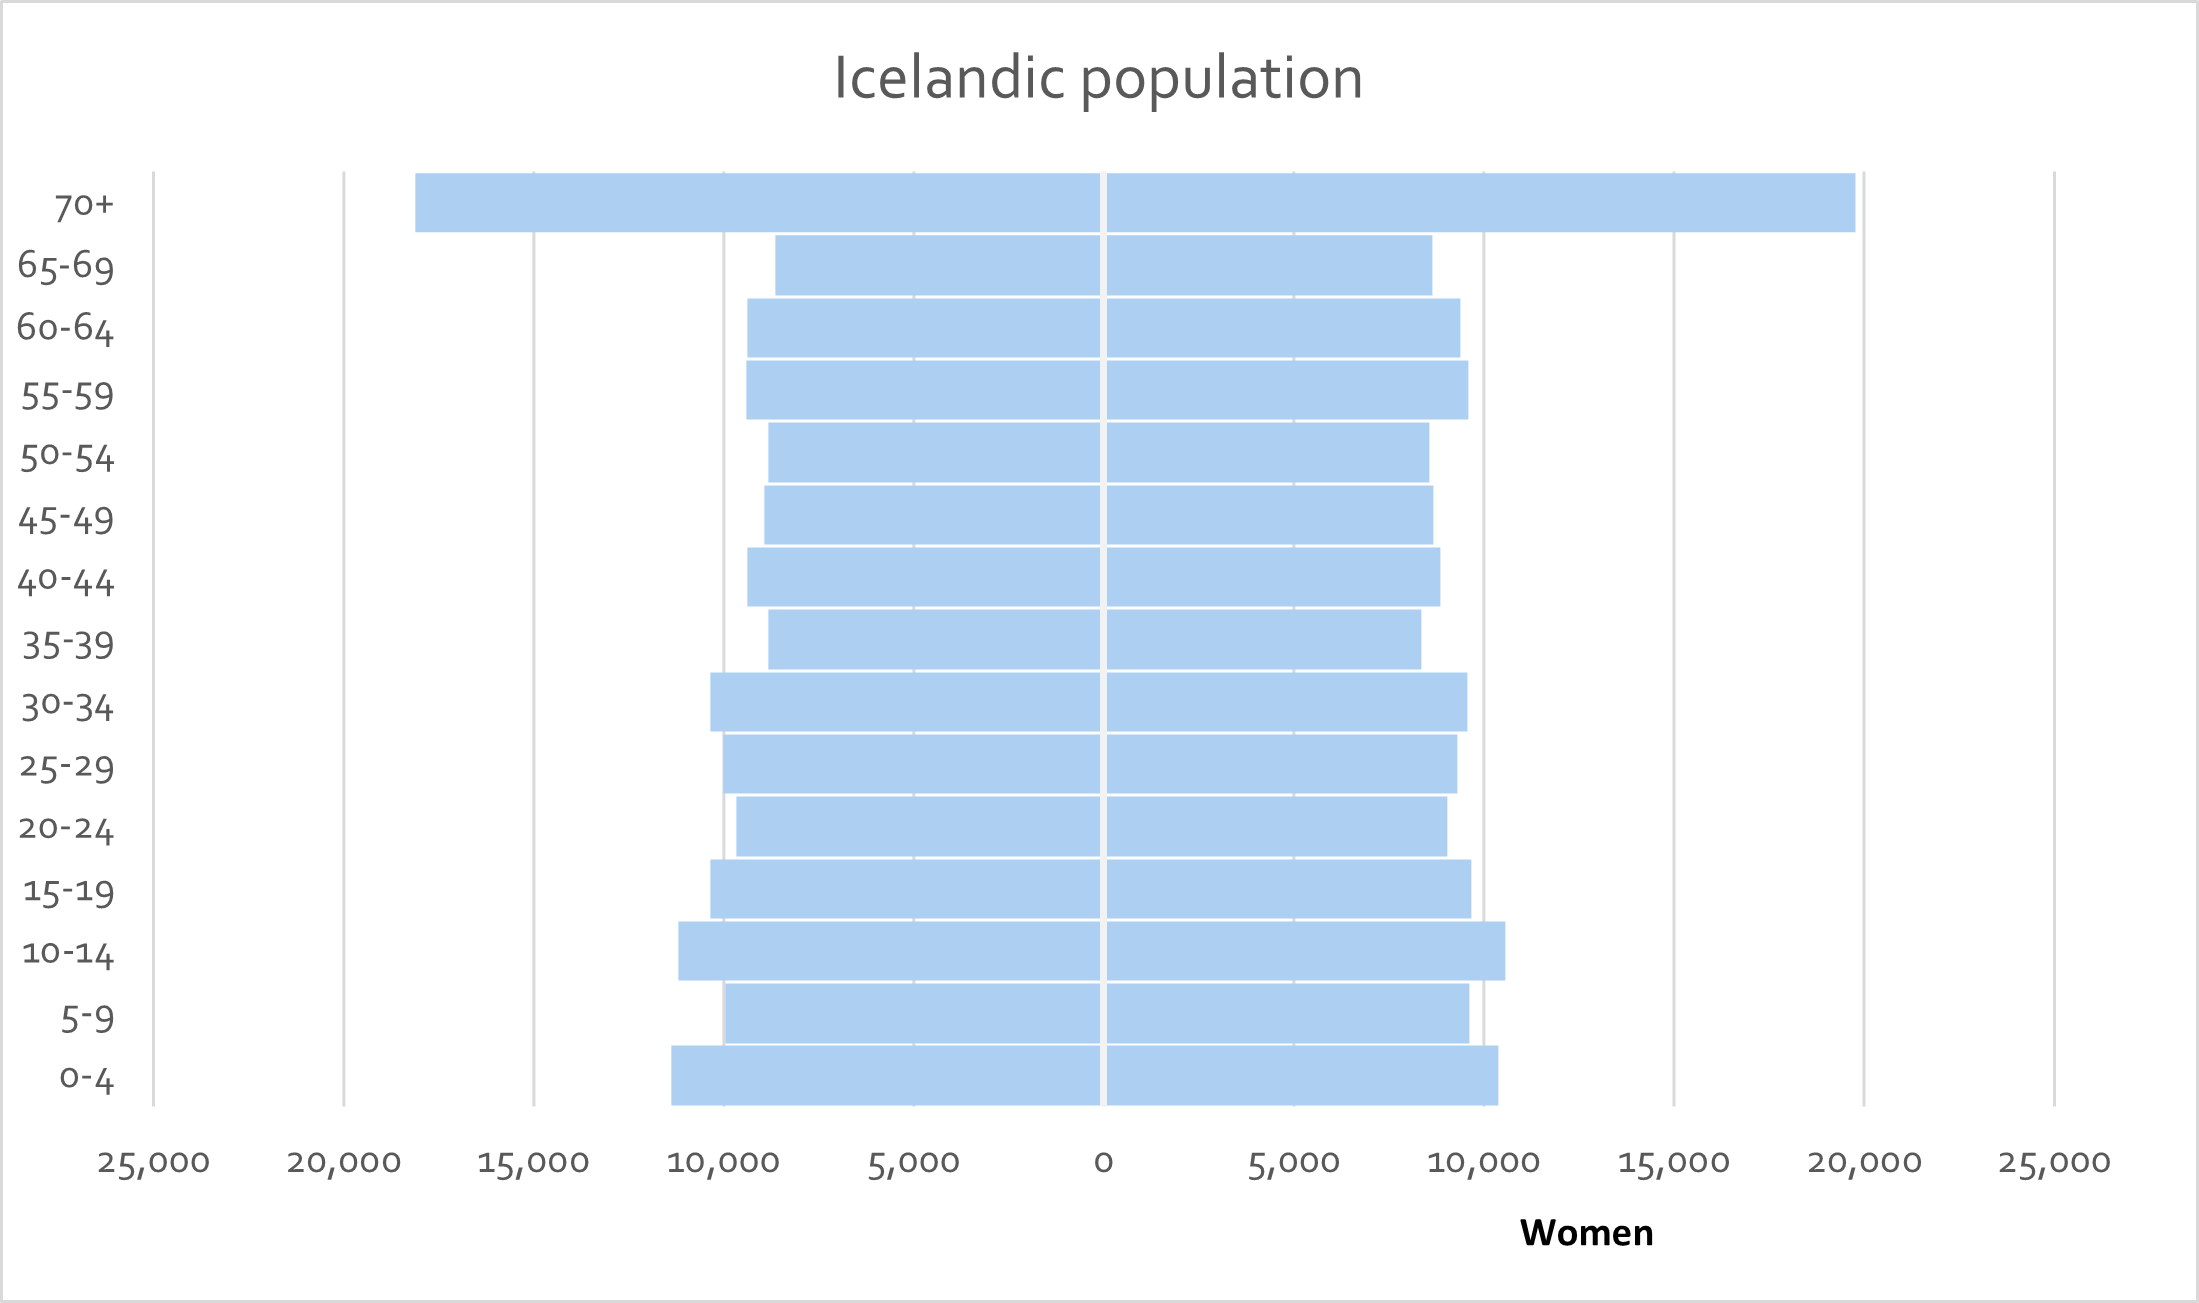
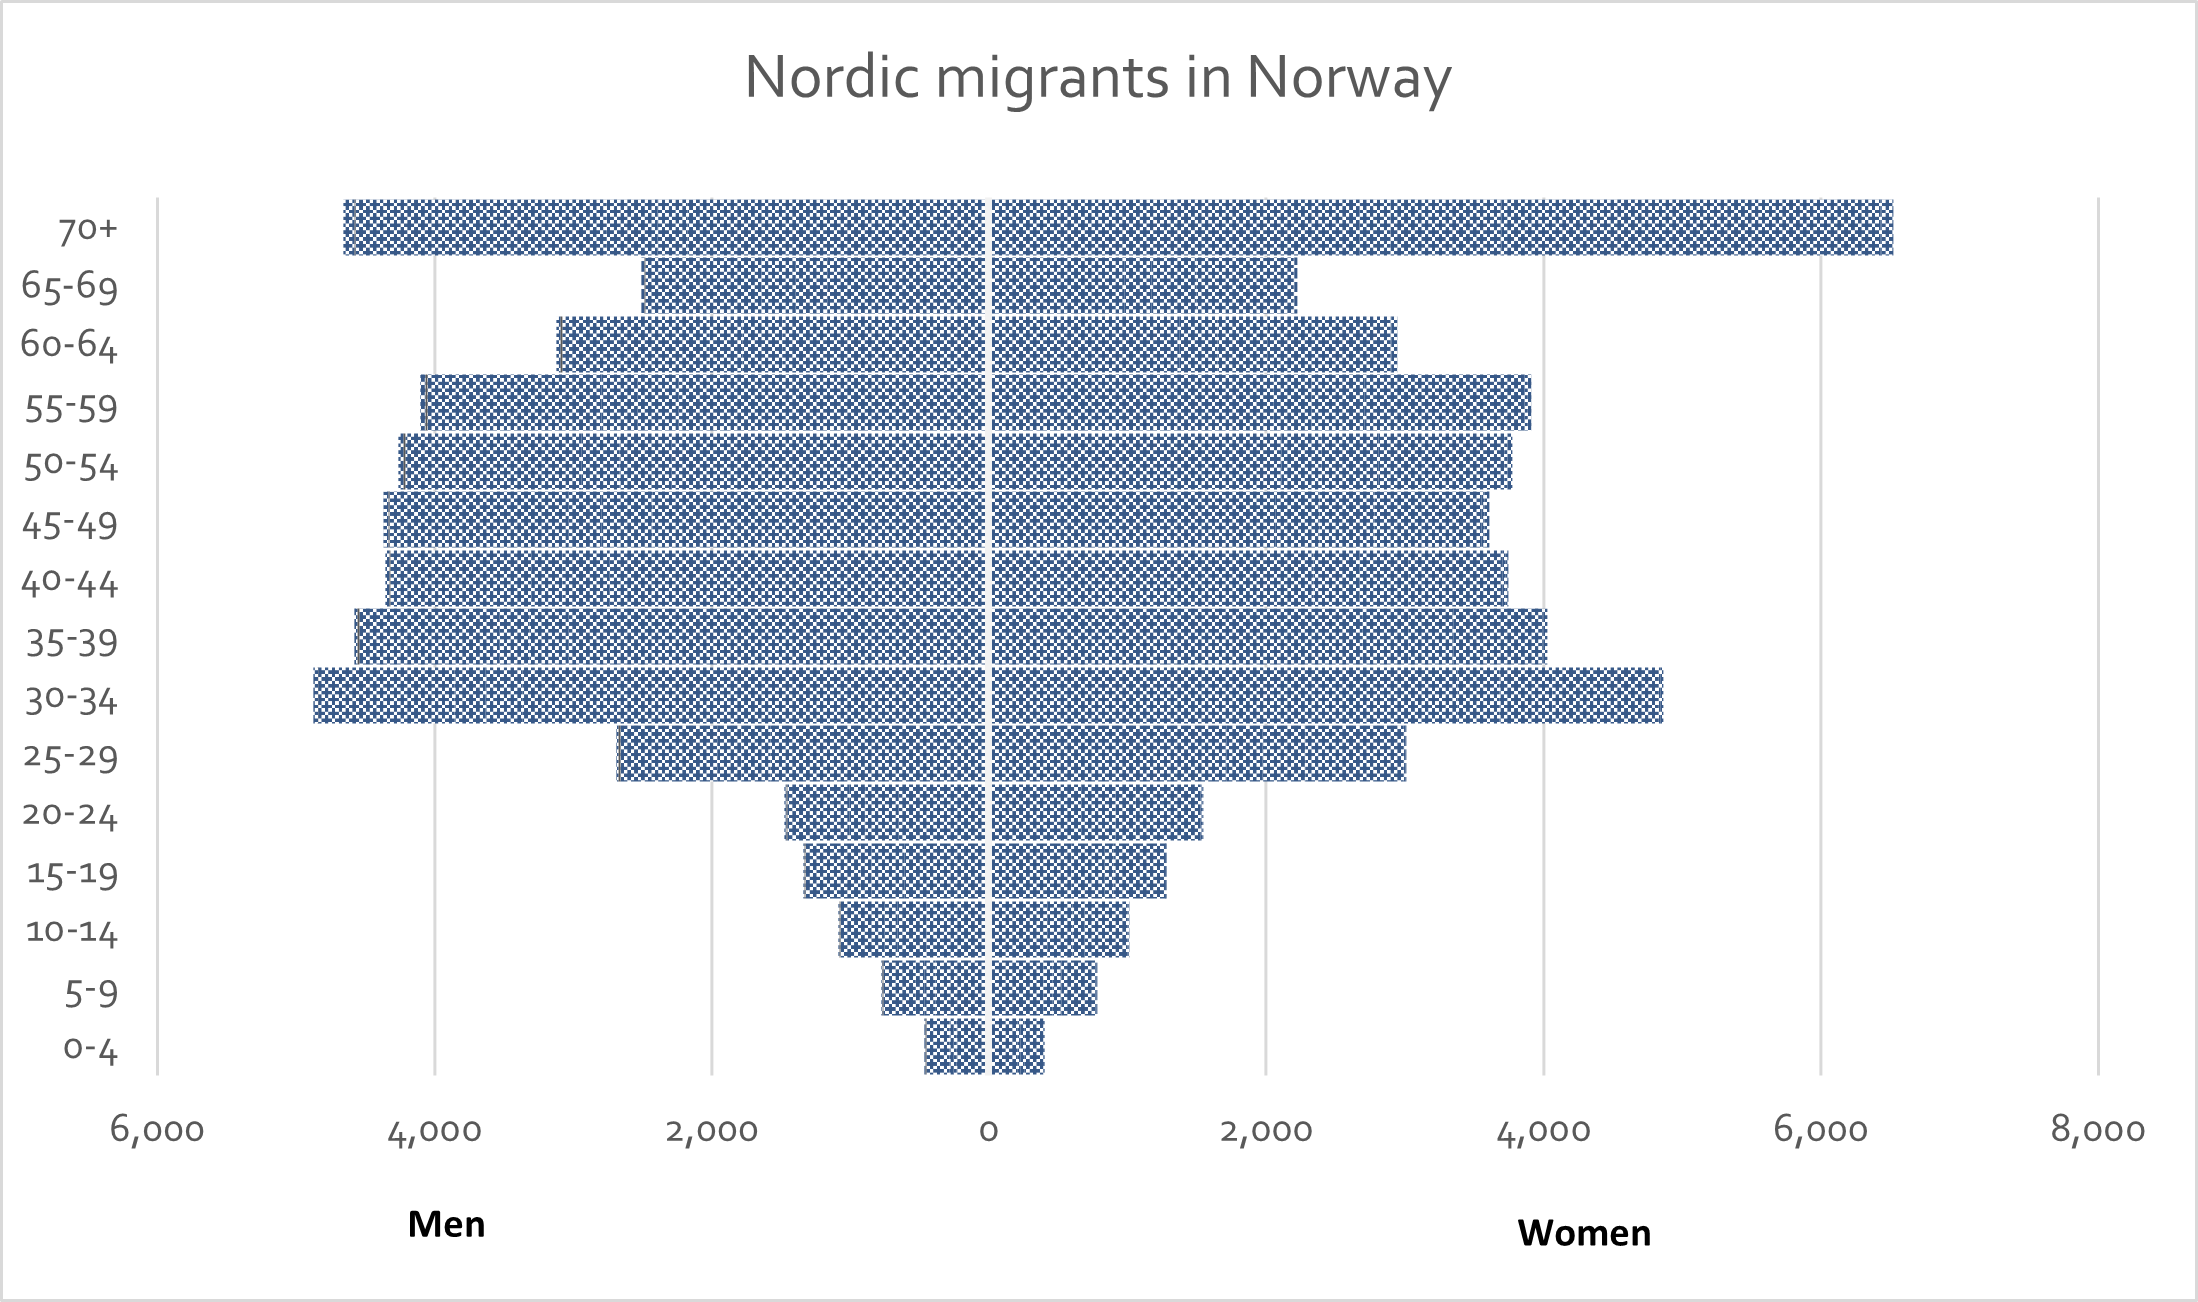
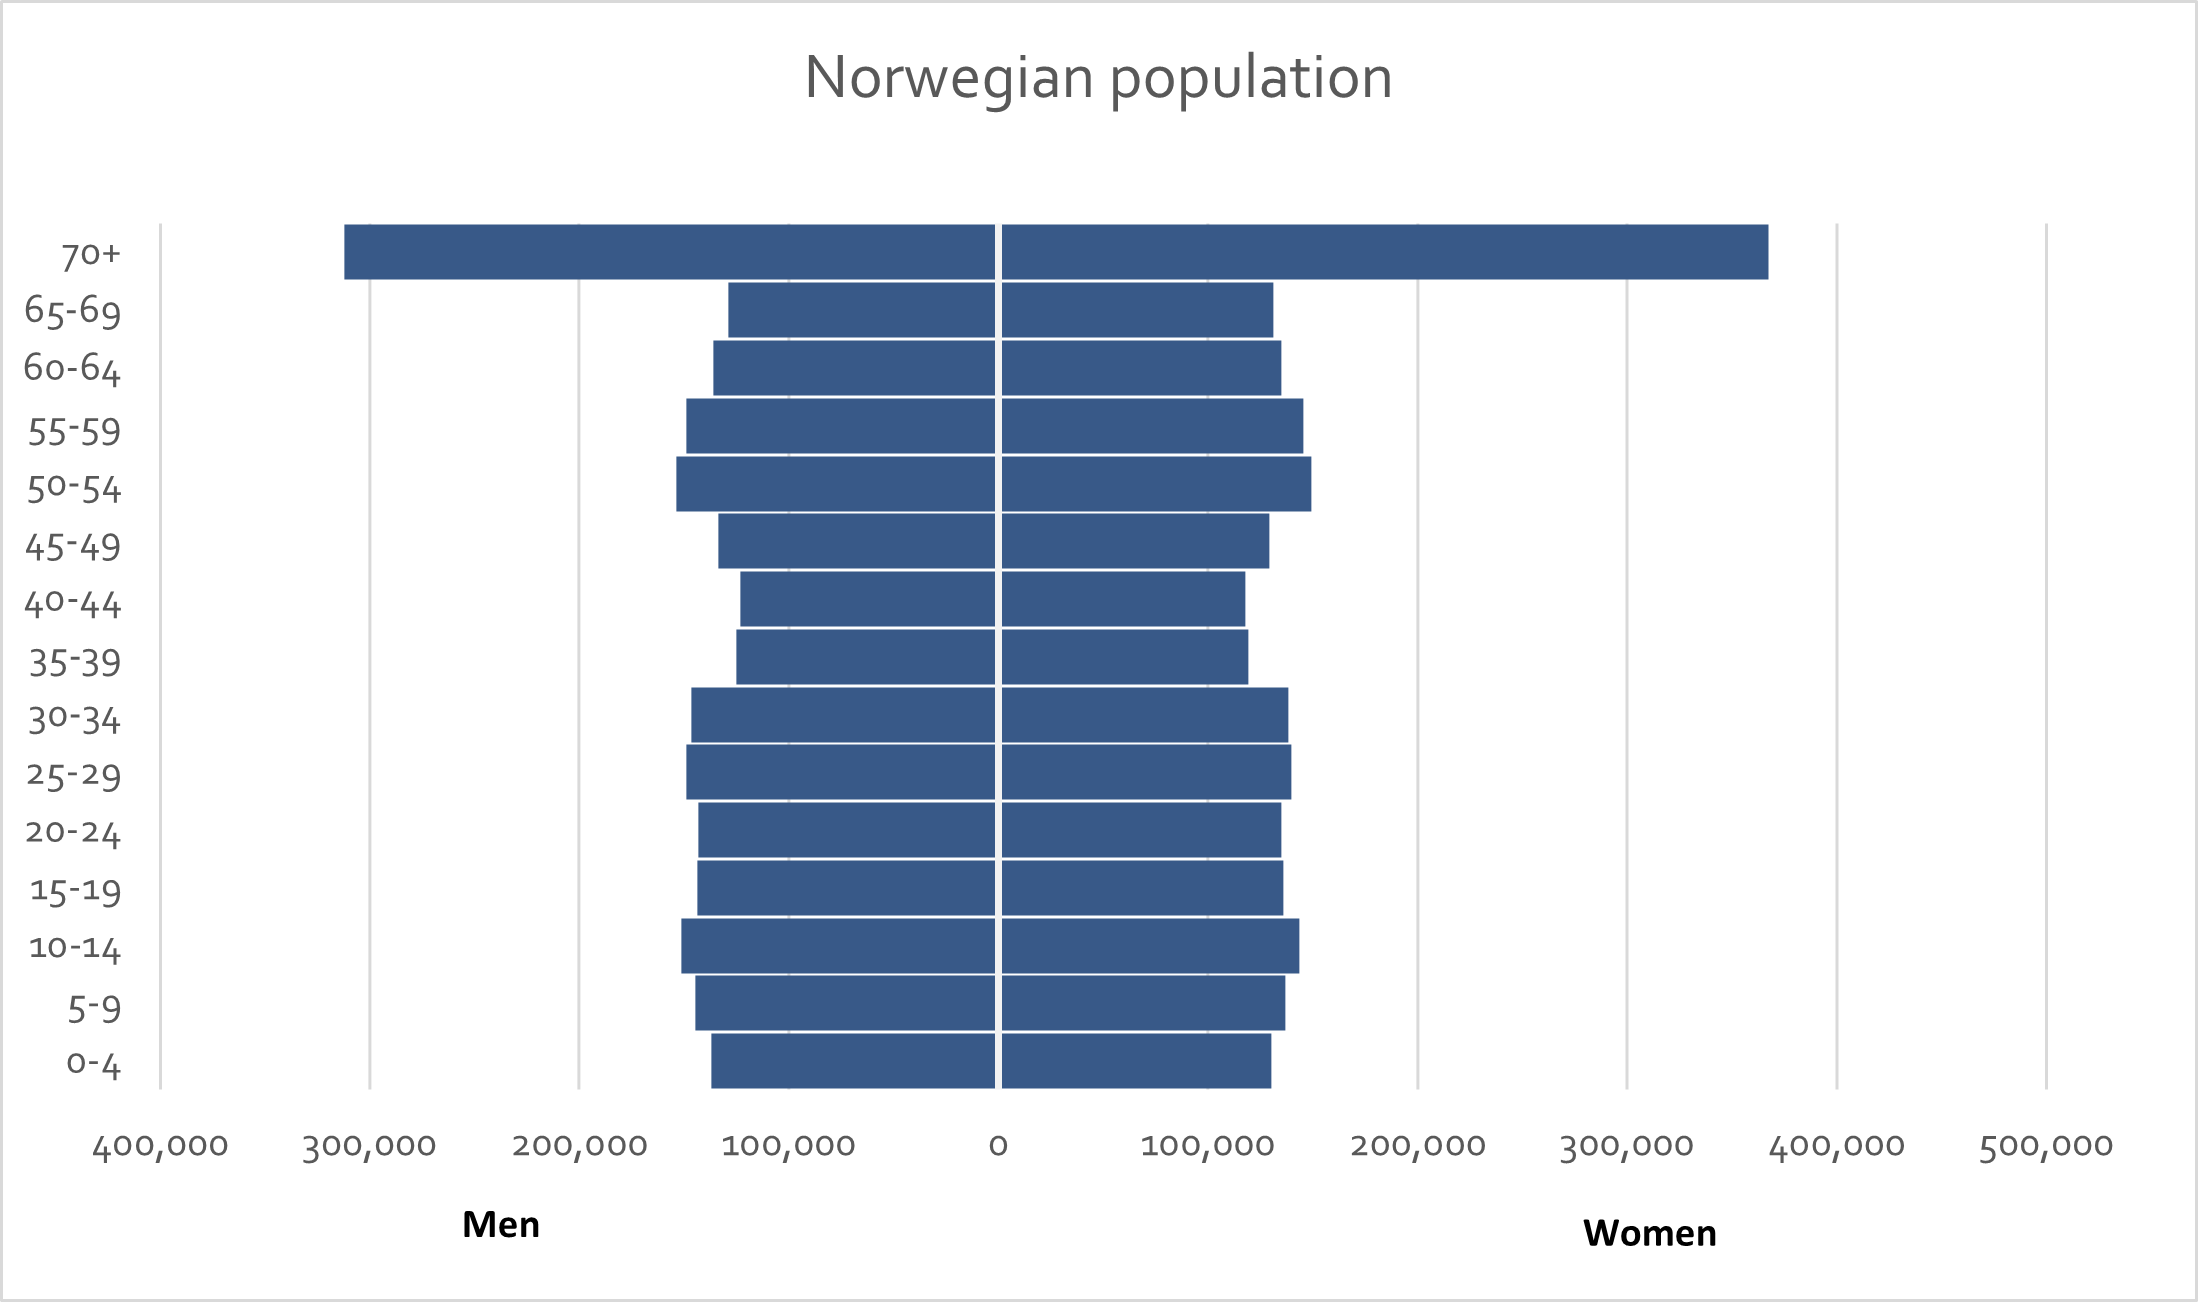
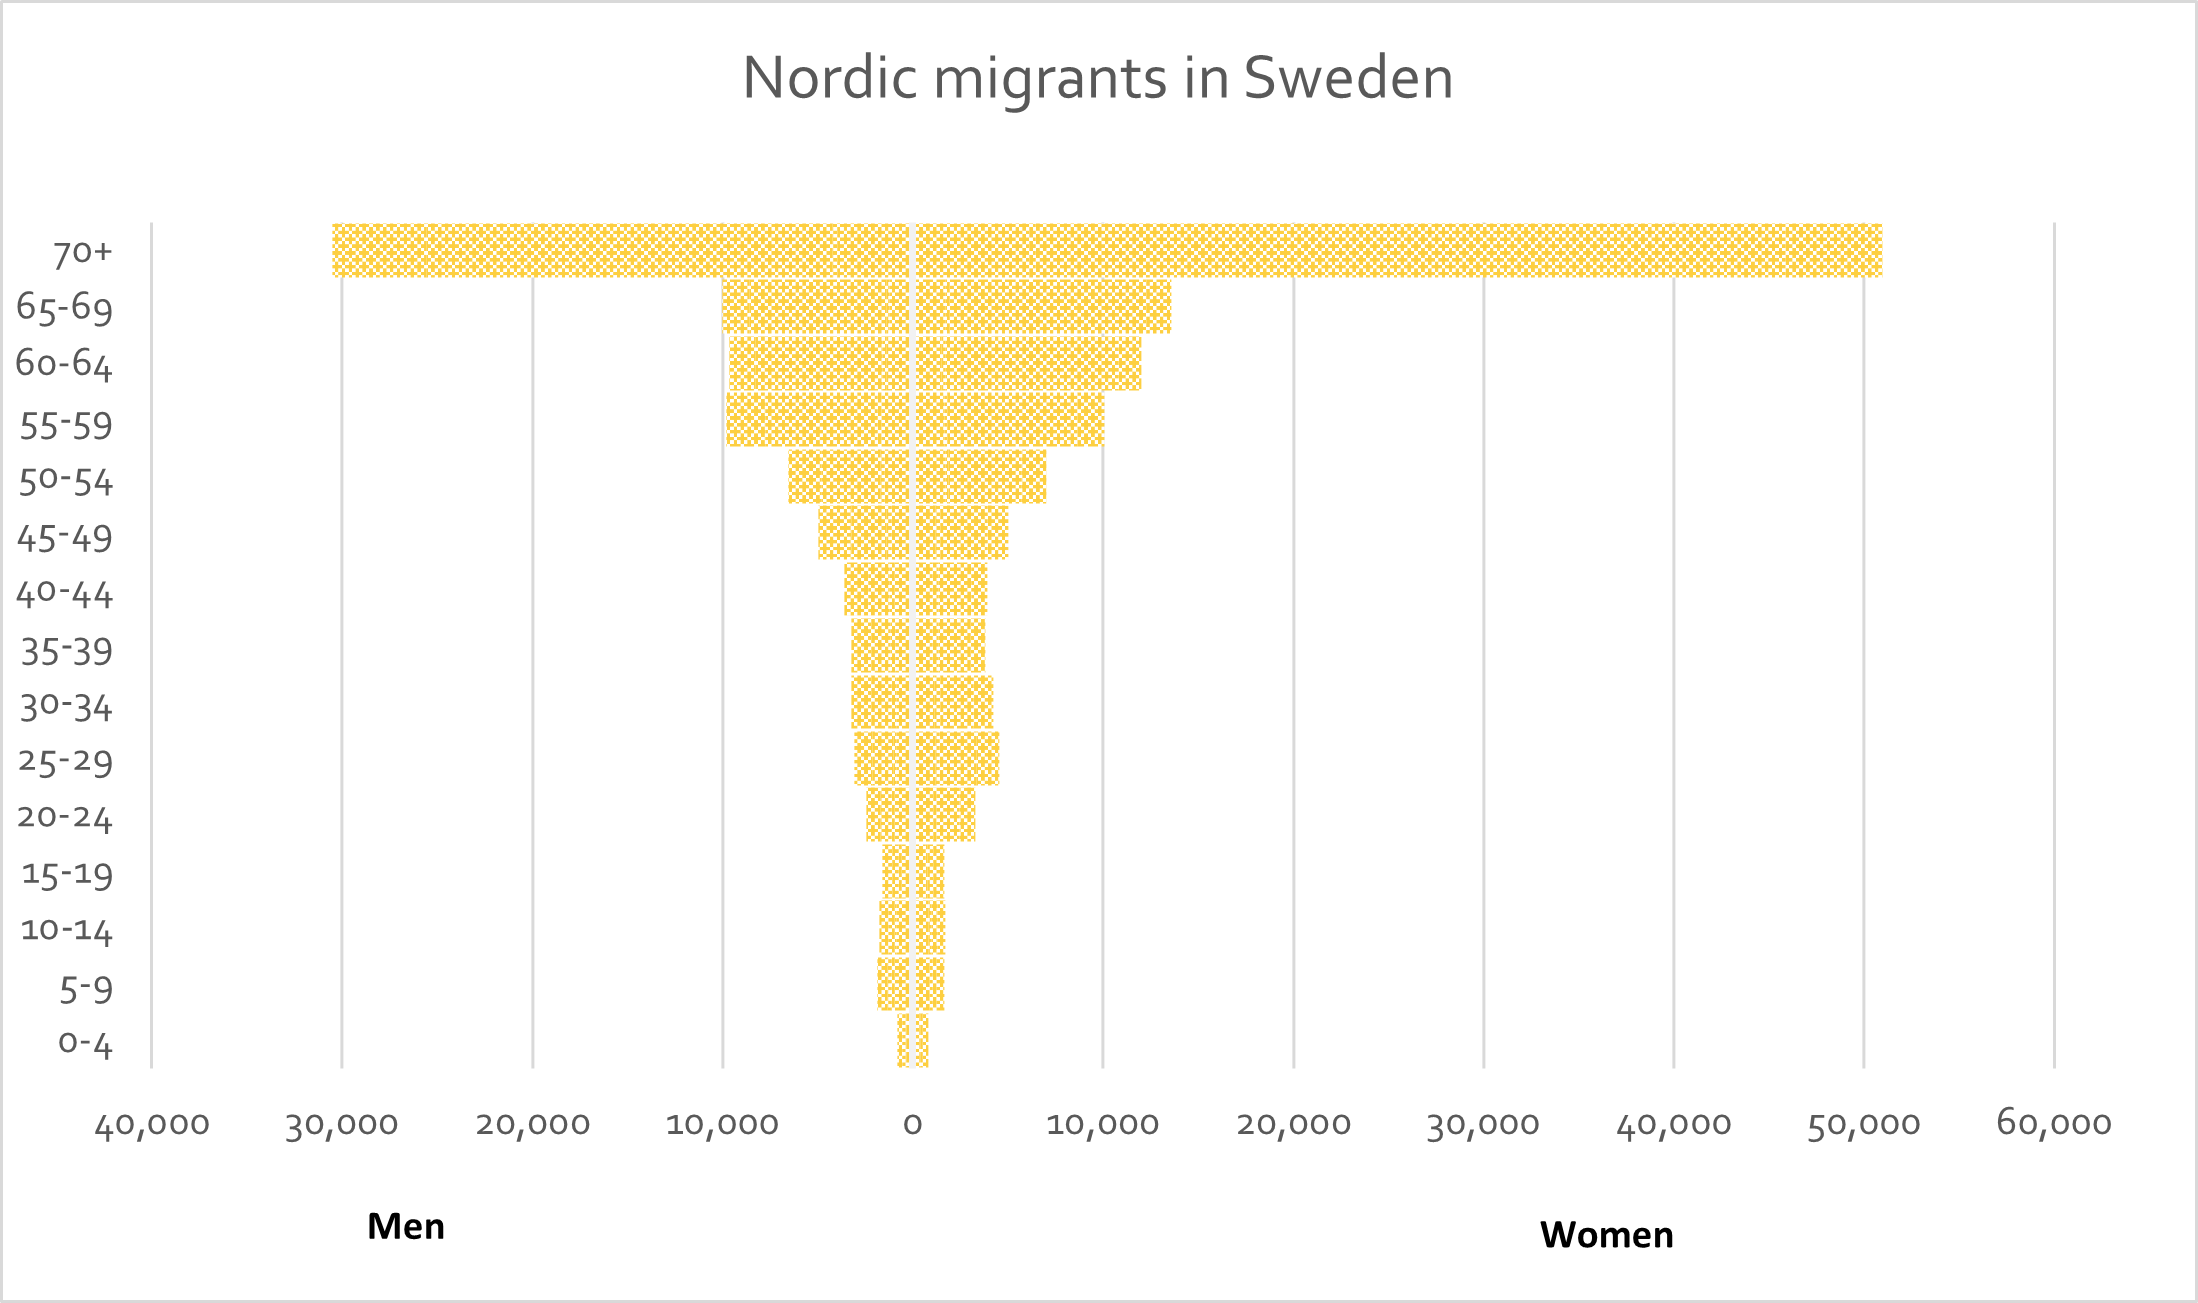
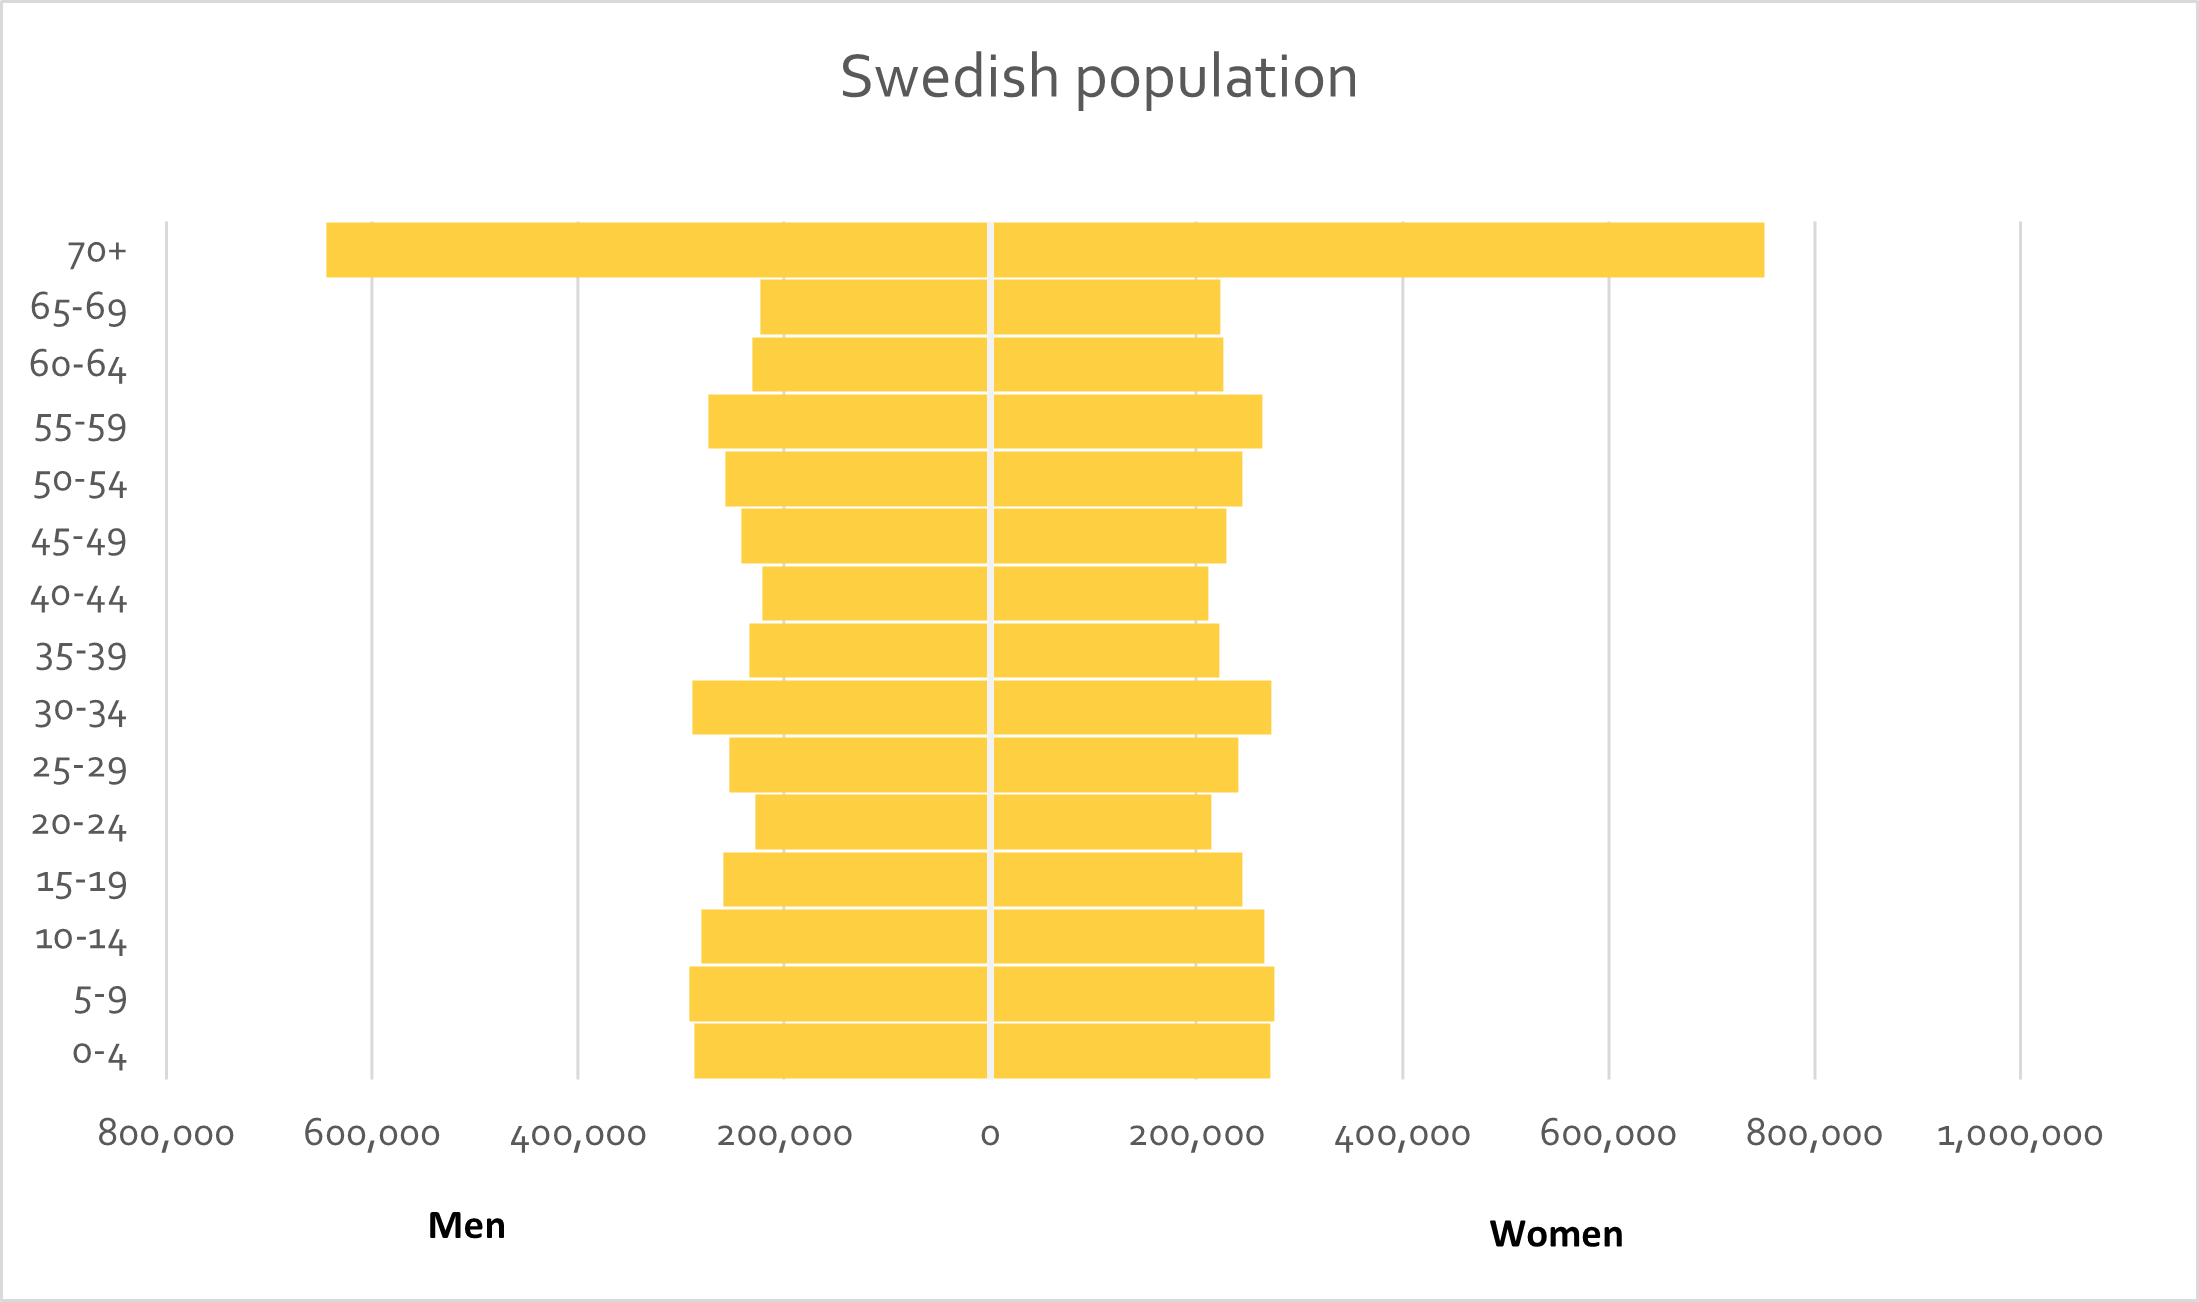
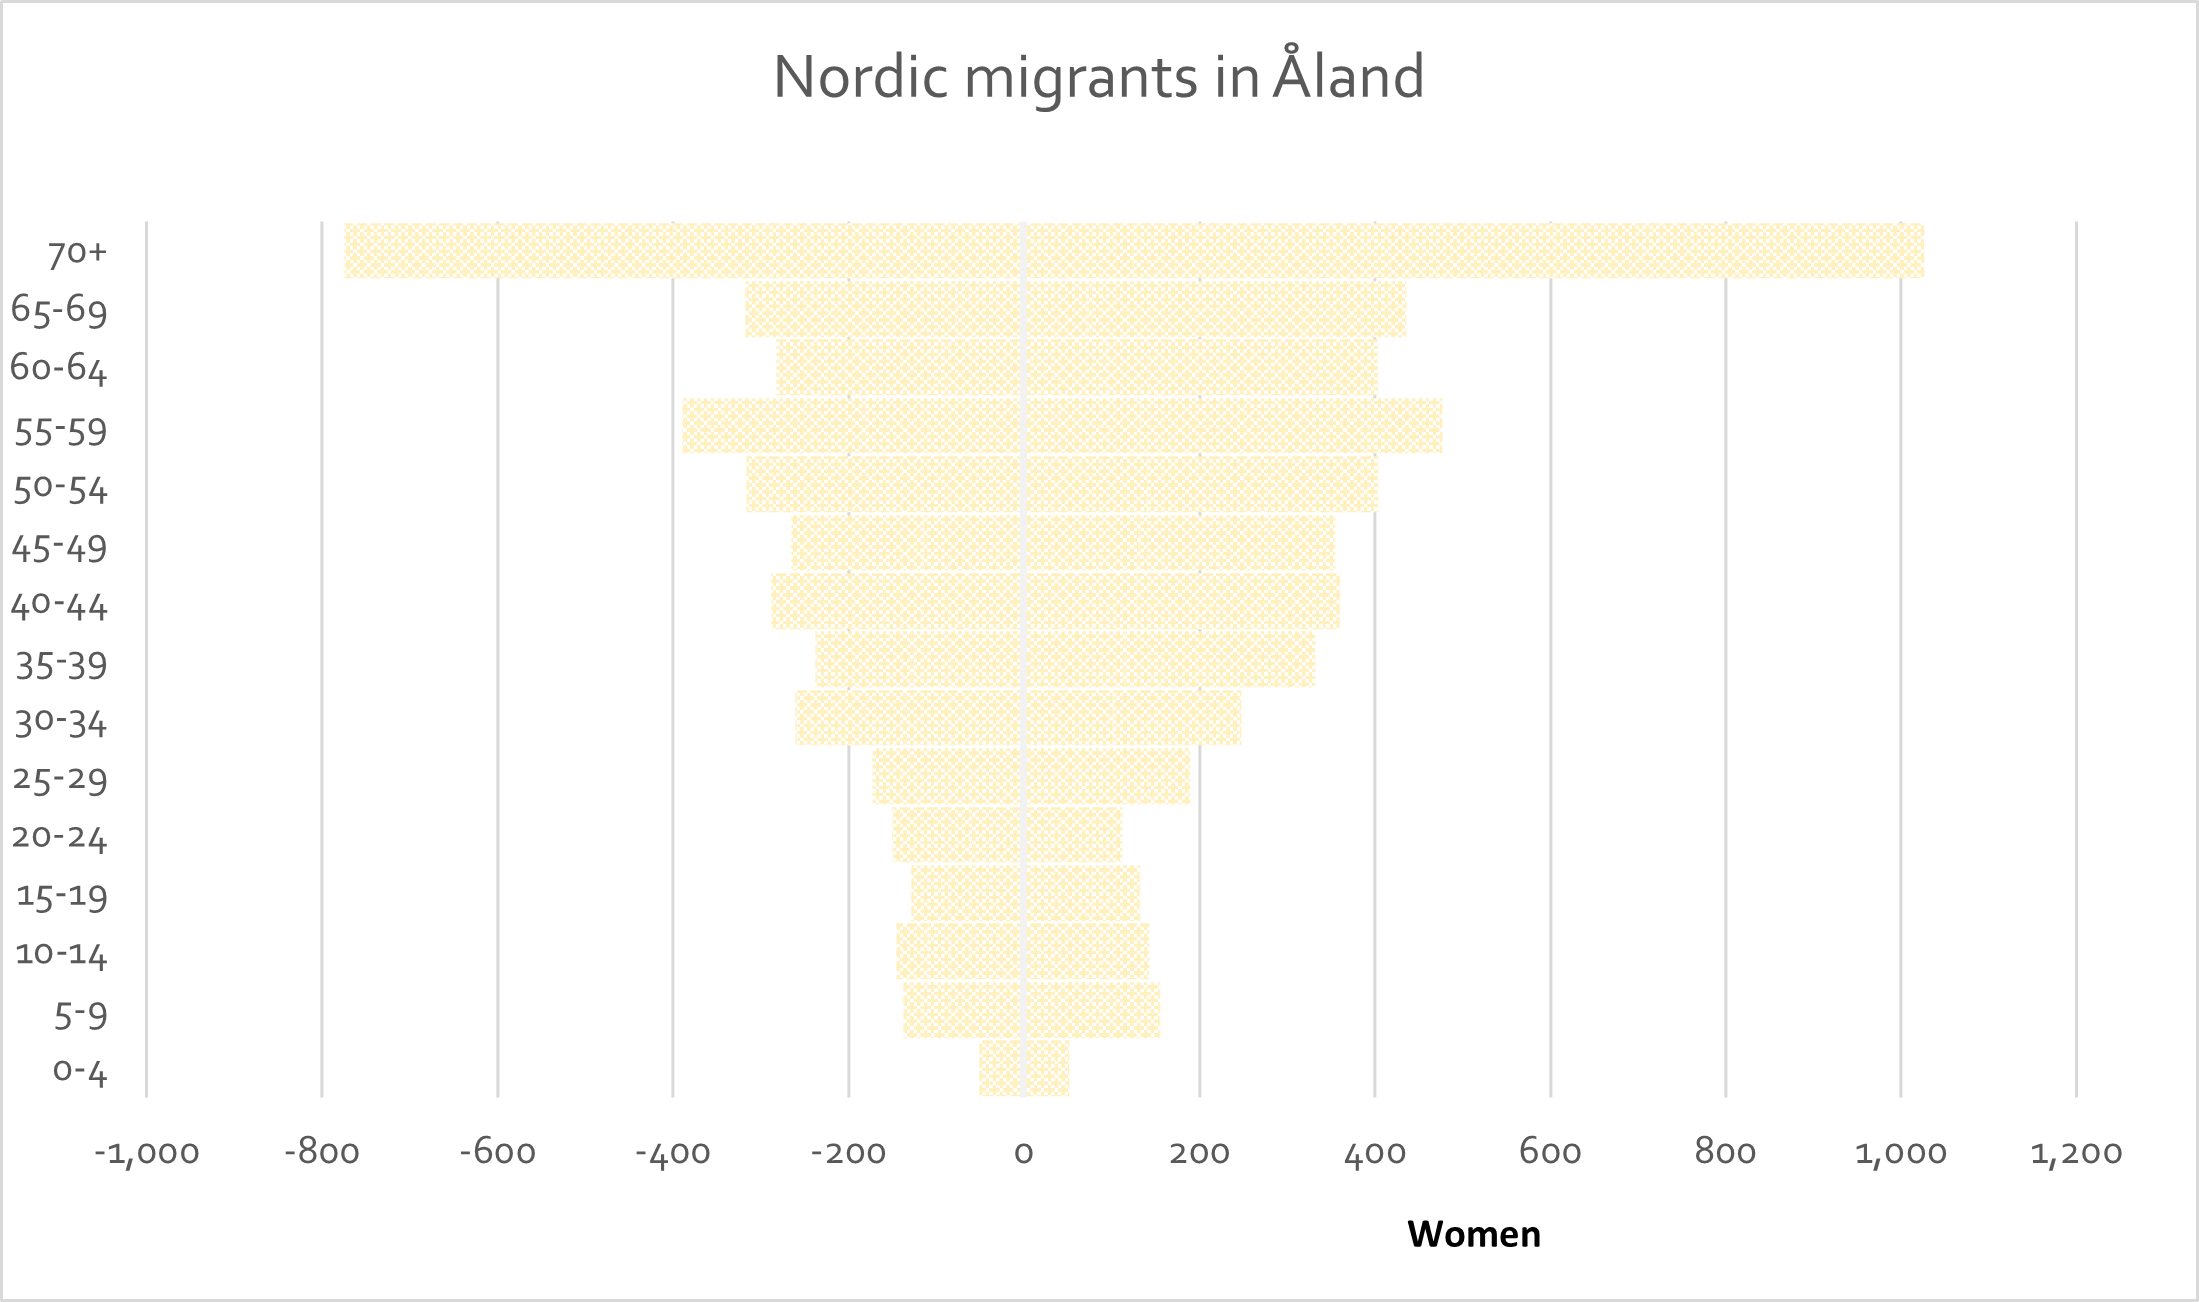
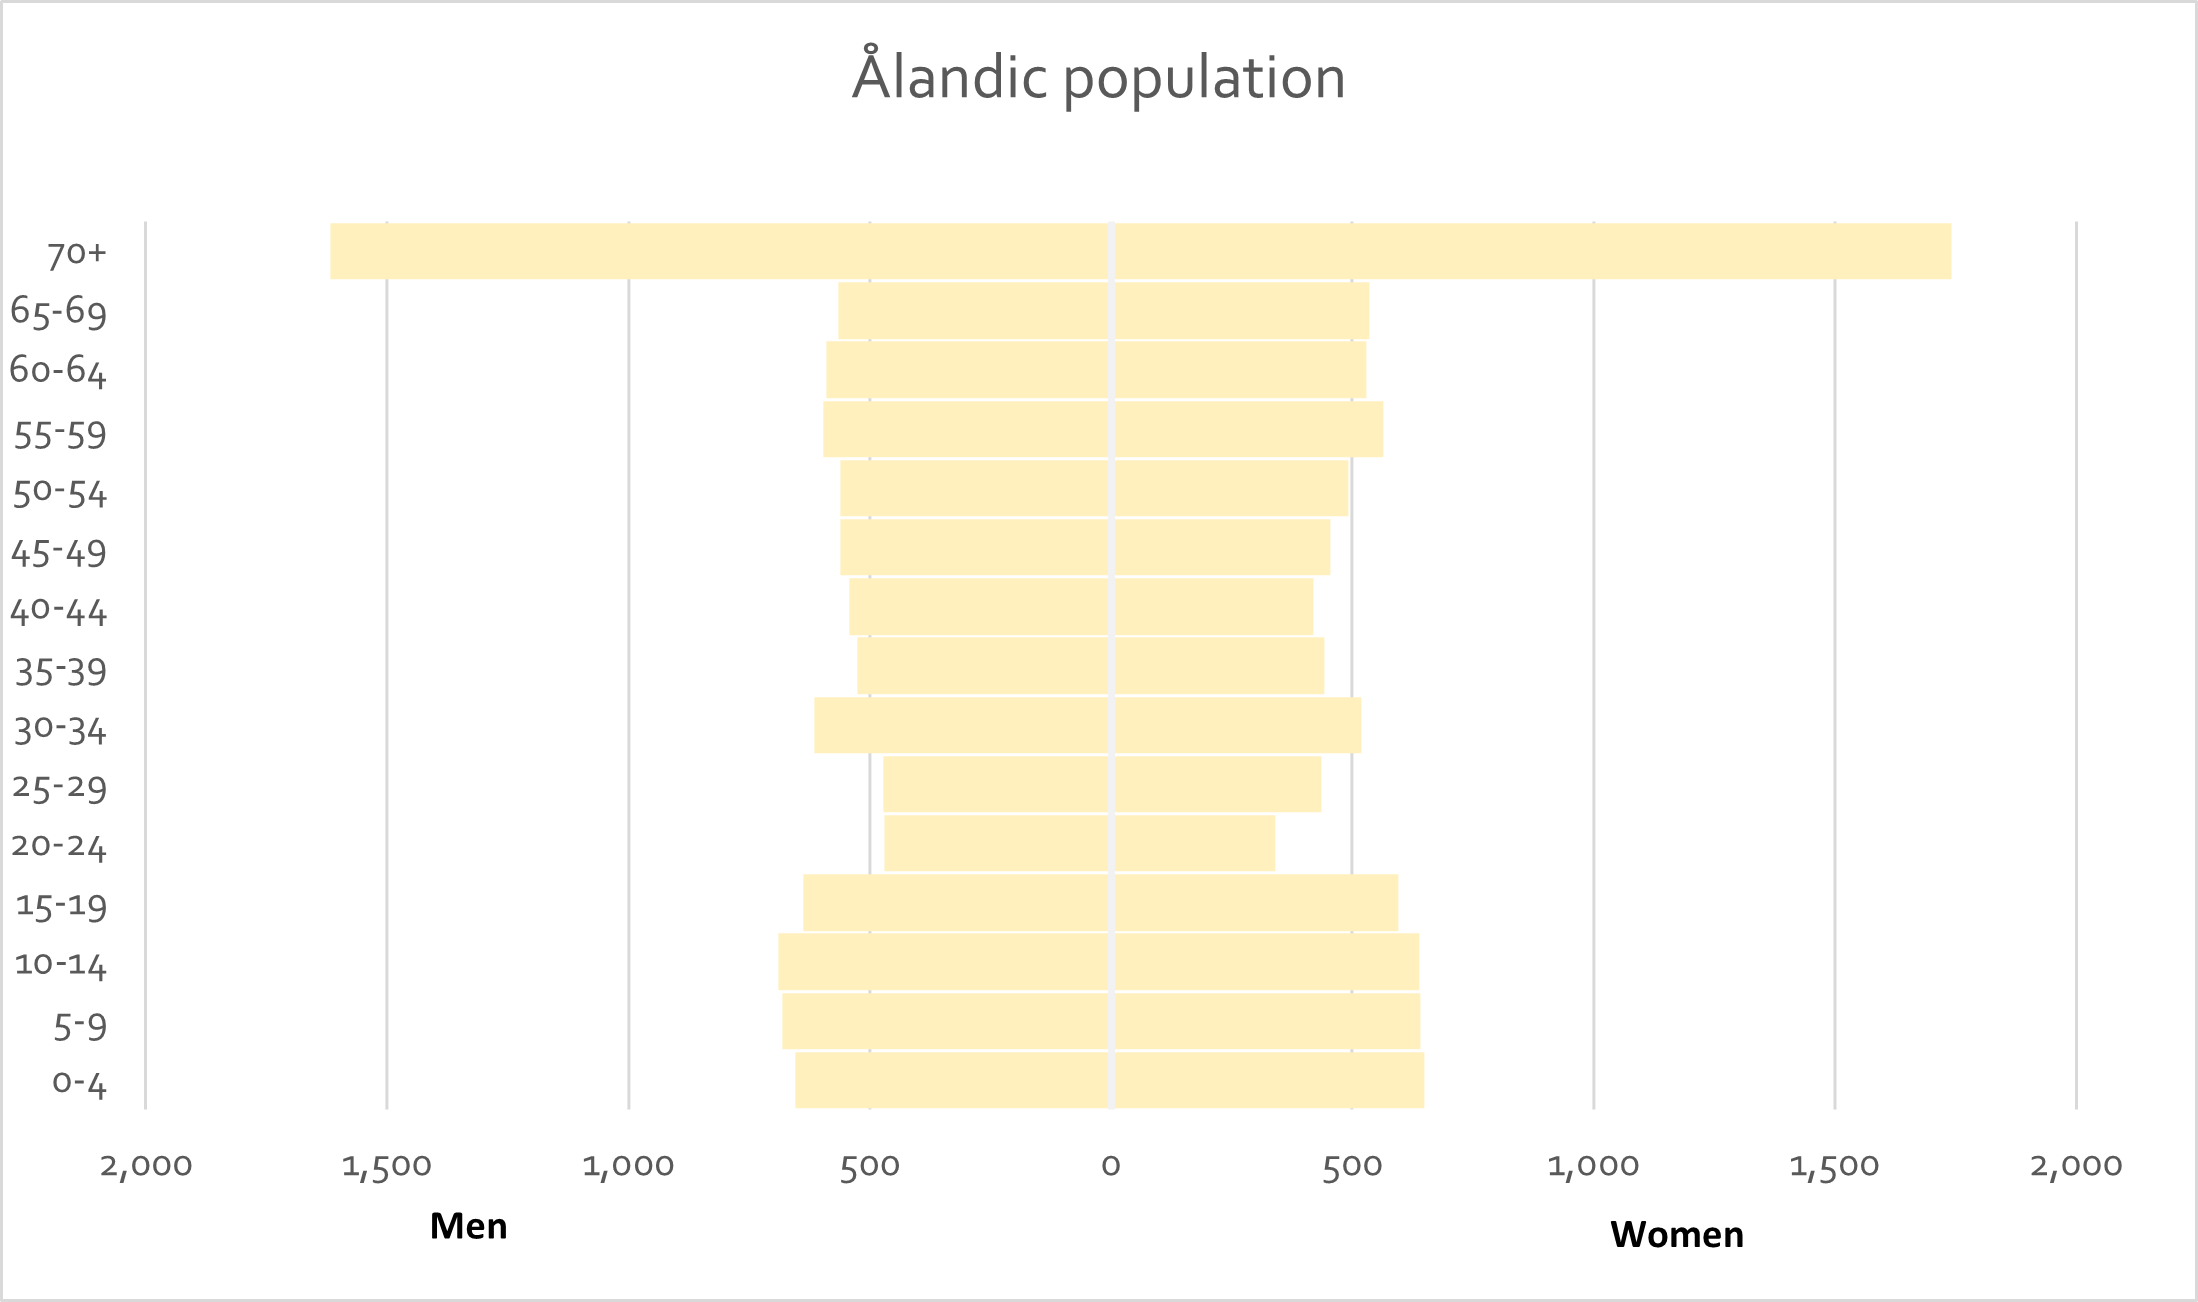
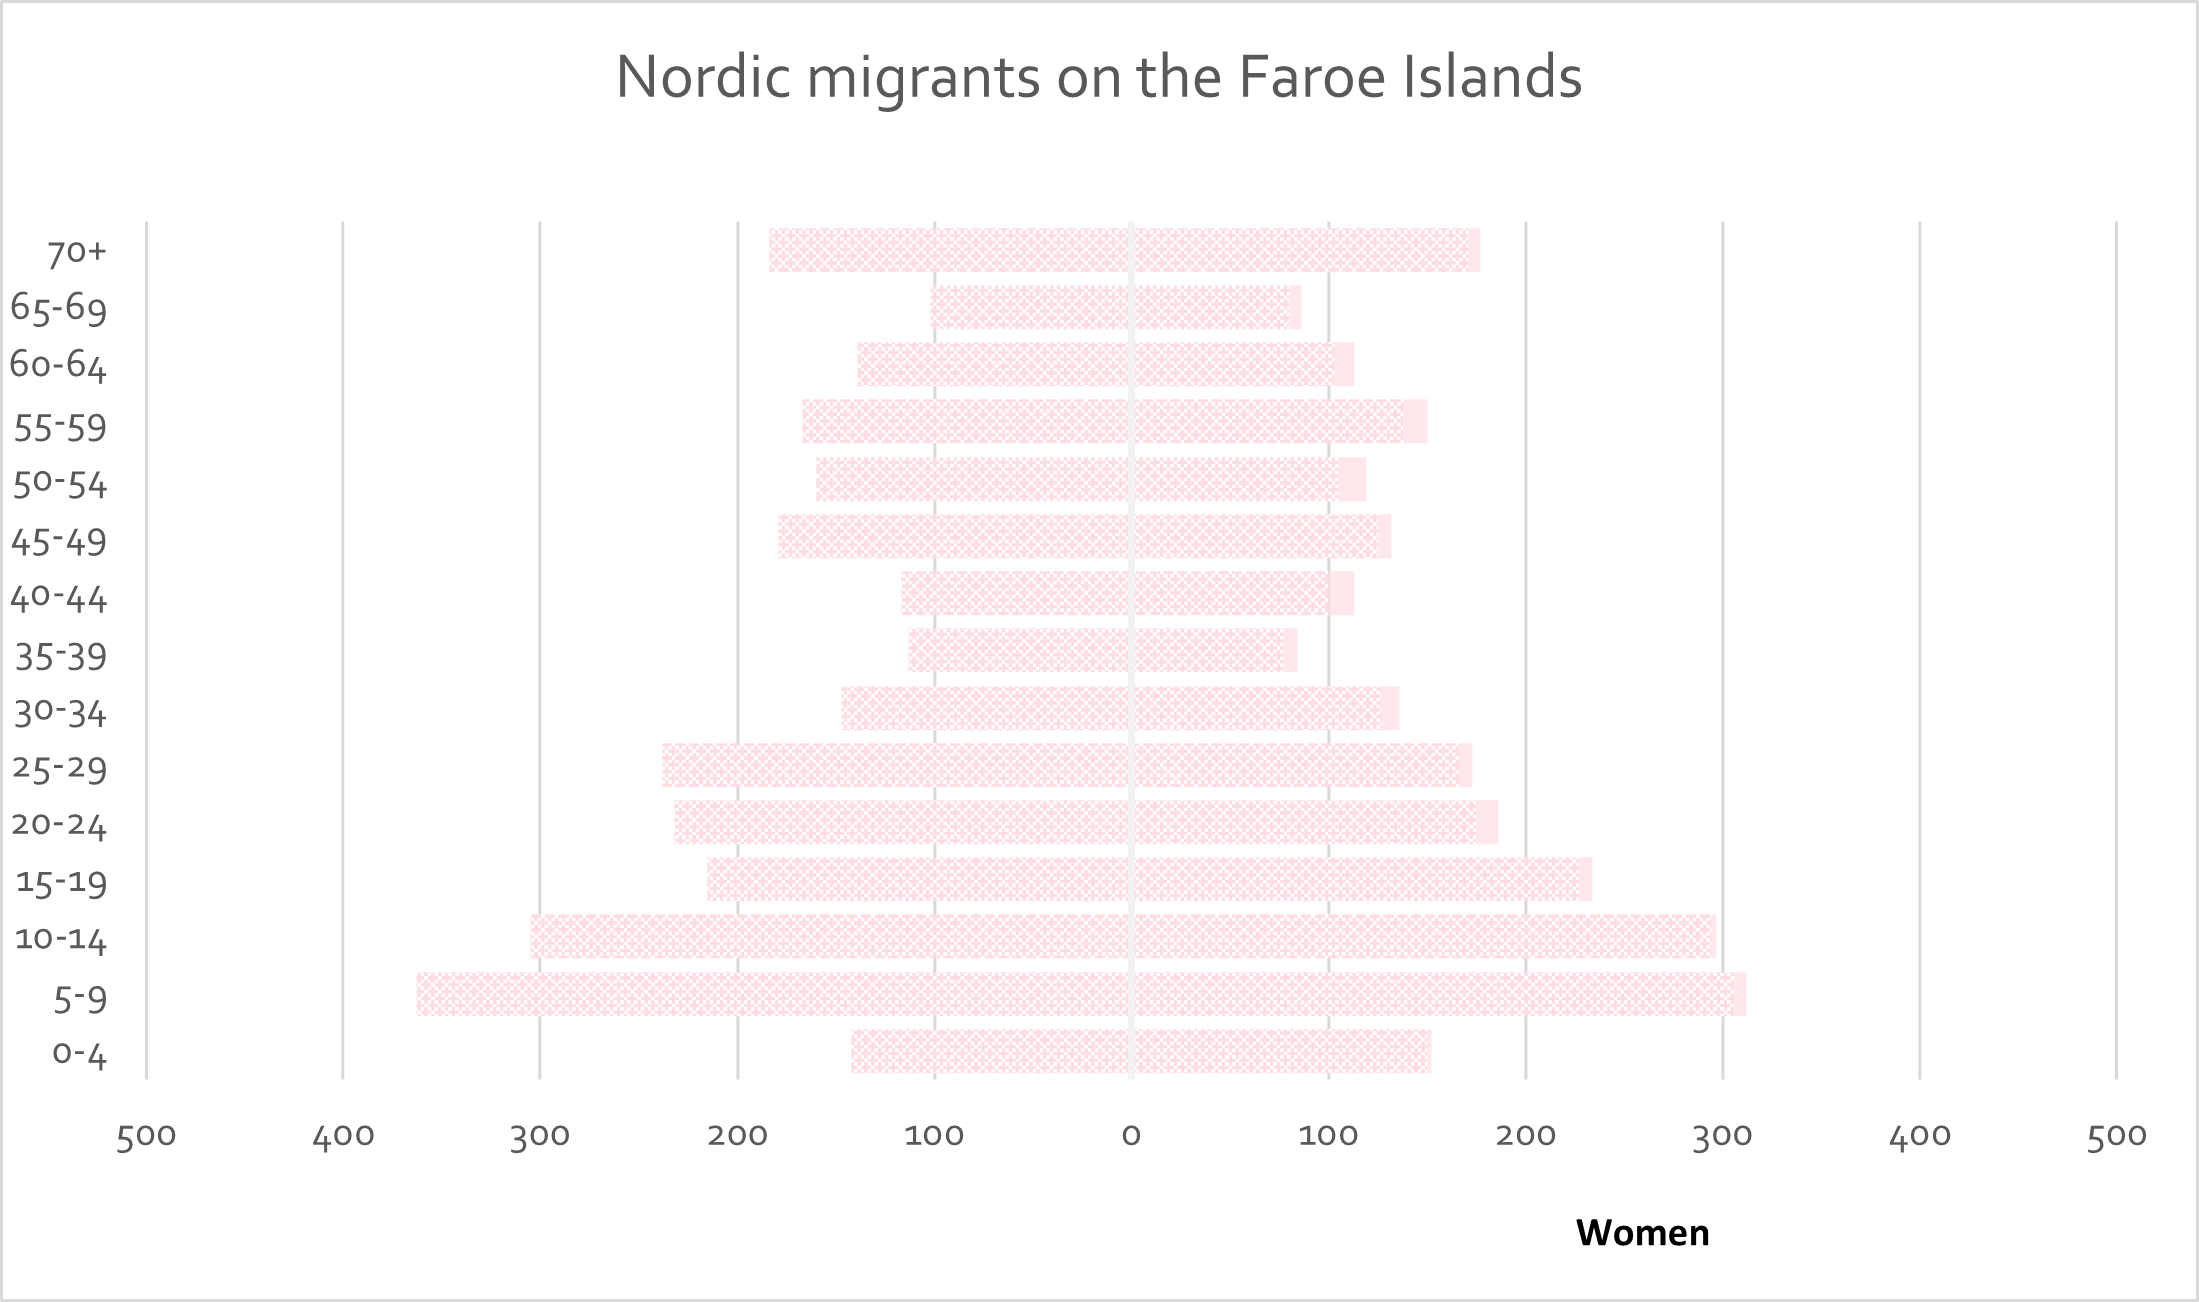
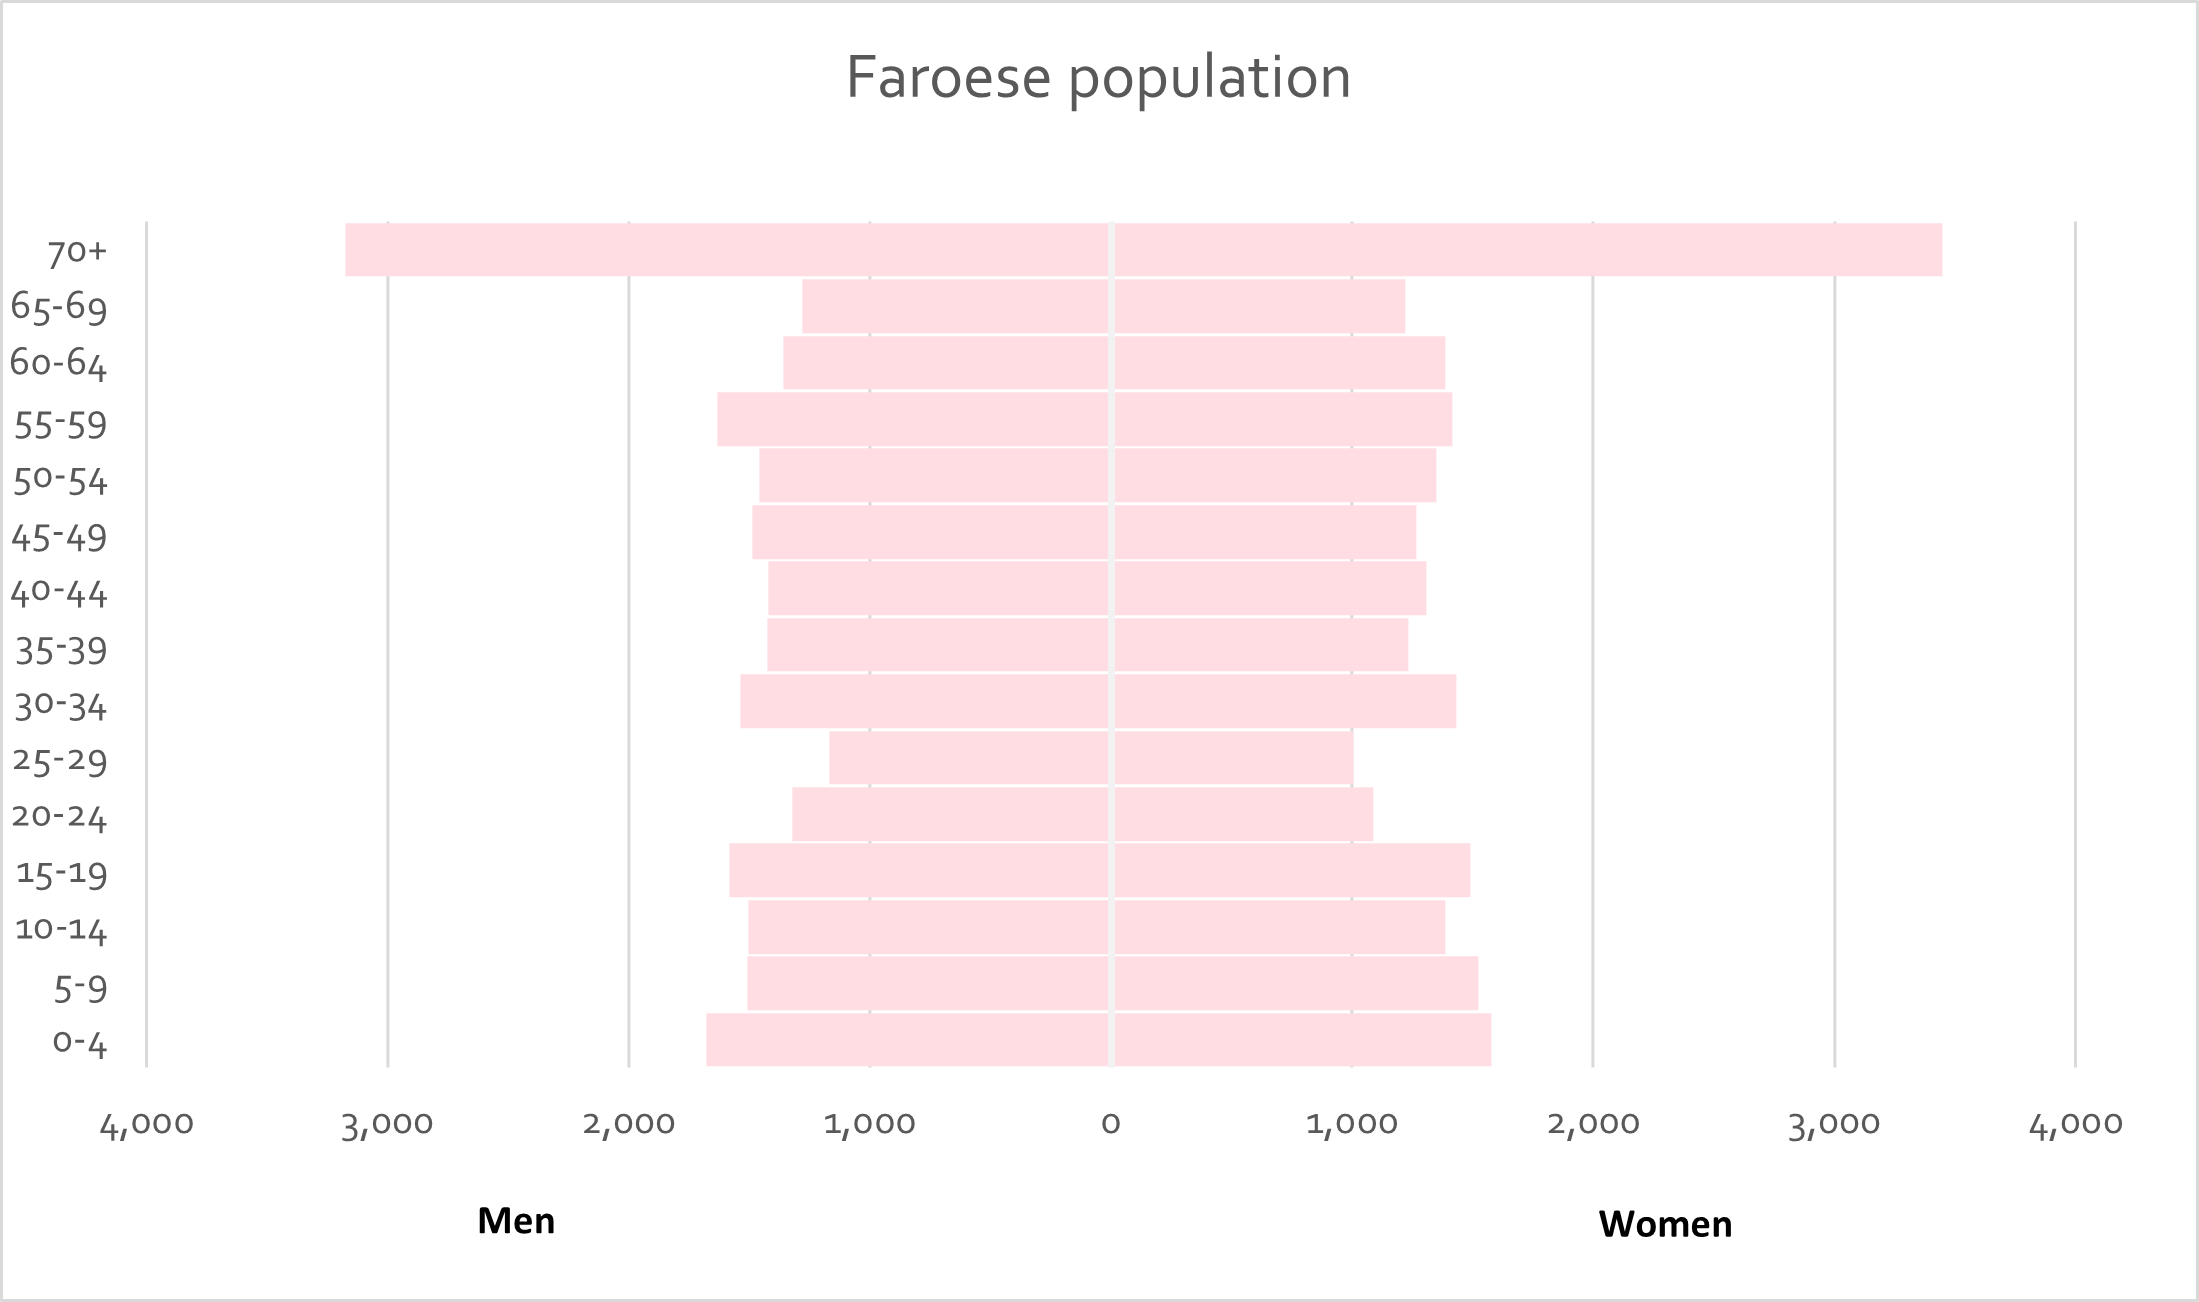
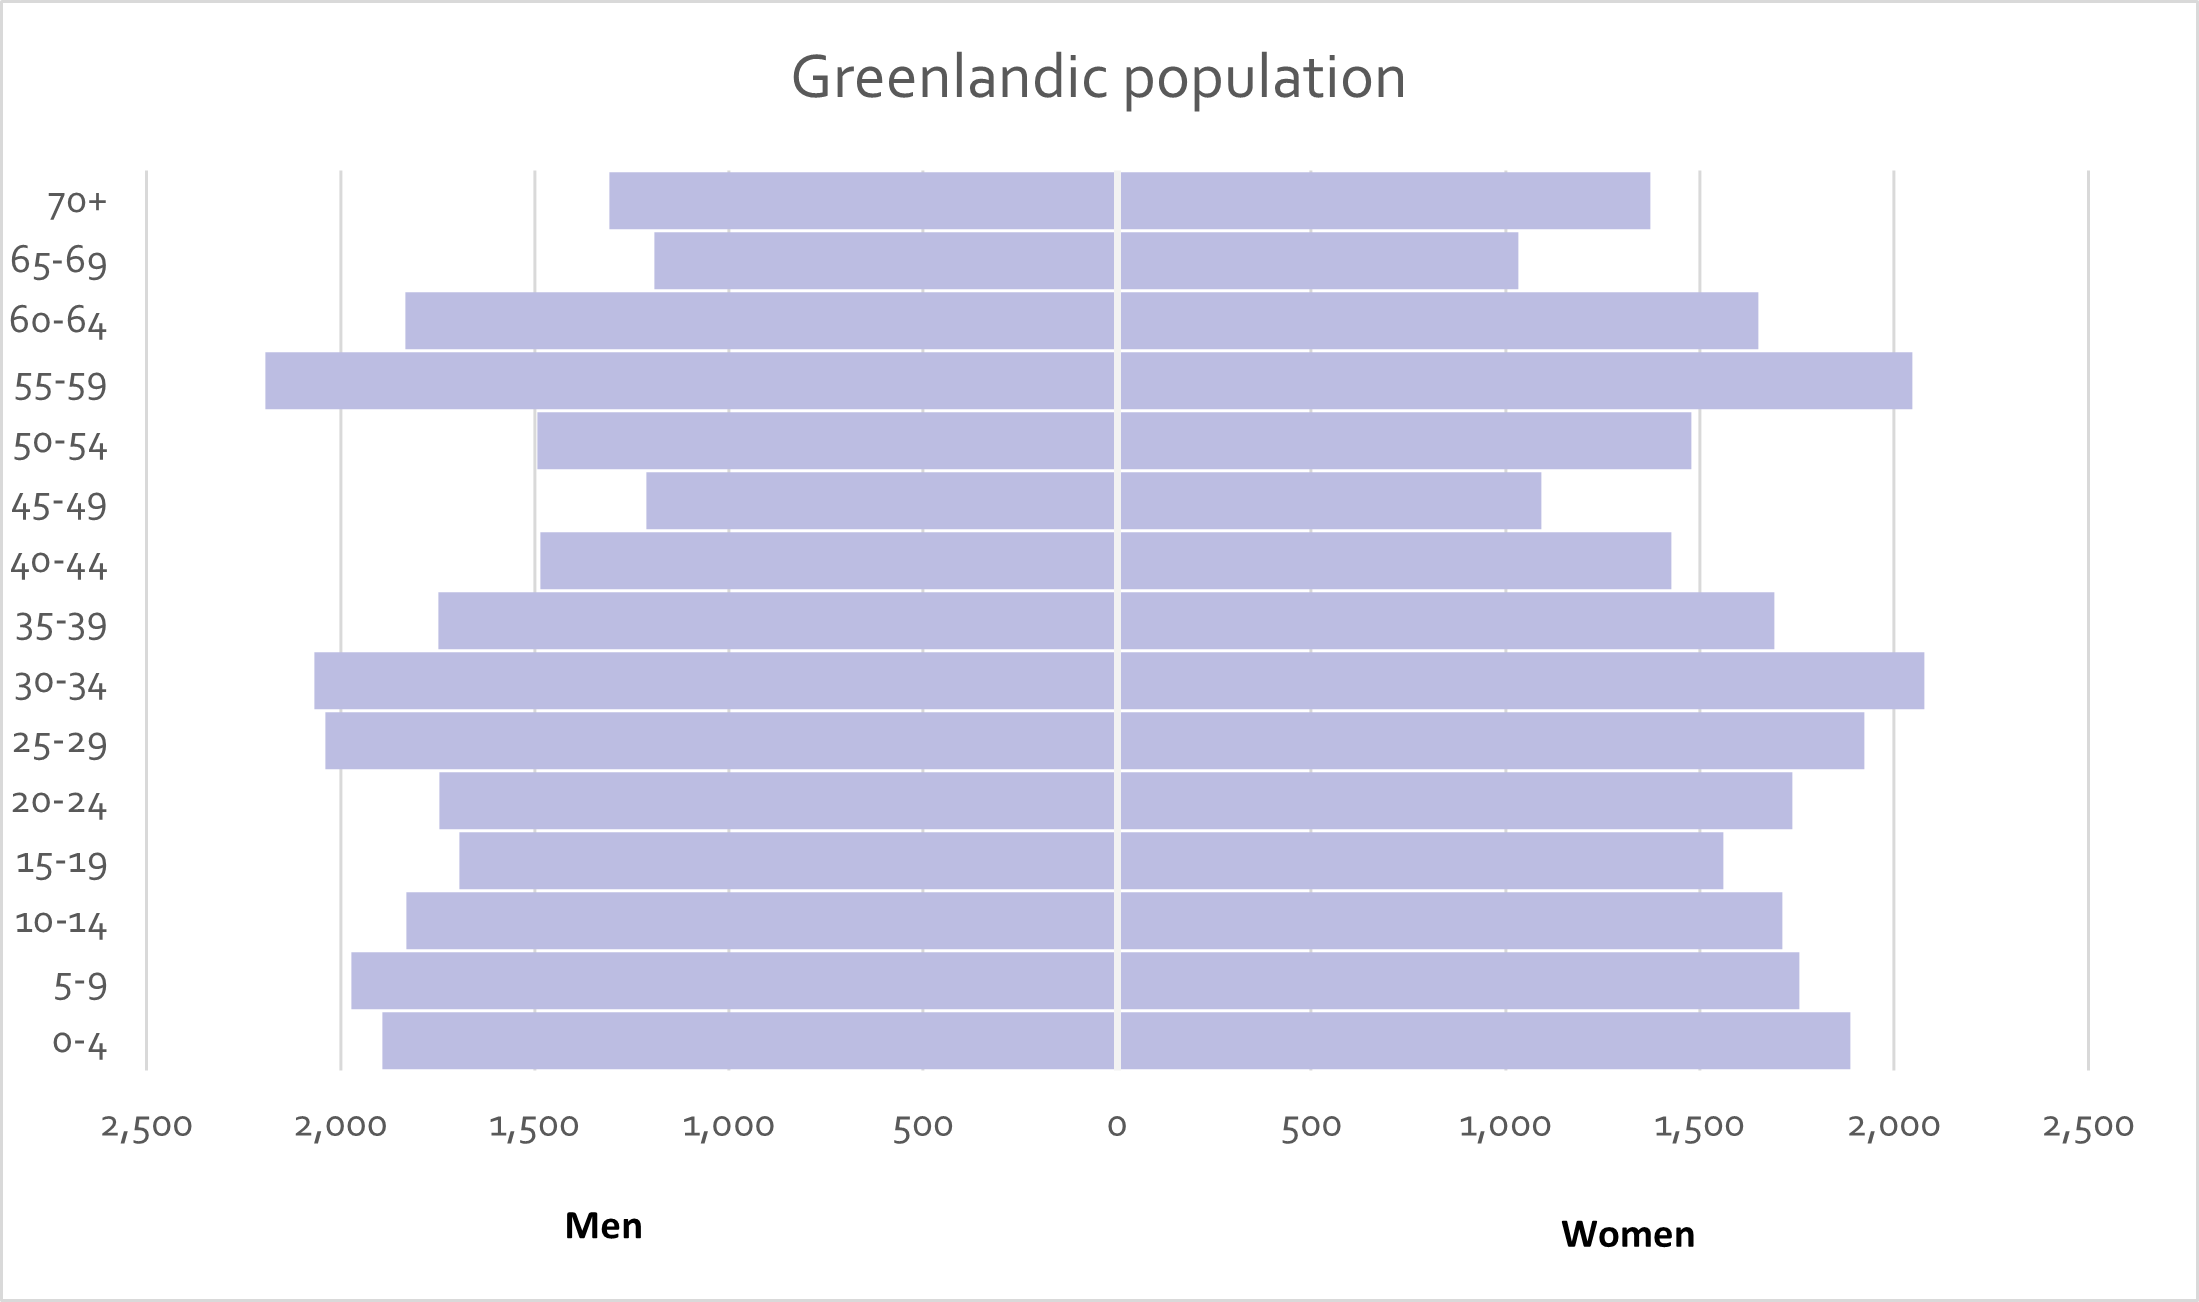
A comparison of the age and sex structure of Nordic migrant populations in the Nordic countries paints a diverse picture. That is evident in Figure 27, which compares the age and sex structure of native-born populations in each country with the age and sex structure of the resident Nordic migrant populations (Nordic migrants). In Iceland and on the Faroe Islands, Nordic-born populations are fairly young, with an overrepresentation of people in lower age groups. In Iceland, many Nordic migrants are in the core working ages, which is likely a reflection of the good job opportunities in the tourism sector in particular. Such job opportunities attracted many immigrants to Iceland both before and after the pandemic. People of working age are also overrepresented among Nordic populations in Denmark, Finland and Norway. In Norway, Greenland, Åland and Sweden, there are large groups of Nordic immigrants of retirement age. Those groups are particularly overrepresented in Sweden, with a majority of these older Nordic migrants coming from Finland. That is a reflection of Finnish-Swedish migration history. Many Finnish migrants who came to Sweden in the 1960s and 1970s to work have settled and have now reached retirement age.
Figure 27: Native-born populations and Nordic migrant populations by age and sex in each Nordic country (2023).
Note: The population pyramids show the population born in each Nordic country and autonomous region who still live there (first pyramid for each country) and the Nordic migrants who were born elsewhere in the Nordic Region but now live in the given country/autonomous region. The left-hand side of the population pyramids show the male populations, the right-hand side female populations.
Source: Nordic Statistics Database.
Denmark
Finland
Iceland
Norway
Sweden
Åland
Faroe Islands
Greenland
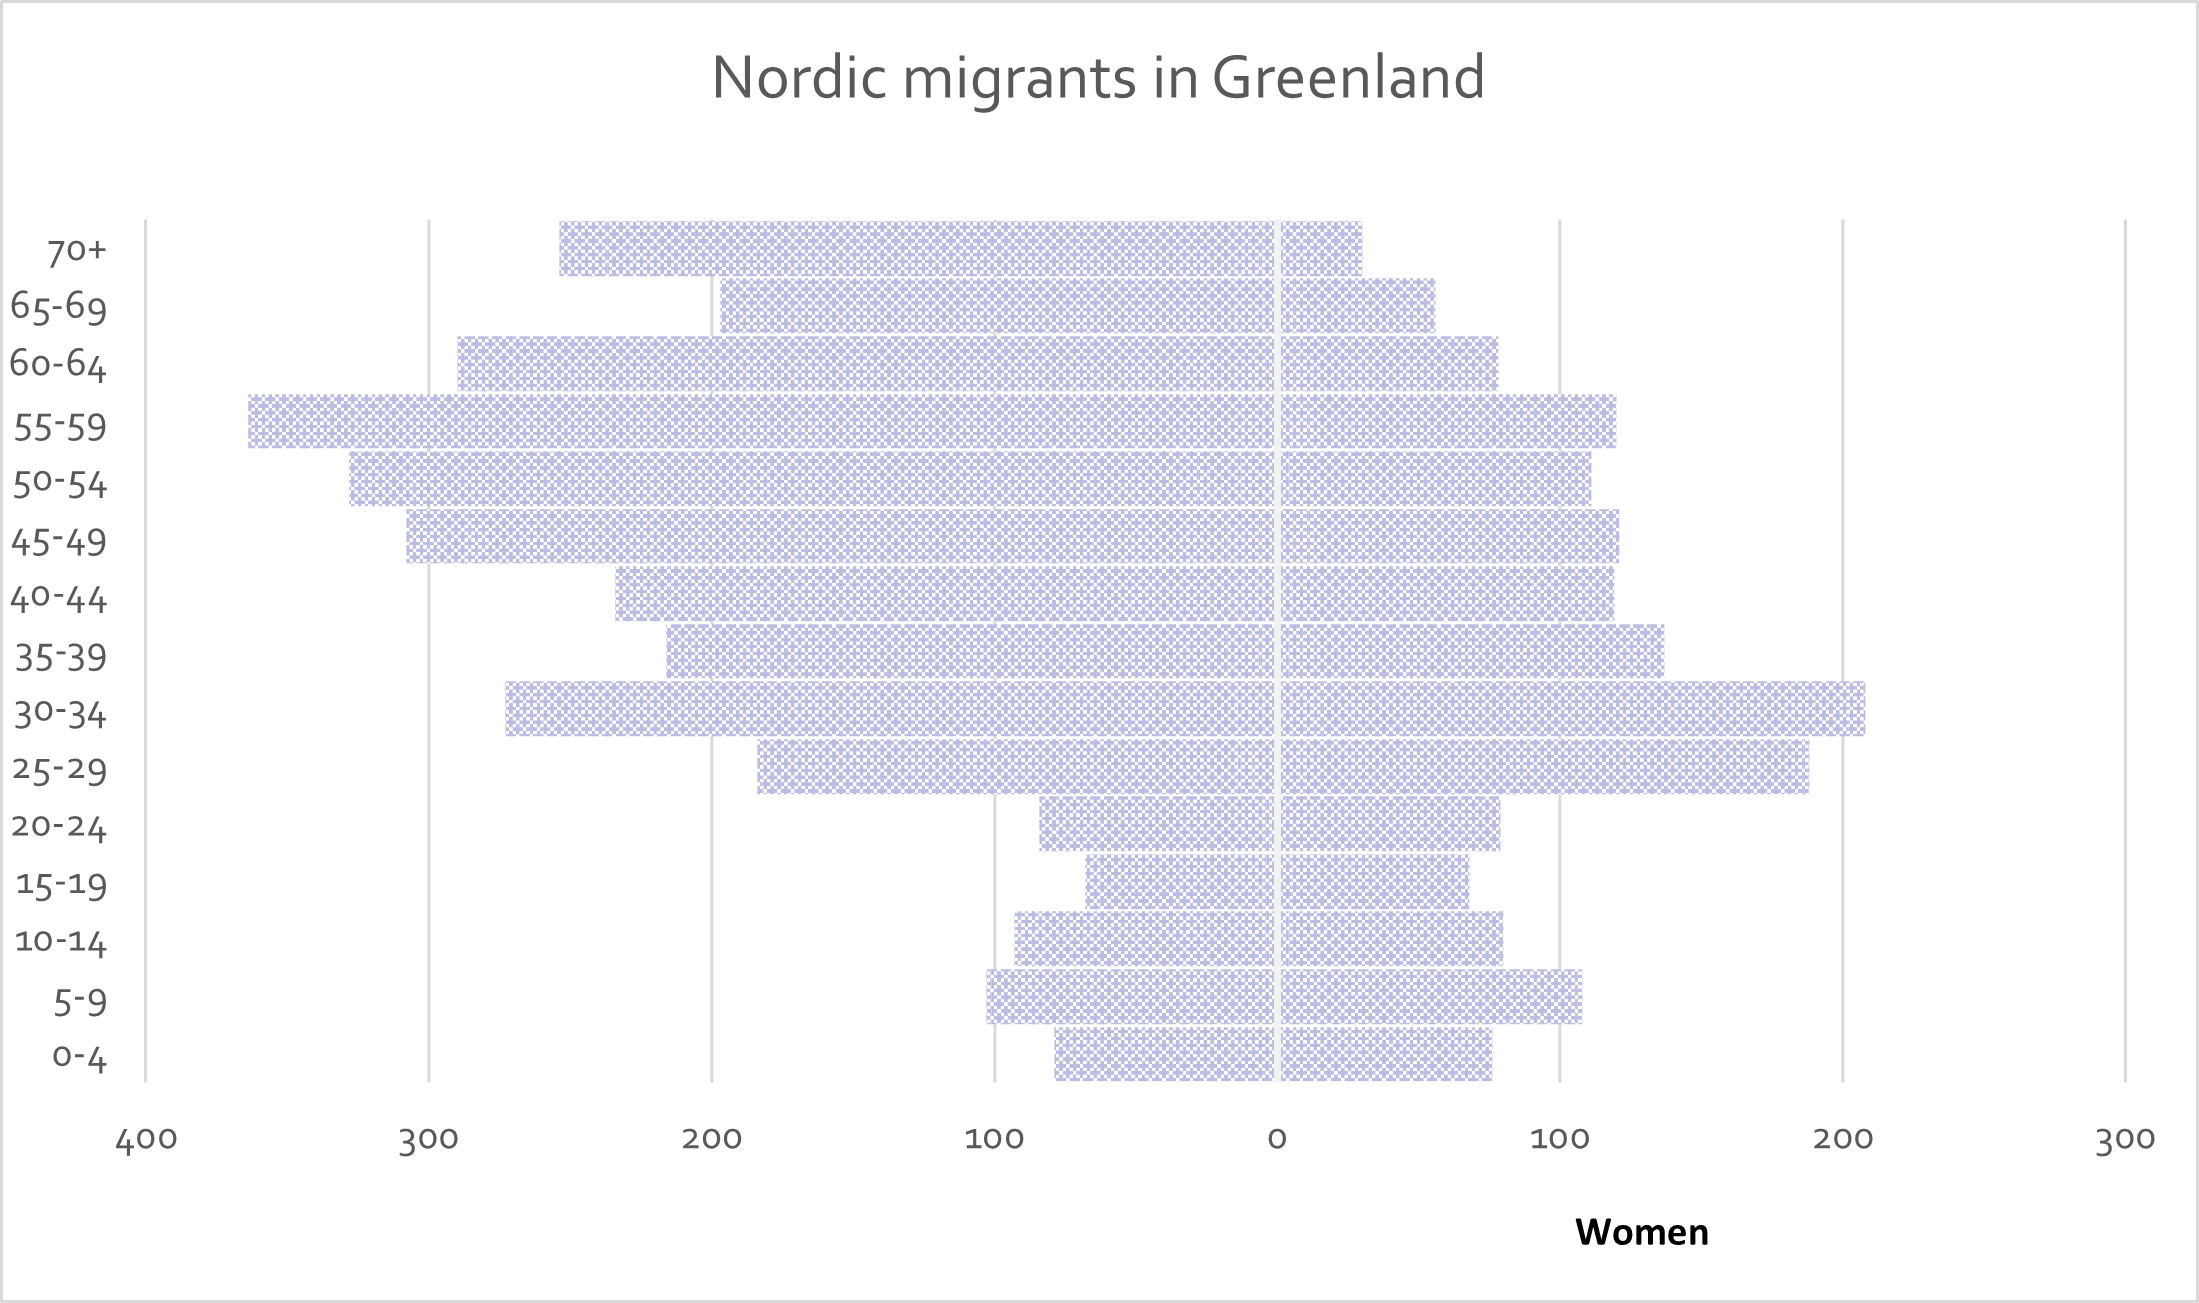
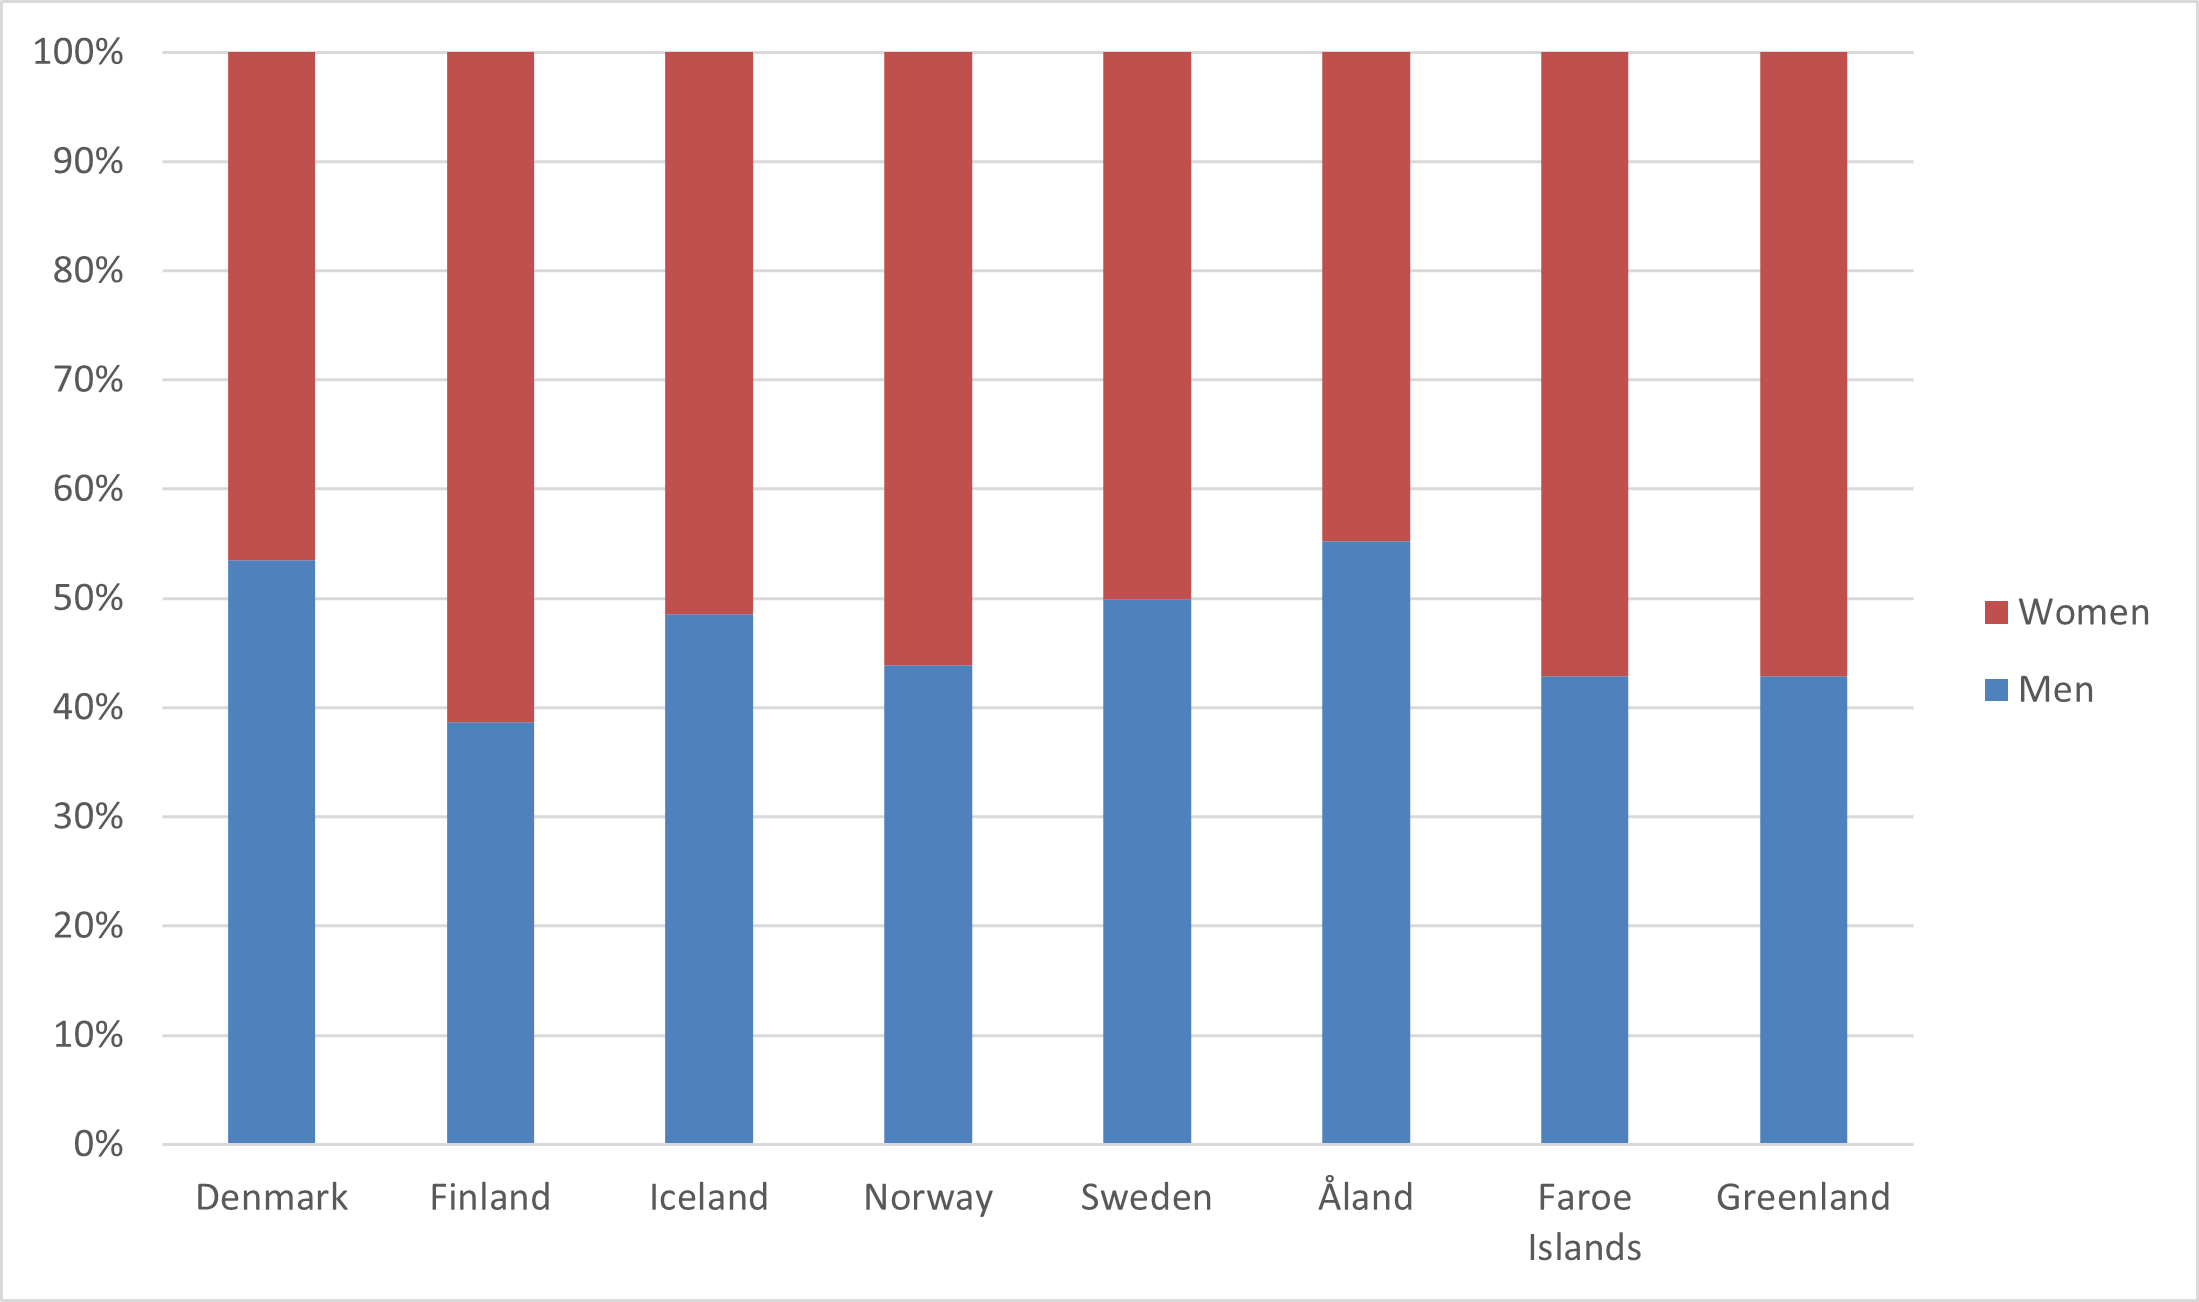
The academic literature on international migration tells us that men have traditionally been overrepresented among immigrants, including in the Nordic Region (Fischer and Straubhaar, 1996). Nonetheless, that has changed during recent decades as women have also become more likely to move abroad for studies or work. In the Nordic context, women are in fact overrepresented among Nordic migrants in several countries today (Figure 28). Most notably, women form the majority of Nordic migrants in Denmark (58%), Sweden (57%) and Åland (55%). Conversely, men make up the majority of Nordic migrants living in Finland (53%), the Faroe Islands (53%) and Greenland (66%). The gender ratios of Nordic immigrants are more balanced in Norway and Iceland.
Figure 28: Gender balance of Nordic migrants, by Nordic country of residence (2023)
Source: Nordic Statistics Database.
Source: Nordic Statistics Database.
At the time of writing, there are no open access, up-to-date and comparable statistics on socio-economic characteristics of Nordic migrants. The most recent comparable datasets about Nordic migrants were produced in the context of a collaboration between the Nordic Statistical Institutes and are available in the Nordic Statistics database.
https://www.norden.org/en/news/what-do-we-really-know-about-integration-nordic-region
Several of the Nordic Statistical Institutes also publish a number of datasets, which provide some information on socio-economic characteristics of Nordic migrants. However, those datasets are dispersed and not available for all countries. They do not therefore lend themselves to a comparative analysis of the characteristics of Nordic migrants.
In addition, existing academic studies can provide some indication of the socio-economic profiles of Nordic migrants, for example in terms of their skill levels. Those studies have been reviewed in earlier publications (Fischer and Straubhaar, 1996; Pedersen, Røed and Wadensjö, 2008). The reviews show that before the 1980s Nordic migrants tended to have relatively low levels of formal education. That, however, has changed during recent decades and Nordic migrants now tend to have medium or higher levels of education and are often white-collar workers. That is driven in part by the expansion of education in the Nordic countries during the past decades, with increasingly high proportions of Nordic people attaining higher levels of education.