3.2. Future supply and demand from a regional perspective
In order to understand the dynamics of the labour market, it is important to note that most labour markets are local and regional rather than national. That means that, for example, an industrial rise or decline may have large implications for the local labour market and the regional economy, while it plays a more limited role in national statistics.
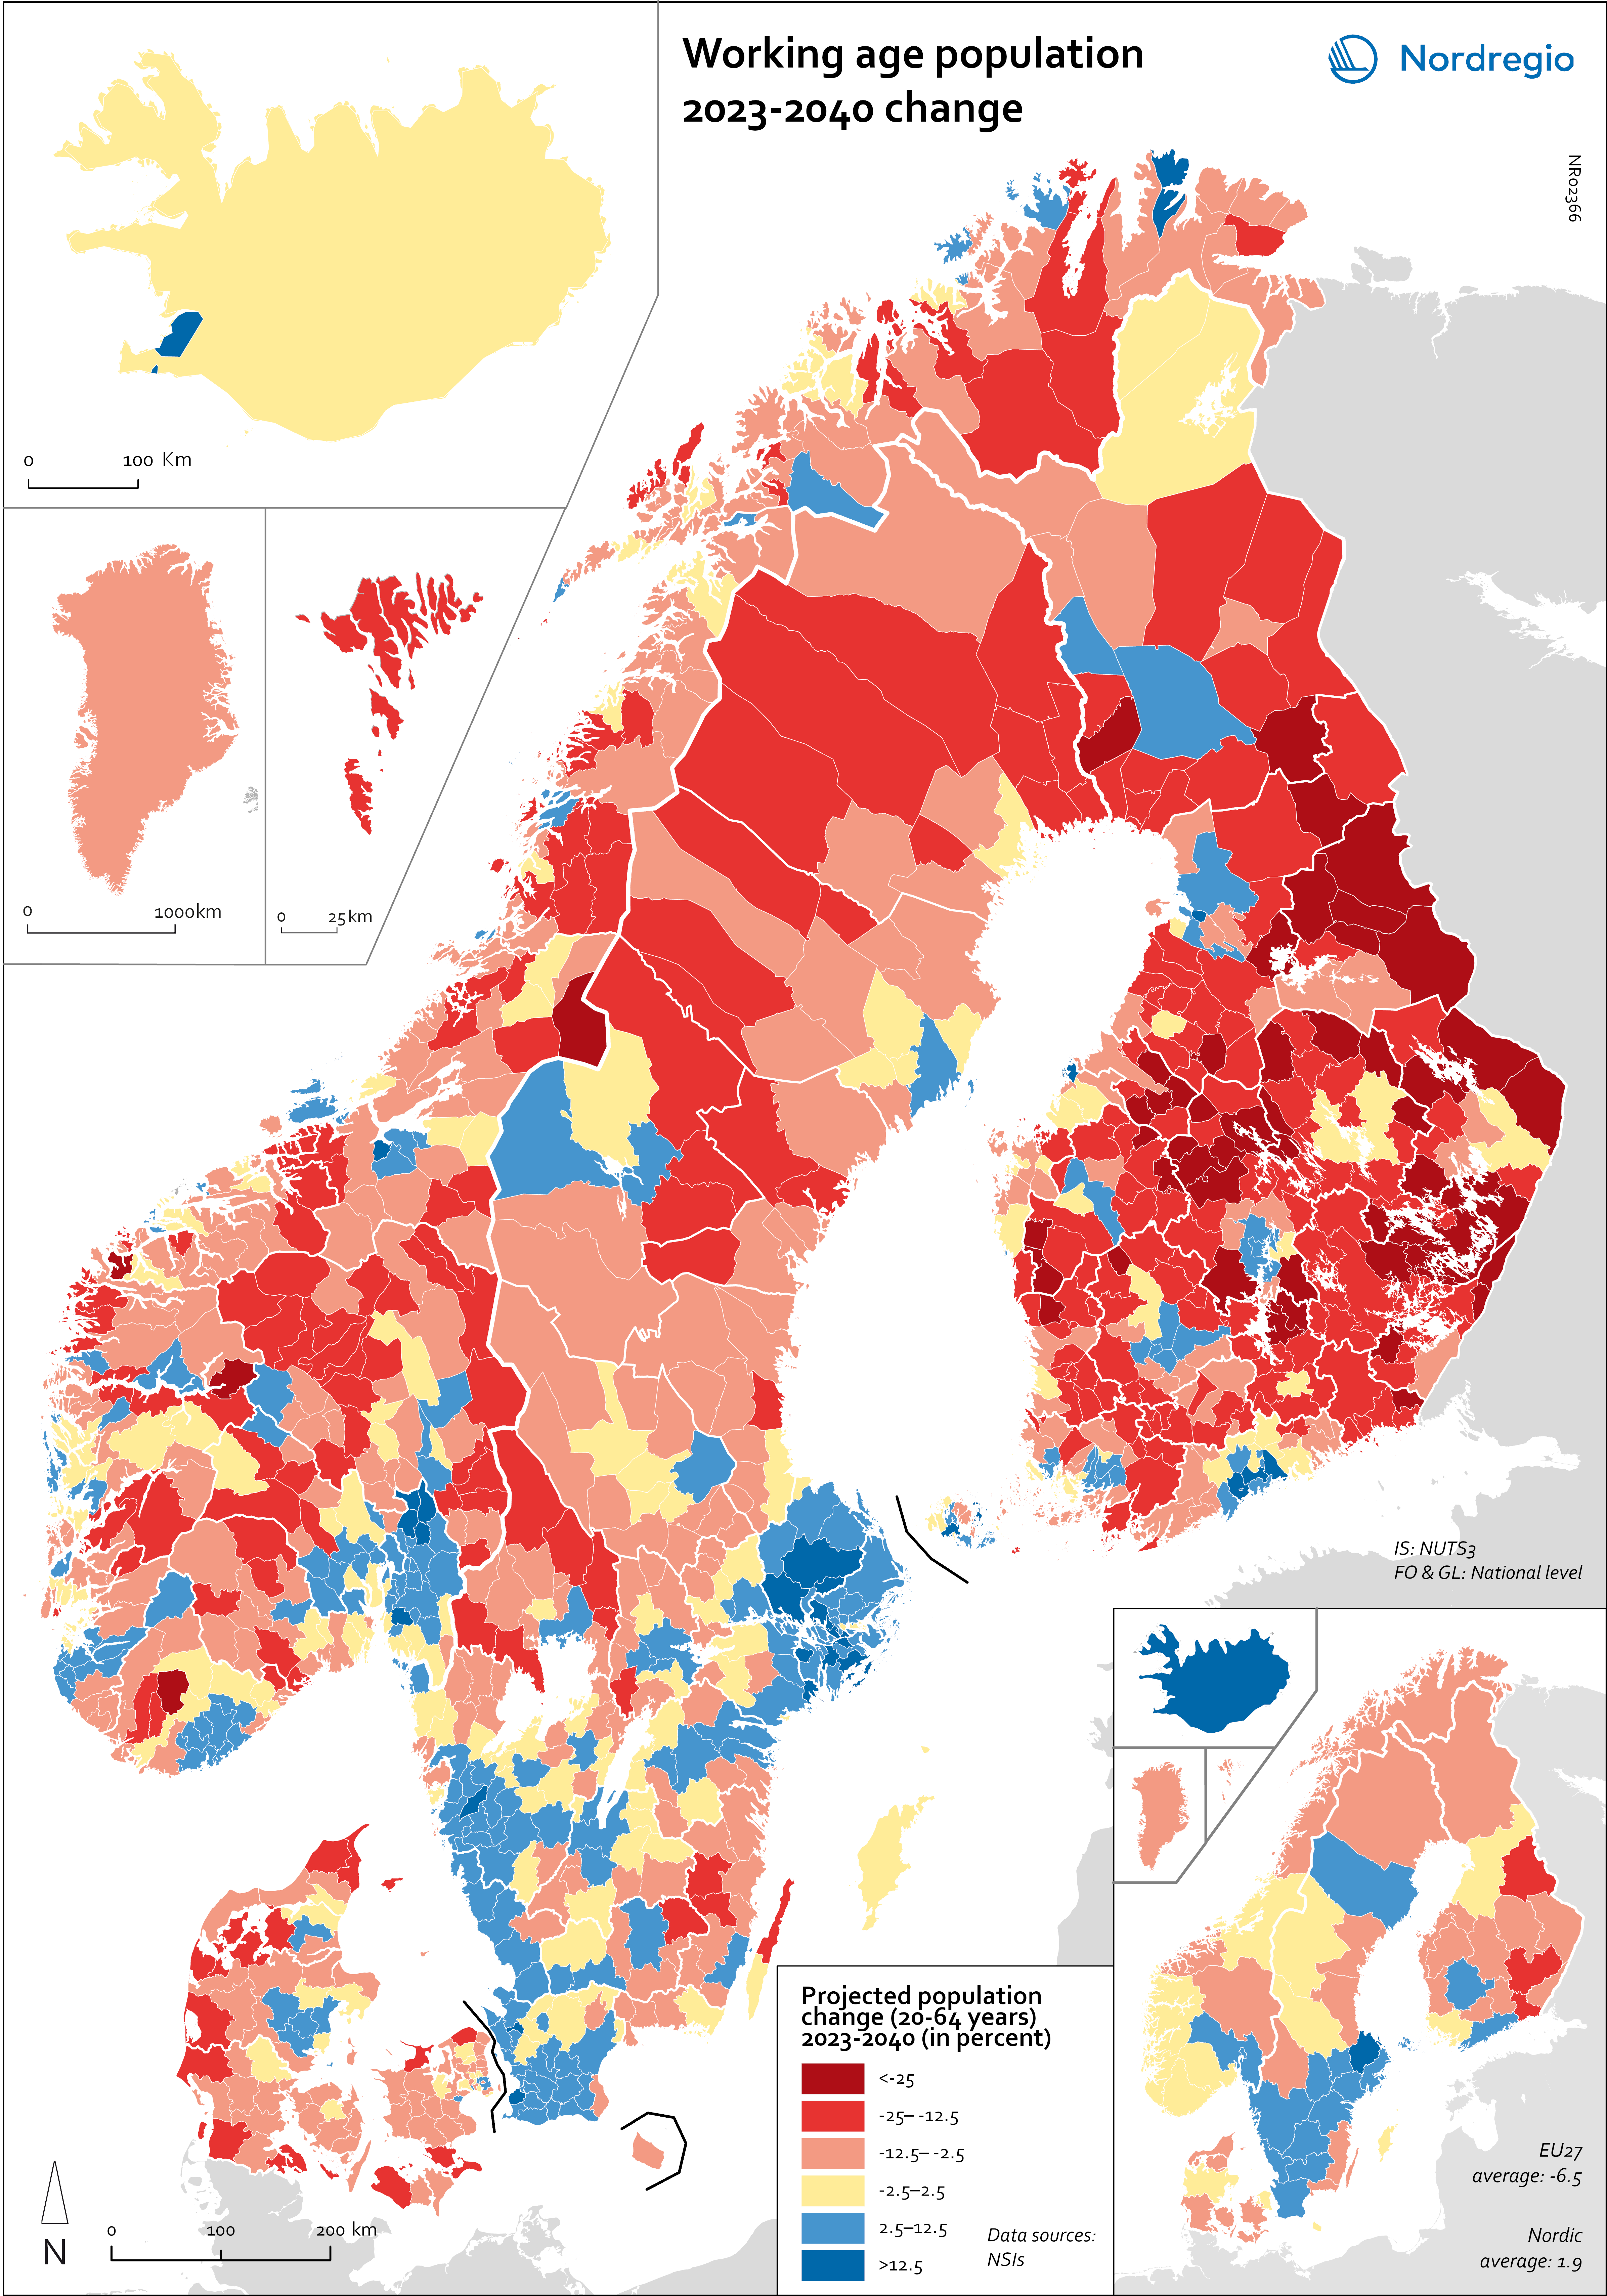
A local labour market is the functional area where demand and supply for labour meets and is defined by the core and its commuting zone (Borges, 2020). Map 4 shows the local labour markets in the Nordic Region with the circles representing the number of employed.
More information about the definition can be found here: https://nordregio.org/maps/nordic-local-labour-market-areas-2018/.
Most probably Haparanda-Torneå would constitute a joint local labour market but data on commuting between Sweden and Finland are lacking.
Map 4: Local Labour Markets in the Nordic Region 2022 by number of employees.
This chapter explores regional variations in labour demand and supply within the Nordic Region, primarily relying on official statistics from Nordic sources. Its primary goal is to illuminate cross-regional disparities and identify areas where increased mobility could yield benefits. While the overall forecast for the Nordic Region suggests high labour scarcity, an ageing population and demand for highly skilled workers, significant variations emerge at the regional level.
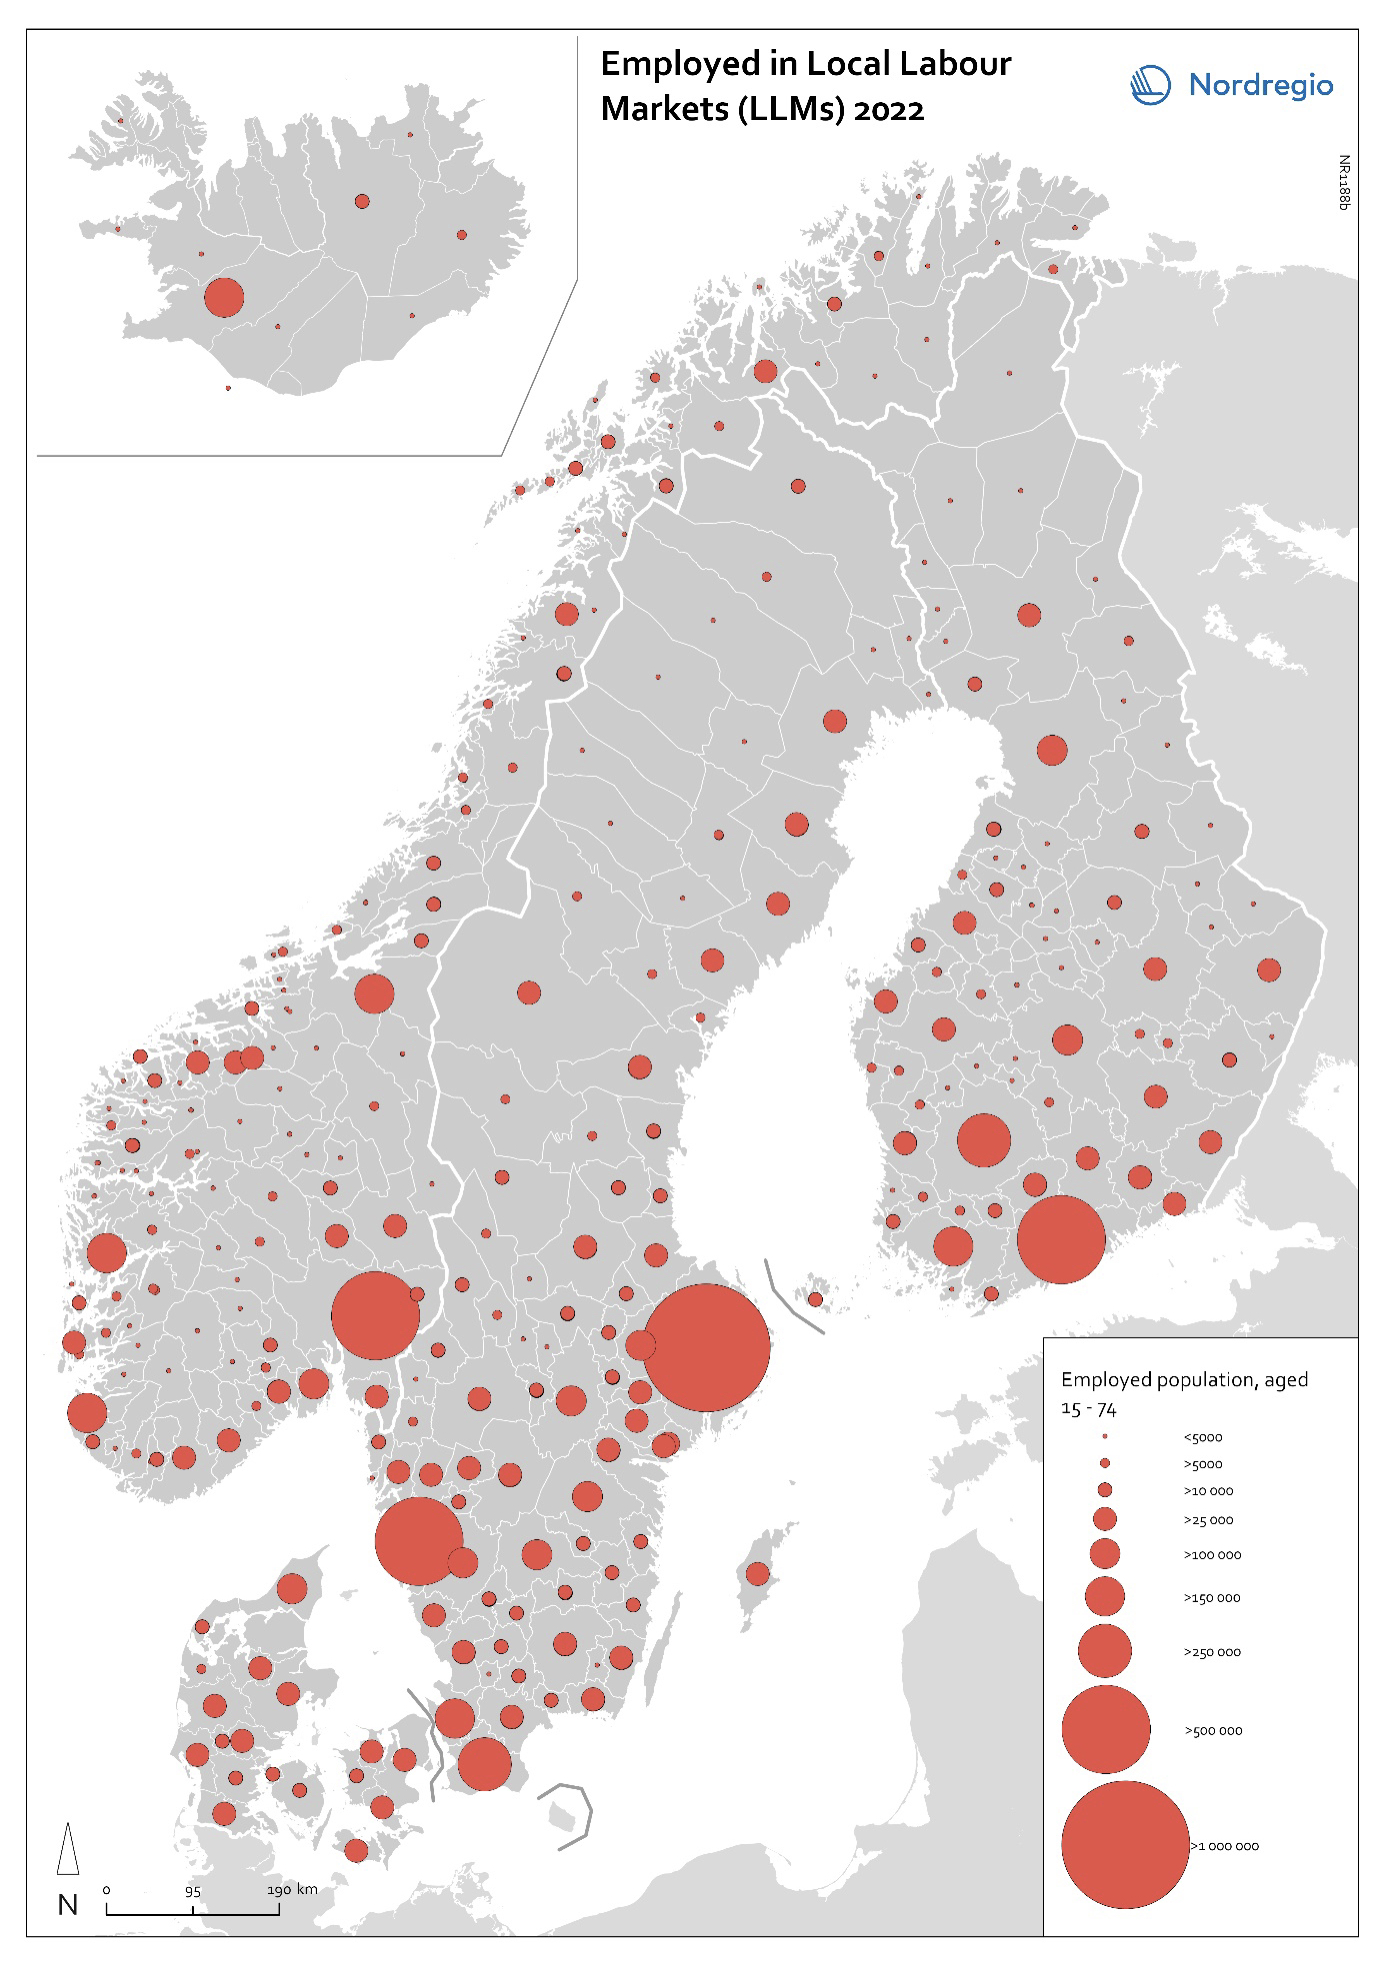
Beginning with the current employment levels in the Nordic Region, there are notable discrepancies across regions. In 2022, on average, over 80% of the population aged 20-64 were employed, exceeding the EU-27 average of 75% (see Map 5). However, regional disparities are evident. Notably, in Finland and Greenland, certain regions exhibit employment rates below 70% among the main working age population (20-64). Nevertheless, these regional figures obscure significant variation at the municipality level. For instance, in eastern Finland, employment rates were notably lower, often falling below 70%, while some areas exceeded 80%. Similarly, within the Skåne region in Sweden, employment rates range from over 85% in some municipalities to just under 75% in others. The lowest employment rate can be found in Lund, which is a university city where a substantial share of the population are studying. That also shows the limits of employment rate as an indicator of labour market performance.
Moreover, the map highlights disparities in employment between countries in cross-border regions. A prominent example is the Tornedalen cross-border region, where employment on the Swedish side exceeds 85%, while on the Finnish side it falls below 75%. Another instance is the Värmland – Østfold cross-border region, where employment levels are high in Värmland, Sweden, but are not at the same level on the Norwegian side.
When discussing employment, it is crucial to note that it is calculated as a share of the working age population. Consequently, the employment rate reflects individuals employed relative to the working age population, but does not provide insight into those not employed. Unemployment levels are therefore also presented in Map 6 to offer a more comprehensive understanding of labour market dynamics.
Map 5: Employment rate in the Nordic Region 2022.
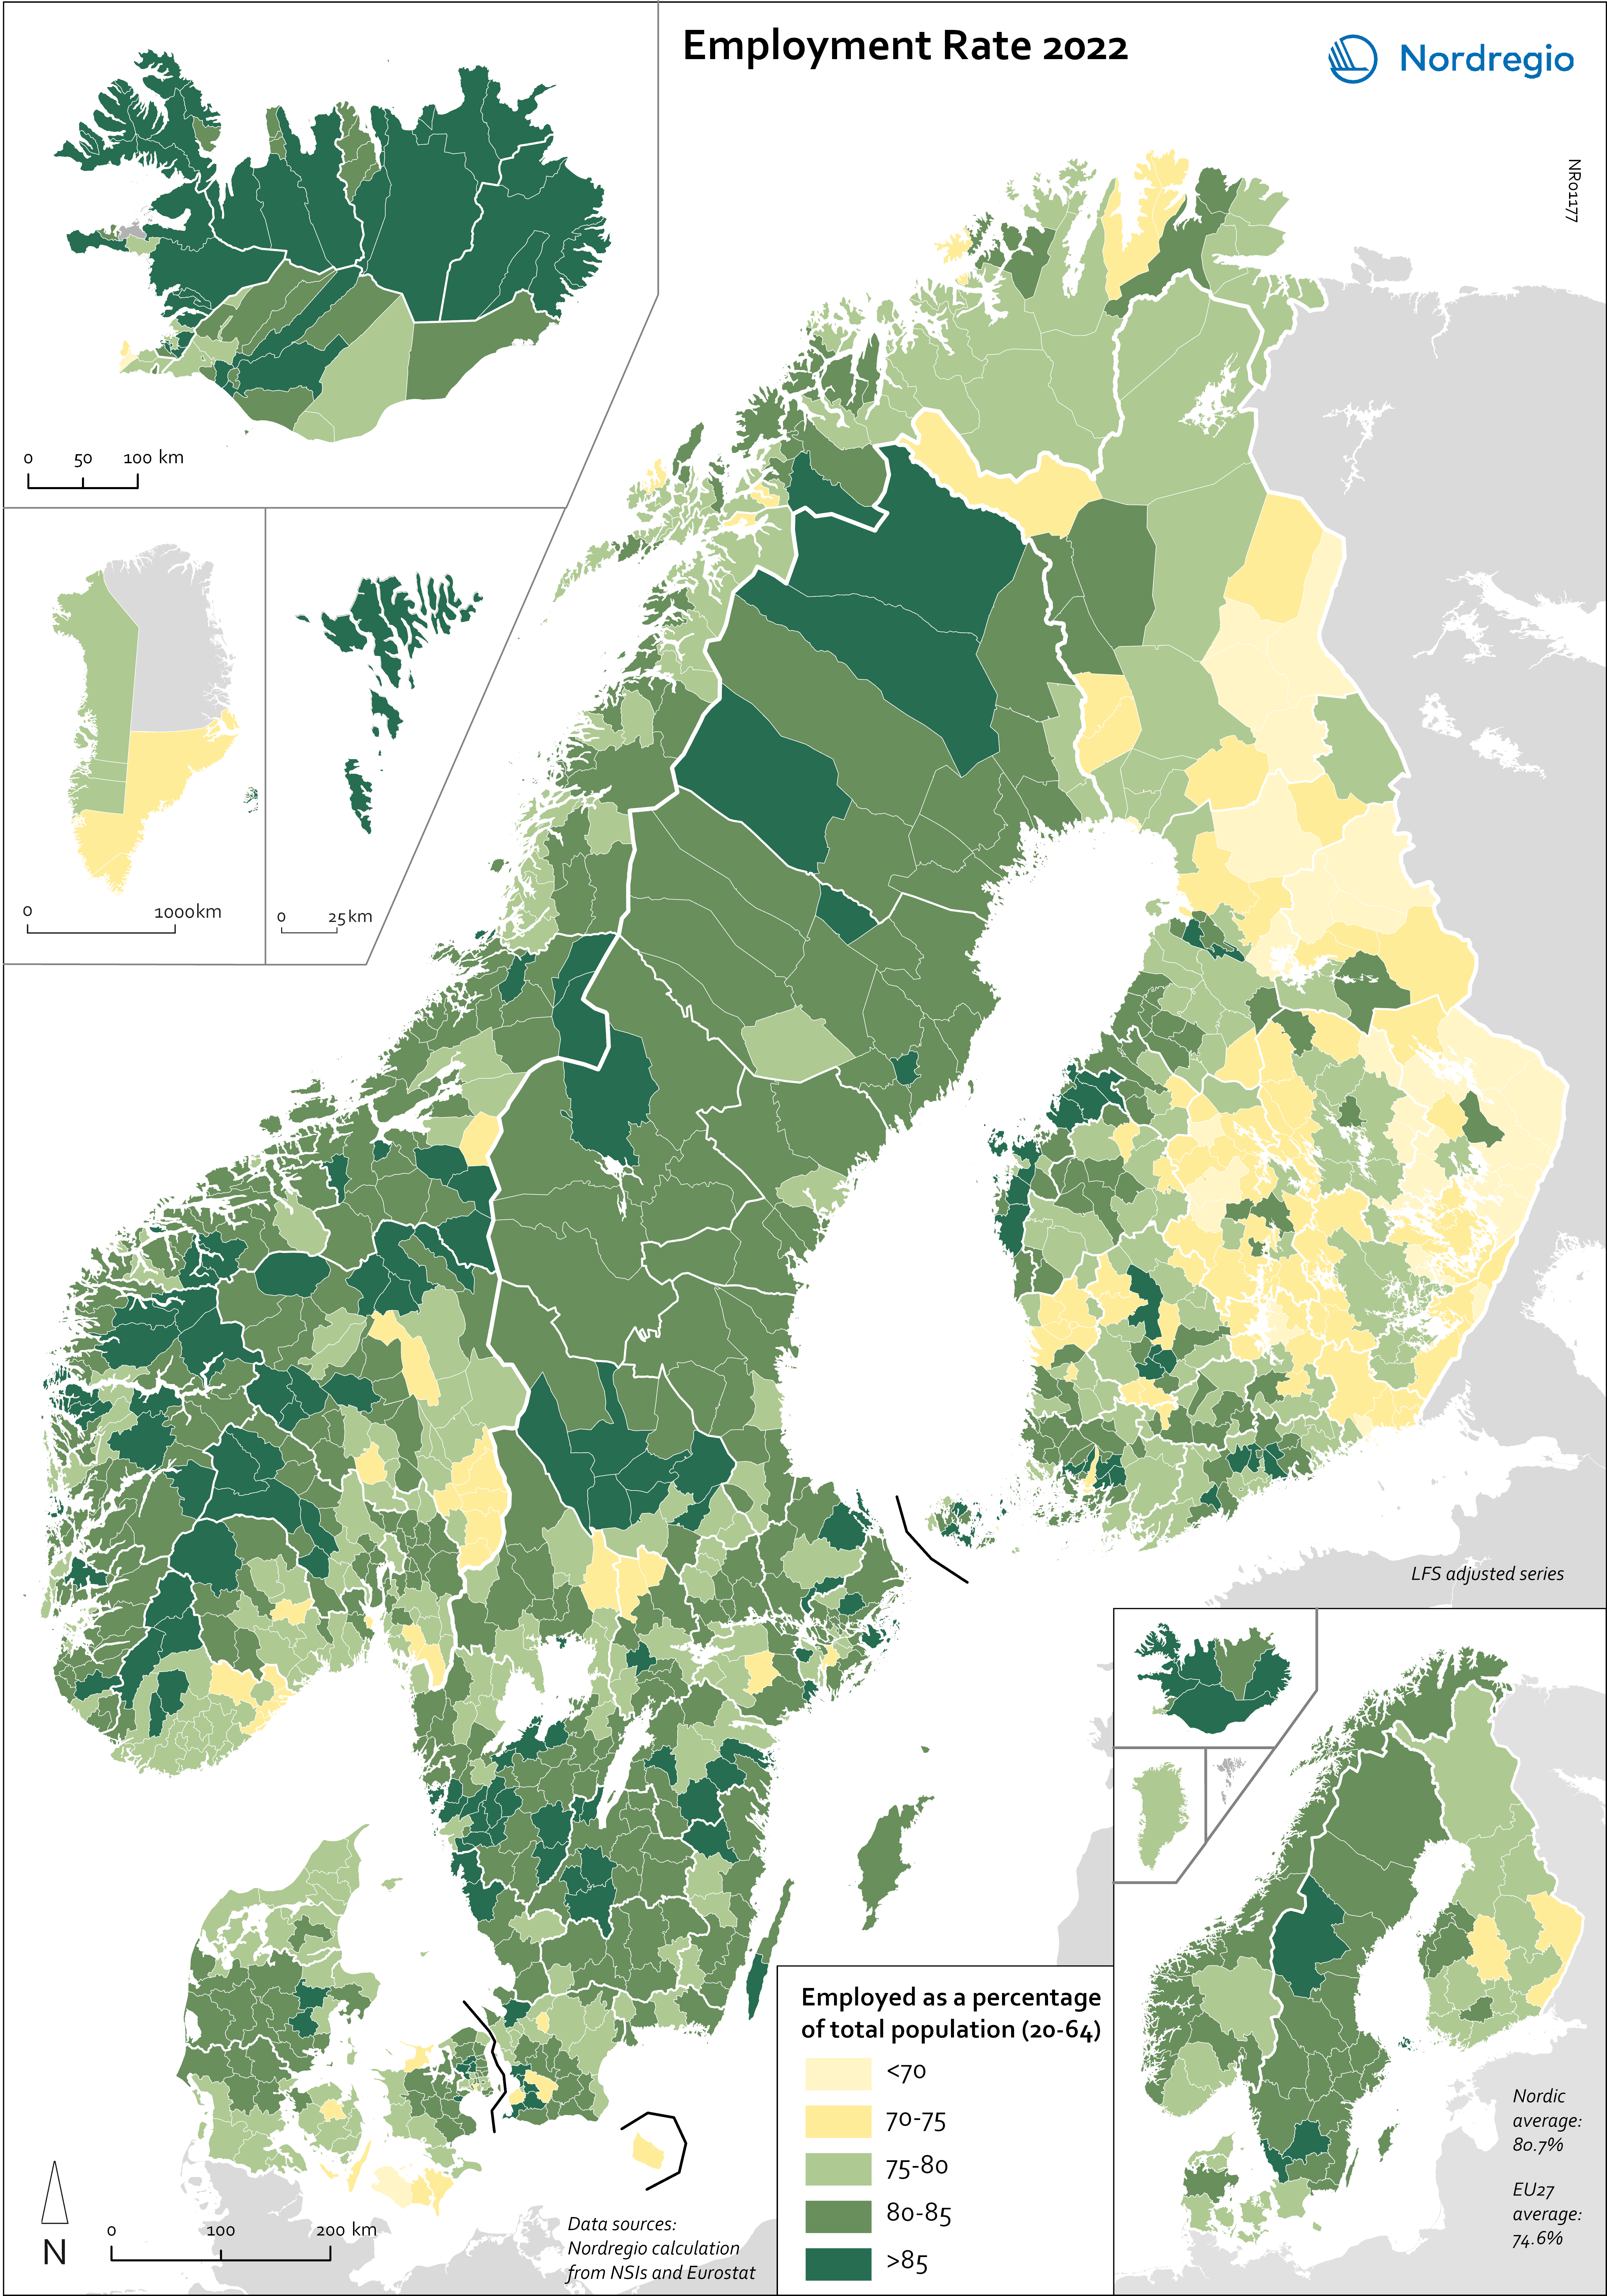
As mentioned, while employment provides insight into the current alignment between supply and demand, unemployment levels offer a more nuanced understanding of the extent to which individuals are actively seeking work and are currently at the disposal of the labour market. The International Labour Organization (ILO) defines unemployment as individuals actively searching for employment at a specific point in time. Map 6 shows the unemployment rate on a municipal level using data that have been harmonised with the Labour Force survey (which is the official source for labour market statistics). The unemployment rate is measured as unemployed persons as a share of the total workforce. The workforce consists of those who are in employment and those who are unemployed. Those who are outside the labour market are therefore not included here.
When analysing unemployment rates at the national level, discrepancies arise among the Nordic countries, notably with higher rates observed in Sweden and Finland. Those variations in unemployment rates can partly be attributed to structural unemployment in those countries, meaning that certain demographic groups encounter difficulties in securing suitable employment opportunities. Additionally, differences in systems related to unemployment benefits, sick leave policies and other factors contribute to those variations.
Specifically, since unemployment is calculated as a share of the workforce (i.e. the sum of individuals of working age who are either employed or actively seeking employment), lower levels of unemployment might also result from individuals exiting the workforce entirely. That raises a key point for comparison across countries: higher unemployment levels might be indicative of larger labour force participation, meaning fewer individuals are dropping out of the labour force due to low alternative benefits. For example, in 2022, both the employment rate and the unemployment rate were higher in Sweden compared to Norway. That suggests that a higher proportion of individuals are employed in Sweden, but concurrently a significant share of individuals are actively seeking employment. By contrast, in Norway those individuals were likely outside the labour market, likely receiving social assistance such as unemployment benefits or sick leave payments.
That highlights the fact that while unemployment serves as an indicator – of those immediately available to work – it also conceals those who are entirely outside the labour market and not actively seeking employment. In the Nordic Region around 15% of the age group 20-64 are outside the labour force, with that group also consisting of students and those who are sick etc.
Considering the intricacies involved in comparisons between countries and the diverse policy implications, it remains worthwhile to examine regional and municipal levels. In some cross-border regions, distinct differences in unemployment levels between countries suggest that labour mobility or commuting could help to mitigate unemployment. Notably, regions that stand out in terms of employment are also relevant with respect to unemployment. Those include the Swedish-Finnish border in the north and the Copenhagen-Malmö area.
Map 6: Unemployment rate in the Nordic Region 2022.
Forecast of regional working age population
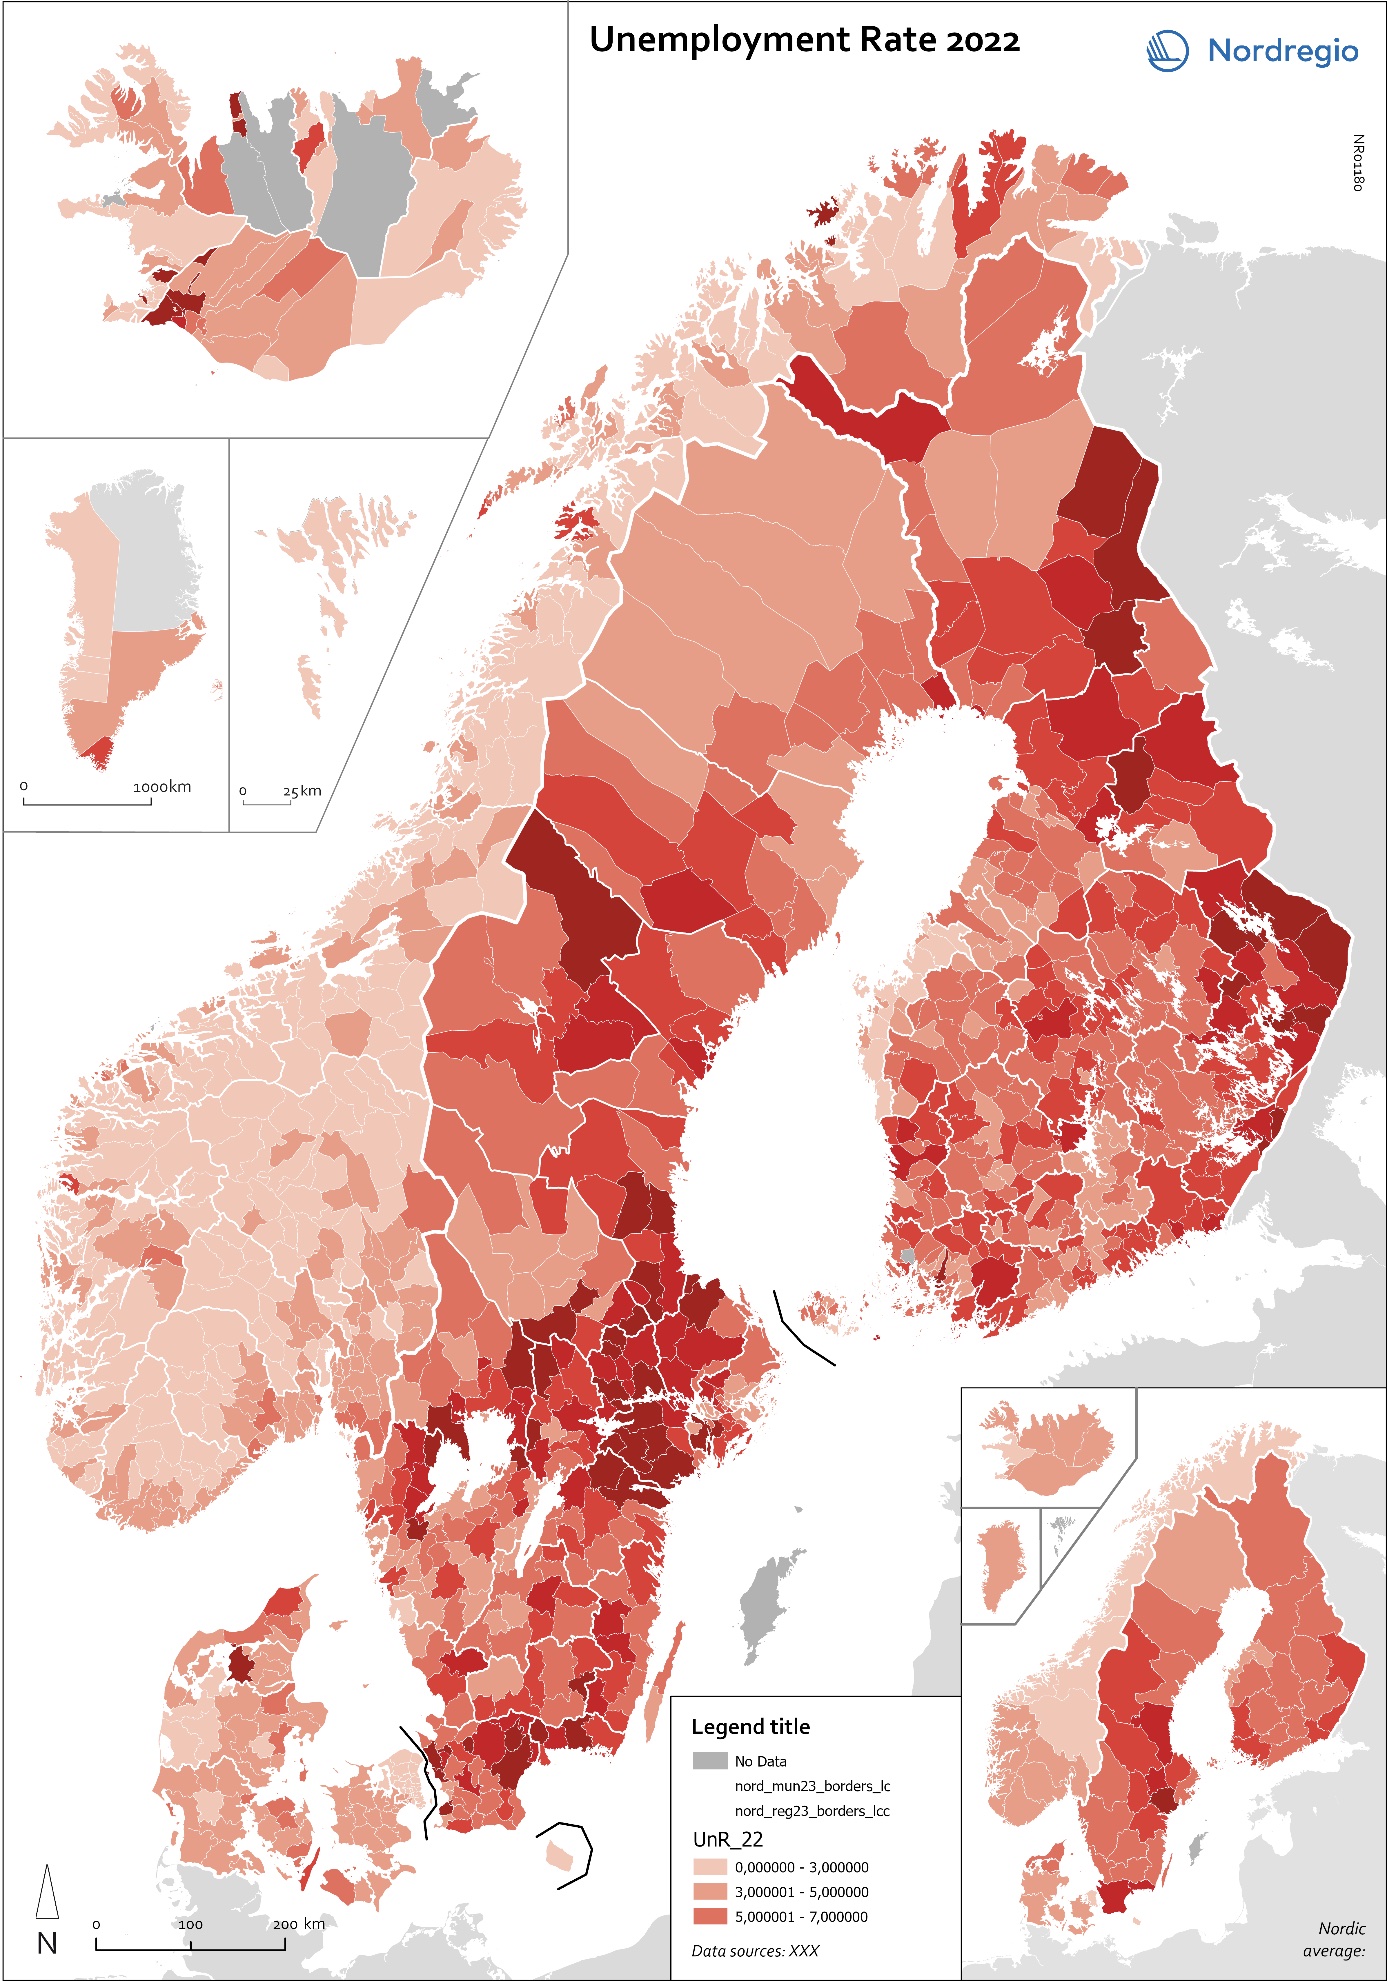
As mentioned, all Nordic regions face the challenge of an ageing population, but there are significant regional variations. Map 7 illustrates the percentage changes in the working age population between 2023 and 2040, with red indicating declining populations and blue showing the opposite trend. A decreasing working age population (measured here for the age group 20-64 years) is a prevailing trend across much of the Western world. For the EU as a whole, that age group is anticipated to decrease by 6.5% between 2023 and 2040. Only five EU countries are projected to experience growth in their working age populations during this period: Malta, Luxembourg, Ireland, Sweden and Belgium.
In the Nordic Region overall, however, a slight increase in the working age population is expected, averaging 1.9% growth. As depicted on the map, the distribution varies significantly, with substantial differences both between and within countries. The largest increase is anticipated in Iceland (28%), followed by Sweden (5.8%), Åland (3.9%) and Norway (0.6%). Conversely, decreases are forecast in Finland (-0.5%), the Faroe Islands (-2.6%), Denmark (-3.2%) and Greenland (-11.4%).
Generally, the trend of urban population growth and rural population decline is expected to persist. Regions with the highest projected population growth include Höfuðborgarsvæðið in Iceland, Uppsala (+13%), Stockholm (+12%), Skåne (+9%), Halland (+7%) and Västra Götaland (+6%) in Sweden, Uusimaa (+8%) and Pirkanmaa (+5%) in Finland and Oslo and Viken in Norway (+5%). Notably, Copenhagen municipality (+5%) and Rødovre (+9%) and Vallensbæk (+6%) in the capital region (Hovedstaden region) in Denmark are also expected to experience significant increases. However, the majority of municipalities in the Hovedstaden region are anticipated to see a decline in their working age populations.
Several Finnish regions including Satakunta, Etelä-Karjala, Kainuu, Kymenlaakso and Etelä-Savo, along with Greenland, are projected to experience a decrease in their working age population of more than 10%.
Across the entire Nordic Region, rural municipalities are expected to witness a 5.8% decline, while urban municipalities are projected to grow by 7.3% and interim municipalities are anticipated to maintain a stable labour supply.
That regional variation in the size of the working population has implications for the importance of mobility and commuting in terms of maintaining the population in some regions. In addition, considering trends in urbanisation, some rural areas are expected to experience very high levels of labour shortages.
Map 7: Forecast change in working age population 2023-2040.