In the last decade, increased labour demand in Iceland can be largely attributed to the tourism and construction sectors, particularly in the countryside. (Photos: Mees Dekker via Wikimedia Commons and Freepik)
6. ICELAND
Iceland’s economy and labour market
Iceland has a small open economy that is heavily reliant on natural resources. Consequently, production is relatively undiversified, with most exports stemming from fishing, renewable energy and tourism. While the Icelandic economy has historically been heavily dependent on the fishing sector, manufacturing production based on renewable energy has increased rapidly since the turn of the millennium, and the tourism sector has undergone tremendous growth since 2010.
Iceland’s productivity is high by international comparison, although it remains lower than that of Denmark, Norway and Sweden. Alongside this, Iceland’s high overall labour supply compared to the other Nordic countries and continental Europe has contributed to the country’s high GDP per capita. This abundant labour supply is reflected in high employment rates – particularly among younger and older age workers – and low unemployment rates.
As implied by the above, a key characteristic of the country’s labour market is that Iceland experiences full employment most of the time.
Registered unemployment only went above 4% in four of the years covered by the period 1957–2008, reaching a peak of 5% in 1995 (Statistics Iceland n.d.a).
Iceland’s labour market is seen as being comparatively flexible, supported by a lenient legal framework – for example, the country’s rules on hiring and firing rules are not strict. In practice, however, the labour market is largely regulated through collective bargaining, with trade unions and employers’ organisations engaging in negotiations over wages, working time arrangements and employment rights (see e.g. Ólafsdóttir & Olafsson 2014).
Collective bargaining tends to lead to more compressed wage distribution when it is centralised or coordinated (OECD 2018). In Iceland, collective bargaining is centralised, with negotiations taking place across occupations. As such, it is unsurprising that wage distribution in Iceland is more compressed than in many other countries. Under the 2019–2022 collective bargaining agreement, wages increased in nominal terms, meaning those on lower wages received a proportionally larger increase. This significantly compressed wage distribution, reducing the decile ratio from 2.64 in 2019 to 2.46 in 2022.
Compressed wage distribution, coupled with high labour market participation rates, leads to a more even distribution of income. Alongside this, Icelandic society shares many aspects of the Nordic welfare state – although social expenditures are lower than in other Nordic countries, this is partly explained by Iceland’s favourable age distribution and high employment rate. Measured by the Gini coefficient of disposable income, Iceland has the most even income distribution of the Nordic countries (see Table 6.1).
Arnaldur Sölvi Kristjánsson
University of Iceland
University of Iceland
Table 6.1. Selected economic and social indicators for Nordic countries, France, Germany, USA and OECD average.
Productivity1 | GDP per capita2 | Employment3 | Unemployment3 | Wage distribution4 | Income inequality5 | Social expenditure6 | Inflation7 | Growth volatility 8 | Trade union density9 | |
Denmark | 74 | 55.548 | 74% | 5.7% | 2.58 | 0.268 | 31.8% | 1.9% | 2.2 | 67% |
Finland | 63 | 46.454 | 70% | 8.0% | 2.57 | 0.273 | 27.8% | 2.0% | 2.9 | 59% |
Iceland | 66 | 52.433 | 83% | 4.7% | 2.46 | 0.235 | 22.3% | 4.3% | 4.2 | 91% |
Norway | 84 | 64.501 | 76% | 3.9% | 2.34 | 0.285 | 24.6% | 2.4% | 1.4 | 50% |
Sweden | 75 | 53.375 | 74% | 7.6% | 2.17 | 0.286 | 29.6% | 2.0% | 2.5 | 65% |
France | 65 | 42.950 | 65% | 8.9% | 2.95 | 0.298 | 33.3% | 1.9% | 2.5 | 11% |
Germany | 69 | 50.225 | 73% | 5.9% | 3.33 | 0.303 | 28.7% | 2.0% | 2.3 | 16% |
United States | 75 | 63.659 | 70% | 5.9% | 4.80 | 0.395 | 28.0% | 2.4% | 1.8 | 10% |
OECD average | 54 | 44.632 | 66% | 6.7% | 3.36 | 0.311 | 21.9% | 2.7% | 3.1 | 24% |
Notes:: 1 GDP per hours worked in US dollars, PPP converted (2022), source: OECD (n.d.a); 2 GDP per capita in US dollars, PPP converted (2022), source: OECD (n.d.b); 3 Average 2003–2022. Source: OECD (n.d.c); 4 Decile ratios of gross earnings (2021), source: OECD (n.d.d); 5 Public, mandatory private and voluntary private social expenditure (average 2000–2019), source: OECD (n.d.e); 6 Gini coefficient for disposable income (newest available year), source: OECD (n.d.f); 7 Harmonised index of consumer prices, the OECD average excludes Turkey (average 2000–2023), source: OECD (n.f.g); 8 Standard deviation in GDP growth 2000–2023, source: OECD (n.d.h); 9 Share of employee’s who are members of a trade union (newest available year), source: OECD (n.d.i).
Labour shortages
Labour markets are constantly evolving. Firstly, changes in aggregate demand caused by business cycle fluctuations affect labour demand: during periods of expansion, labour demand increases, meaning new jobs are created and fewer jobs destructed, leading to an overall increase in employment. Secondly, long-run trends unaffected by business cycle fluctuations – such as technology and structural changes – can affect labour demand either positively or negatively. Technological advances mean that goods and services can be produced using fewer inputs, which may cause a decline in employment or changes in relative employment. John Maynard Keynes (1930) famously predicted that by 2030 the work week would only be 15 hours due to productivity growth. In reality, however, increased productivity has led to increased consumption rather than increased leisure, with overall employment failing to decline over the long run. More specifically, while male employment rates have declined over the course of the 20th century, this has been offset by increases in female employment rates (see e.g. Borjas 2024).
Labour market dynamics can be examined from both the job and employee side. On the job side, the net employment change equates to the difference between job creations and destructions (which may or may not be due to business cycle fluctuations). In many OECD countries, more than 10% of jobs are created and more than 10% destructed each year, meaning that more than 20% of jobs are reallocated (not counting intra-firm reallocations) (Haltiwanger et al. 2010). Although these rates may be affected by business cycle dynamics, the implication nevertheless is that there are substantial numbers of job creations and destructions every year (Davis et al. 2012).
Employees transition between employment, unemployment and nonparticipation. Here, the change in hirings (flows from unemployment and nonparticipation to employment) less job separations (flows from employment to unemployment and nonparticipation) equals the net employment change.
Although there is no available data on job creations and destructions in Iceland, internationally comparable data on employee transitions is available. Every year, more than 90% of employees remain employed in Iceland and other European countries, whether in the same or a new job.
Iceland’s unemployment rate over recent years has been relatively low compared to other European countries. In fact, going back further in time it was exceptionally low: from the post-war era until the early-1990s, registered unemployment remained – aside from a single year – below 2%. Reflective of these trends, the transition into employment of individuals not working – either unemployed or outside the labour force – is very high in Iceland, while long-term unemployment is very low (see Figure 6.1). Thus, on average, few people are unemployed at any given time and tend to find employment within a short period of time. Although this could be indicative of more pronounced labour shortages, it may also suggest that Iceland’s labour market is more efficient.
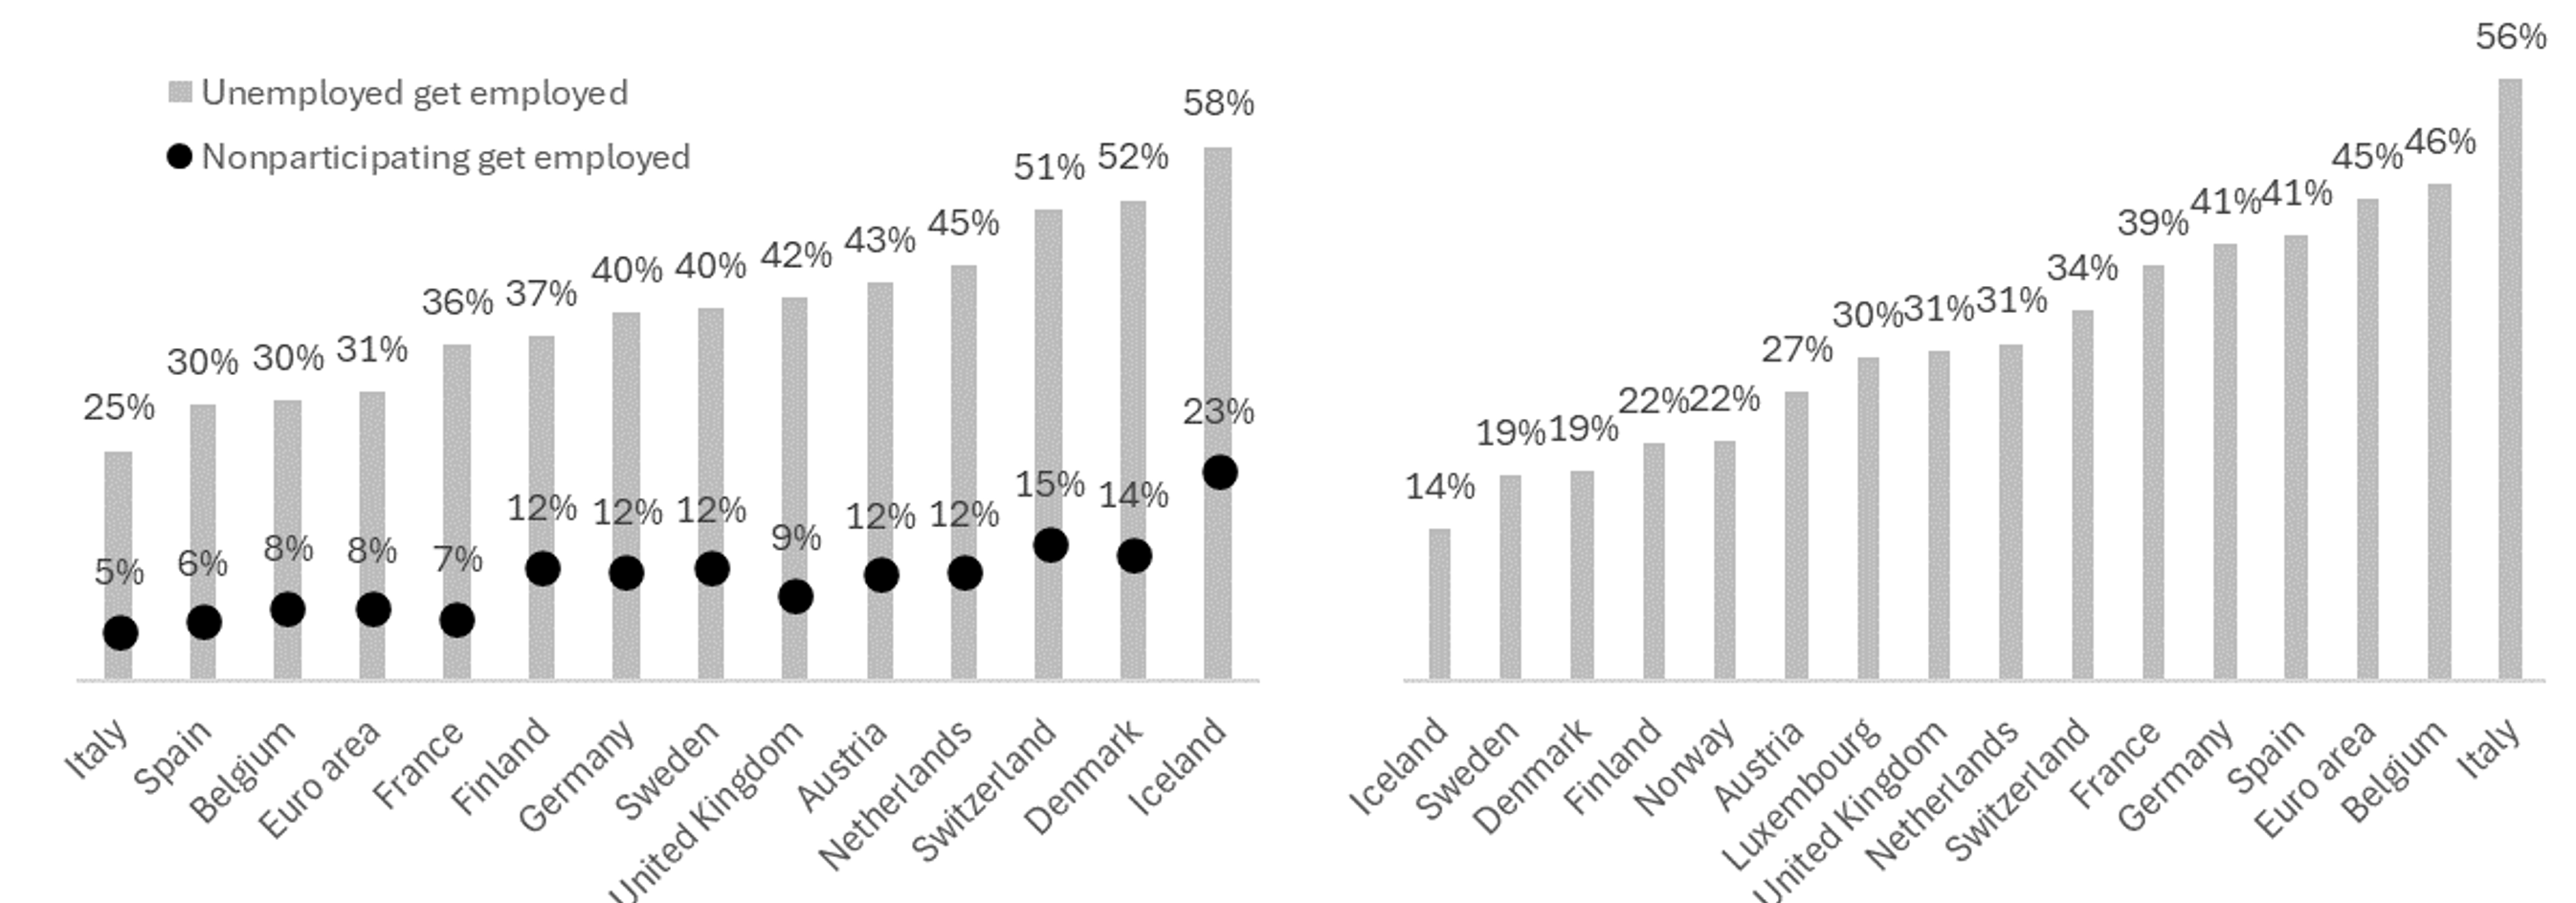
Figure 6.1. Annual transition from unemployment and nonparticipation to employment, average 2011–2023 (left); share of unemployed who remain unemployed for 12 months or longer, average 2009–2023 (right).
Source: Left: Eurostat (n.d.a); right: Eurostat (n.d.b).
Source: Left: Eurostat (n.d.a); right: Eurostat (n.d.b).
In a perfectly competitive labour market, neither labour shortages nor unemployment would exist, as wages would simply adjust until both disappeared. This, however, is not a satisfactory analytical starting point for the labour market. Instead, a widely used approach in labour economics is ‘search and matching’ theory, which is based on the idea that hirings are the outcome of a successful match between a vacant job and a worker looking for such a job. Thus, the more vacant jobs and more workers looking for a job there are, the more matchings will result. This relationship results in a Beveridge curve, which for Europe shows a negative relationship between job vacancies (Figure 2). The further the Beveridge curve extends towards the upper-right quadrant, the less efficient the labour market, as more vacancies are needed for a worker to get a job. An economy moves along the Beveridge curve over the course of a business cycle: during an expansion, vacancies increase relative to unemployment, with the opposite holding true for a contraction.
Over the period 2019–2023, there were large movements along the Beveridge curve in Iceland (see Figure 2). In particular, the impact of the Covid-19 pandemic was substantial due to tourism’s large share of Iceland’s labour market, meaning both the economic contraction and subsequent upswing were greater in Iceland than in many other European countries. More specifically, unemployment was high and vacancy rates low during the downturn, a situation that reversed during the upswing. During these large swings, Iceland’s Beveridge curve remained close to both axes. In other words, unemployment was low in relation to any given vacancy rate, meaning labour market matchings remained efficient throughout this turbulent period. This is in accordance with the fast transitions from unemployment to employment generally seen in Iceland. The underlying causes of Iceland’s matching efficiency (low mismatch between available vacancies and unemployed) are, however, not fully clear. Relevant factors include labour mobility, a lenient legal framework, the small size of the country, work ethic, and gender equality leading to high female employment rates (Hall & Zoega 2014).
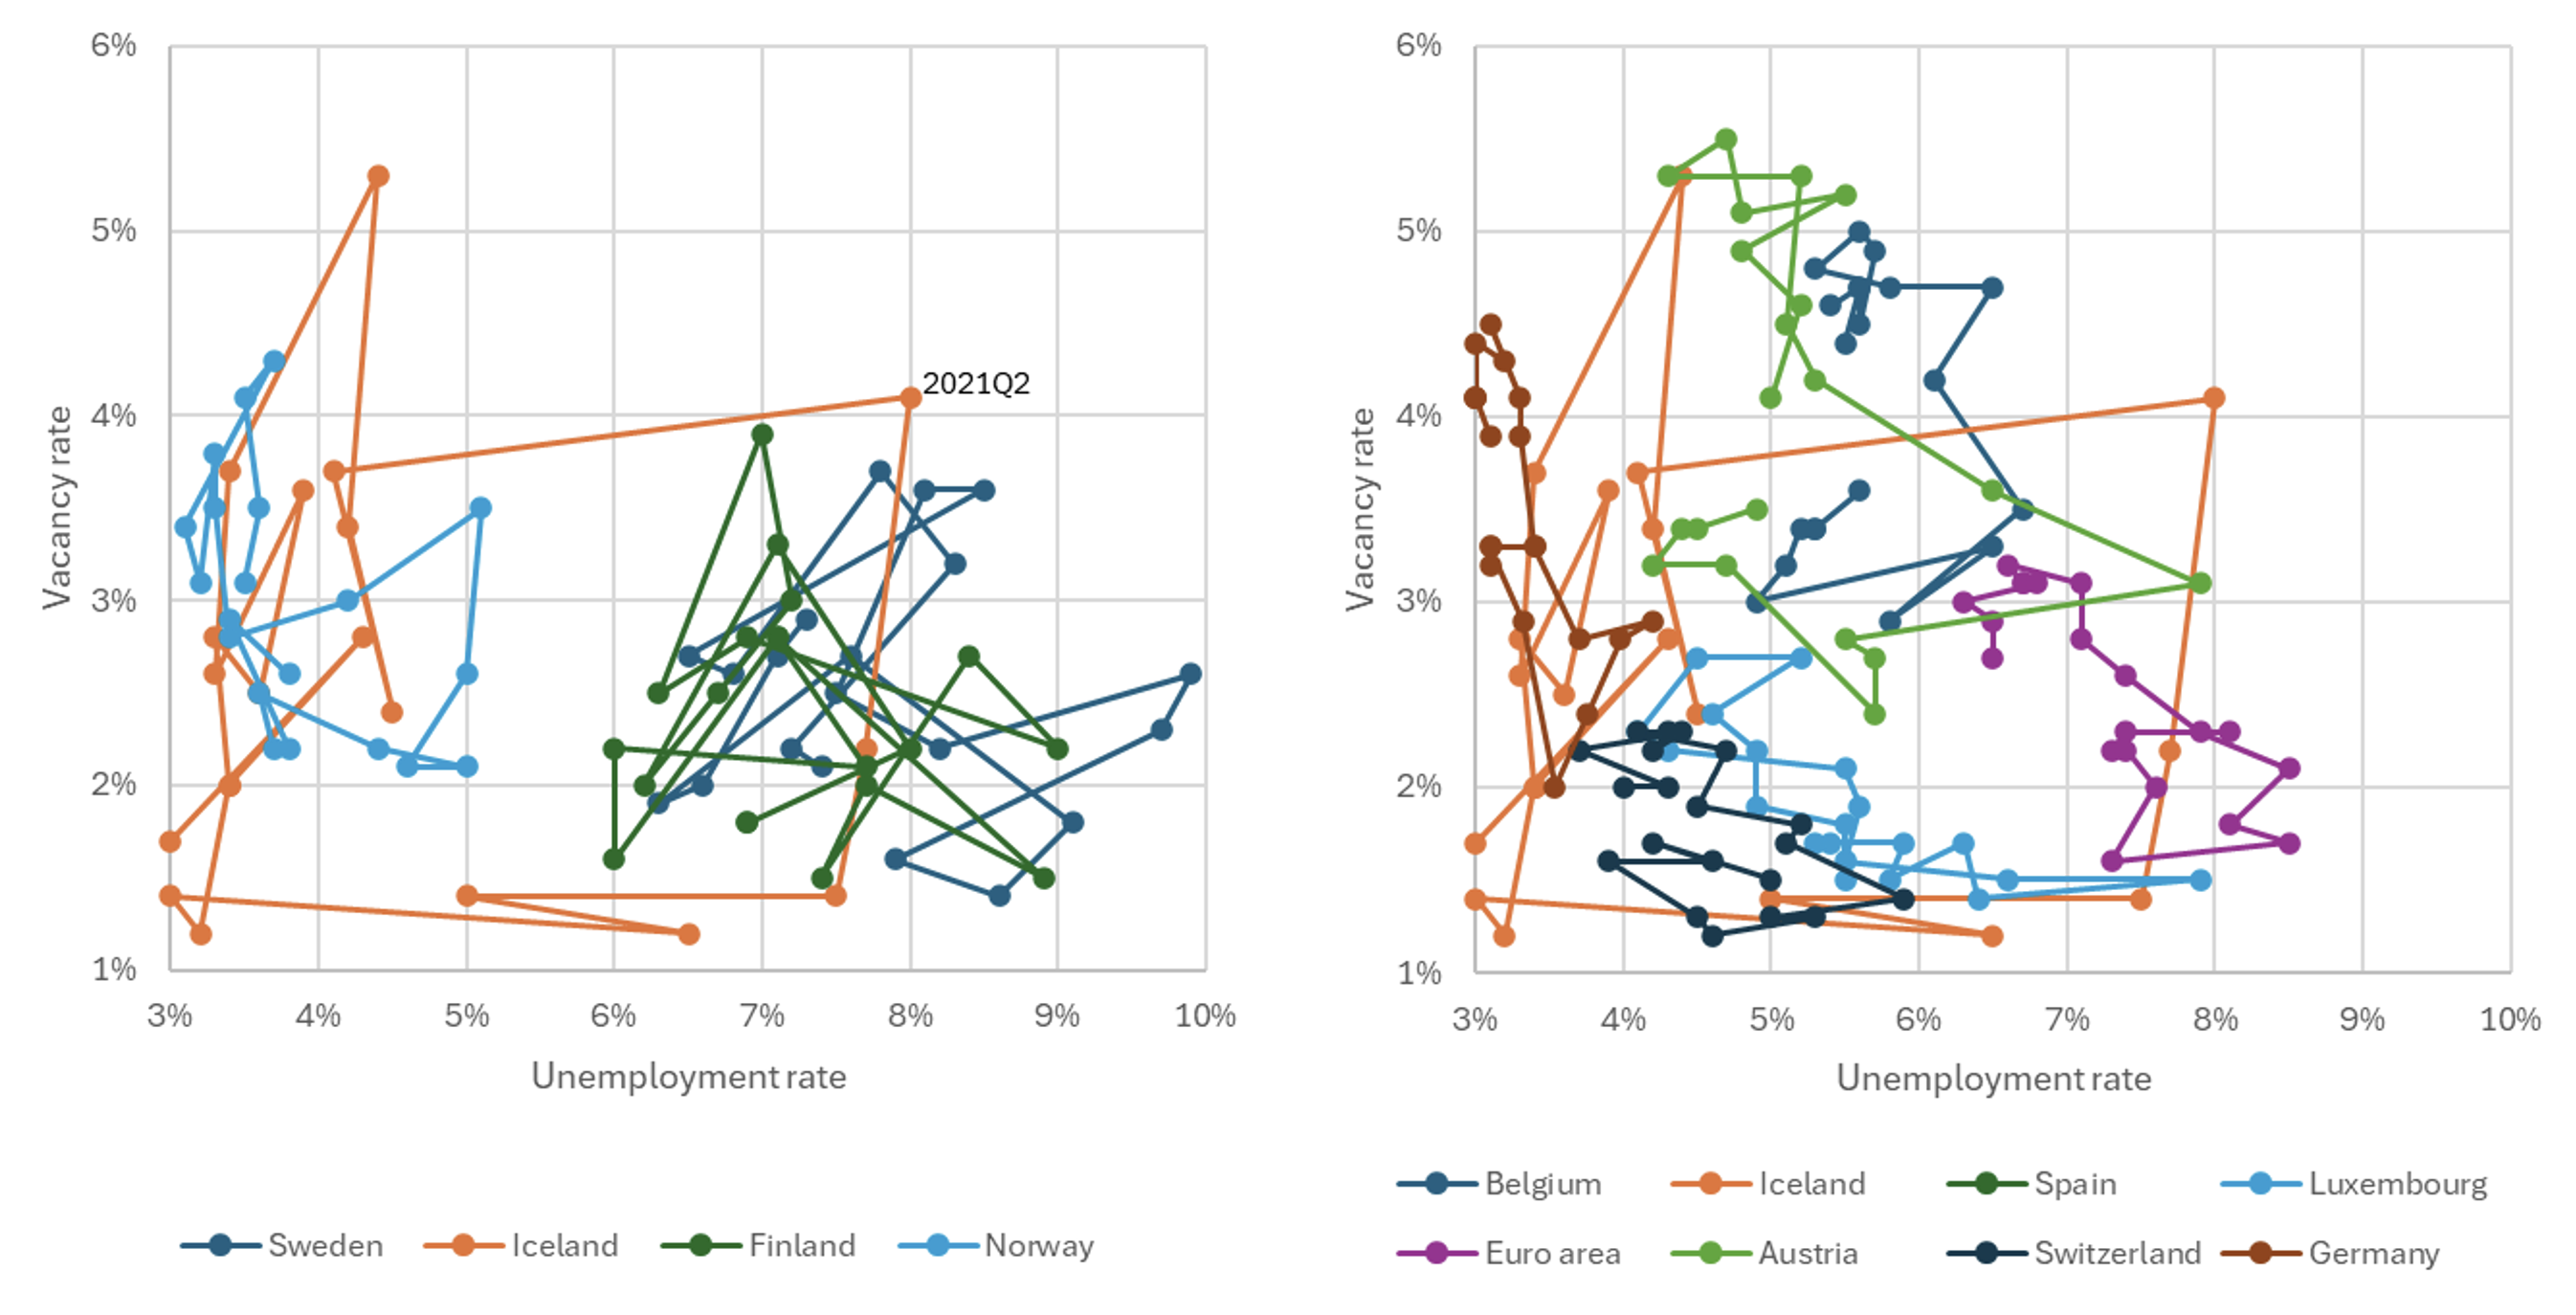
Figure 6.2. Comparison of Beveridge curve across European countries, 2019–2023.
Source: Eurostat (n.d.c) and Eurostat (n.d.d).
Source: Eurostat (n.d.c) and Eurostat (n.d.d).
A labour shortage means there is excess demand for labour (i.e. vacancies are high relative to unemployment). As such, a widely used labour shortage indicator is the ratio of vacancies relative to unemployment (Causa et al. 2022). According to this measure, labour shortages in Iceland have been at a comparable level to Norway, and higher than in Sweden and Finland (see Figure 6.3). The measure also suggests that labour shortages are neither particularly high nor particularly low in Iceland.
Another labour shortage measure relies on regular questionnaires asking managers if they believe there is a shortage of employees. In the first quarter of 2024, 37% of managers believed there was a shortage of employees. In recent years, the percentages provided by this measure have been somewhat higher compared to earlier upswings (Central Bank of Iceland n.d.). When asked about where the greatest shortfall in staff is to be found, 60% of managers referred to workers involved in crafts and related trades (Federation of Icelandic Industries 2024). Meanwhile, a recent Minister of Health working group report flags a lack of health and social care employees in some rural areas (Ministry of Health 2023).
It should be noted that the job vacancy-to-unemployment ratio does not measure movement along the Beveridge curve, nor, in principle, labour market efficiency. For example, Germany and Switzerland appear to have similar levels of labour market efficiency, but Germany faces much higher labour shortages.
While the concept of labour shortages is bound up with business cycles, there are substantial differences between countries in terms of job vacancy-to-unemployment ratios over longer periods of time. In other words, labour shortages can be both structural and related to business cycle fluctuations, with the first of these two drivers of primary interest in the context of this chapter.
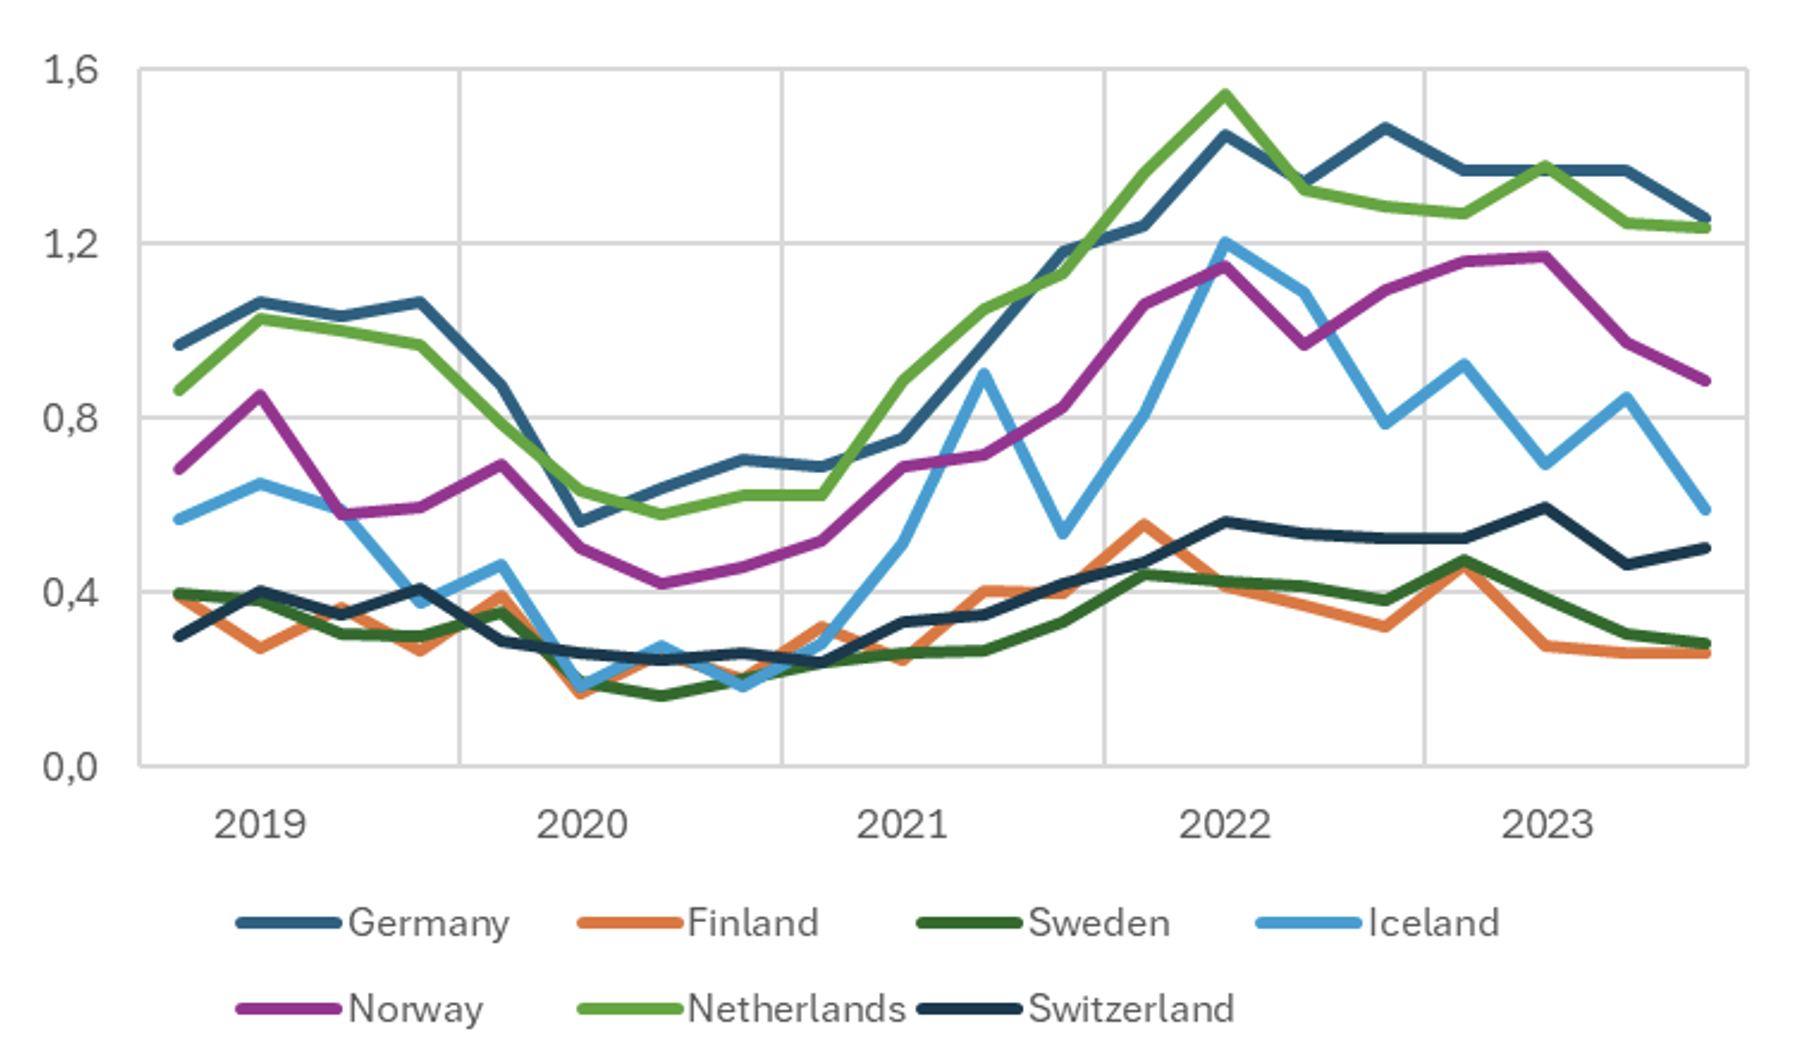
Figure 6.3. Job vacancy-to-unemployment ratio.
Sources: Eurostat (n.d.c) and Eurostat (n.d.d).
Sources: Eurostat (n.d.c) and Eurostat (n.d.d).
Regional development
Iceland in the 20th century was characterised by high population growth and the rapid expansion of the Capital Region, driven by both high fertility and internal migration. The current century has, however, seen lower fertility rates and a substantial increase in immigration (Bjarnason & Garðarsdóttir 2022). Here, immigrants are defined as individuals not born in Iceland.
The share of immigrants in the Icelandic population remained around or below 5% throughout the 20th century, before rising steeply from 5.3% in 2000 to 21.3% in 2024. The majority of this growth has taken place over the past ten or so years, and while the current share of immigrants in Iceland is not particularly high, the rate of increase is significant. In total, roughly half of Iceland’s population growth since the turn of the century is attributable to immigrants.
Although Iceland is not a member of the European Union (EU), it has been a member of the European Economic Area since 1994, which enables free movement of labour. In 2004, a number of Eastern European countries joined the EU. Following this, from 2011 onwards, Iceland experienced considerable increases in labour demand, accompanied in turn by a significant influx of migrants. Since the turn of the century, differences in immigration patterns have seen the Capital Region experience higher population growth compared to the countryside, where such growth is very heterogeneous.
Immigration is usually driven by job opportunities, meaning immigrants tend to be of working age – over half of Iceland’s foreign residents are 20–40 years old (Bjarnason & Karlsson 2022). This affects the population pyramid, reducing the average age. Moreover, relative to the country’s overall population, immigrants are more likely to work in the industrial, building and fishing sectors, and less likely to work in service sectors other than tourism and the public sector.
Employment growth over recent decades has mainly been driven by the tourism sector, particularly in the countryside – in many regions, the sector accounts for 40–50% of employment growth. Differences in population growth by region are largely explained by immigration from abroad, with a likely explanation being that labour demand has varied between regions. Areas with smaller growth have fewer immigrants and have experienced larger increases in average age, as immigrants tend to lower the average age (Table 2). Two regions in Iceland – the North-west and the Westfjords – experienced population decline over the period in question. Although their respective populations fell until 2016, however, this trend has at least in part been reversed since then.
Share of population | Growth 1998-2024 | Average age 1998 | Average age 2024 | Share immigrants 2023 | |
Capital Region | 64% | 48% | 34.1 | 38.2 | 21% |
East | 3% | 11% | 34.0 | 39.1 | 12% |
North-east | 8% | 11% | 33.8 | 39.4 | 11% |
North-west | 2% | -12% | 34.5 | 40.3 | 3% |
South | 9% | 48% | 33.3 | 38.3 | 17% |
Southern Peninsula | 8% | 97% | 31.8 | 36.8 | 33% |
Westfjords | 2% | -16% | 32.5 | 39.9 | 25% |
Westland | 5% | 25% | 33.7 | 39.0 | 16% |
Total | 100% | 41% | 33.8 | 38.3 | 20% |
Table 6.2. Population statistics by region.
Source: Statistics Iceland (n.d.b).
As in most countries, there are regional differences in mean income across Iceland. The East and the Capital Region boast the highest average earnings, while the North-west has the lowest, with earnings 22% lower than in the East. Although Iceland’s regional differences in average production are among the lowest in Europe (Byggðastofnun 2020), the differences in earnings between the Capital Region and the country’s other areas have increased since 1990, as shown in Figure 4.
The share of employees in service sector jobs (e.g. the information, communication and financial sectors) is substantially higher in the Capital Region compared to the countryside. Wholesale and retail jobs also have a higher share of employment in the Capital Region (see Figure 6.4).
The countryside, by contrast, is characterised by a higher proportion of employees working in industry, fishing and agriculture. When it comes to tourism, the share seen in urban and rural regions is roughly equal, although this masks significant heterogeneity across countryside areas, with tourism particularly prominent in the South, Southern Peninsula and North-east. The aluminium production sector, meanwhile, is relatively prominent in the East and West, with fishing relatively large in the Westfjords and the West (Byggðastofnun n.d.a).
Developments in Iceland’s main export sectors – fishing, aluminium and tourism – are crucial when it comes to explaining regional dynamics. The fishing industry underwent significant changes in 1990 when the quota system was implemented in its current form. Quotas are allocated to vessels based on their historical catch shares and, from 1990, could be bought and sold. This led to a relocation of landing ports, which had been stable for many years – for example, the Westfjords’s share of the total quota landed decreased after 1990.
The aluminium industry experienced significant milestones in 1997 and 2007, when aluminium plants began production in the West and East, respectively. Partly as a result of this, employment in manufacturing is substantial in these regions, with tangible impacts on population growth in the East. Prior to the construction of the aluminium plants, the region’s population had experienced a steady decline.
Finally, tourism is most pronounced in the South, Southern Peninsula and North-east, with the highest growth seen in the former two regions, where most if not all tourists visit. These two regions also experienced high population growth, particularly in 2005–2009 and 2016–2024. The Southern Peninsula has the highest share of immigrants. Tourism is also very pronounced in the Capital Region, where the share of employees in the sector is only 1.3% lower compared to the countryside.
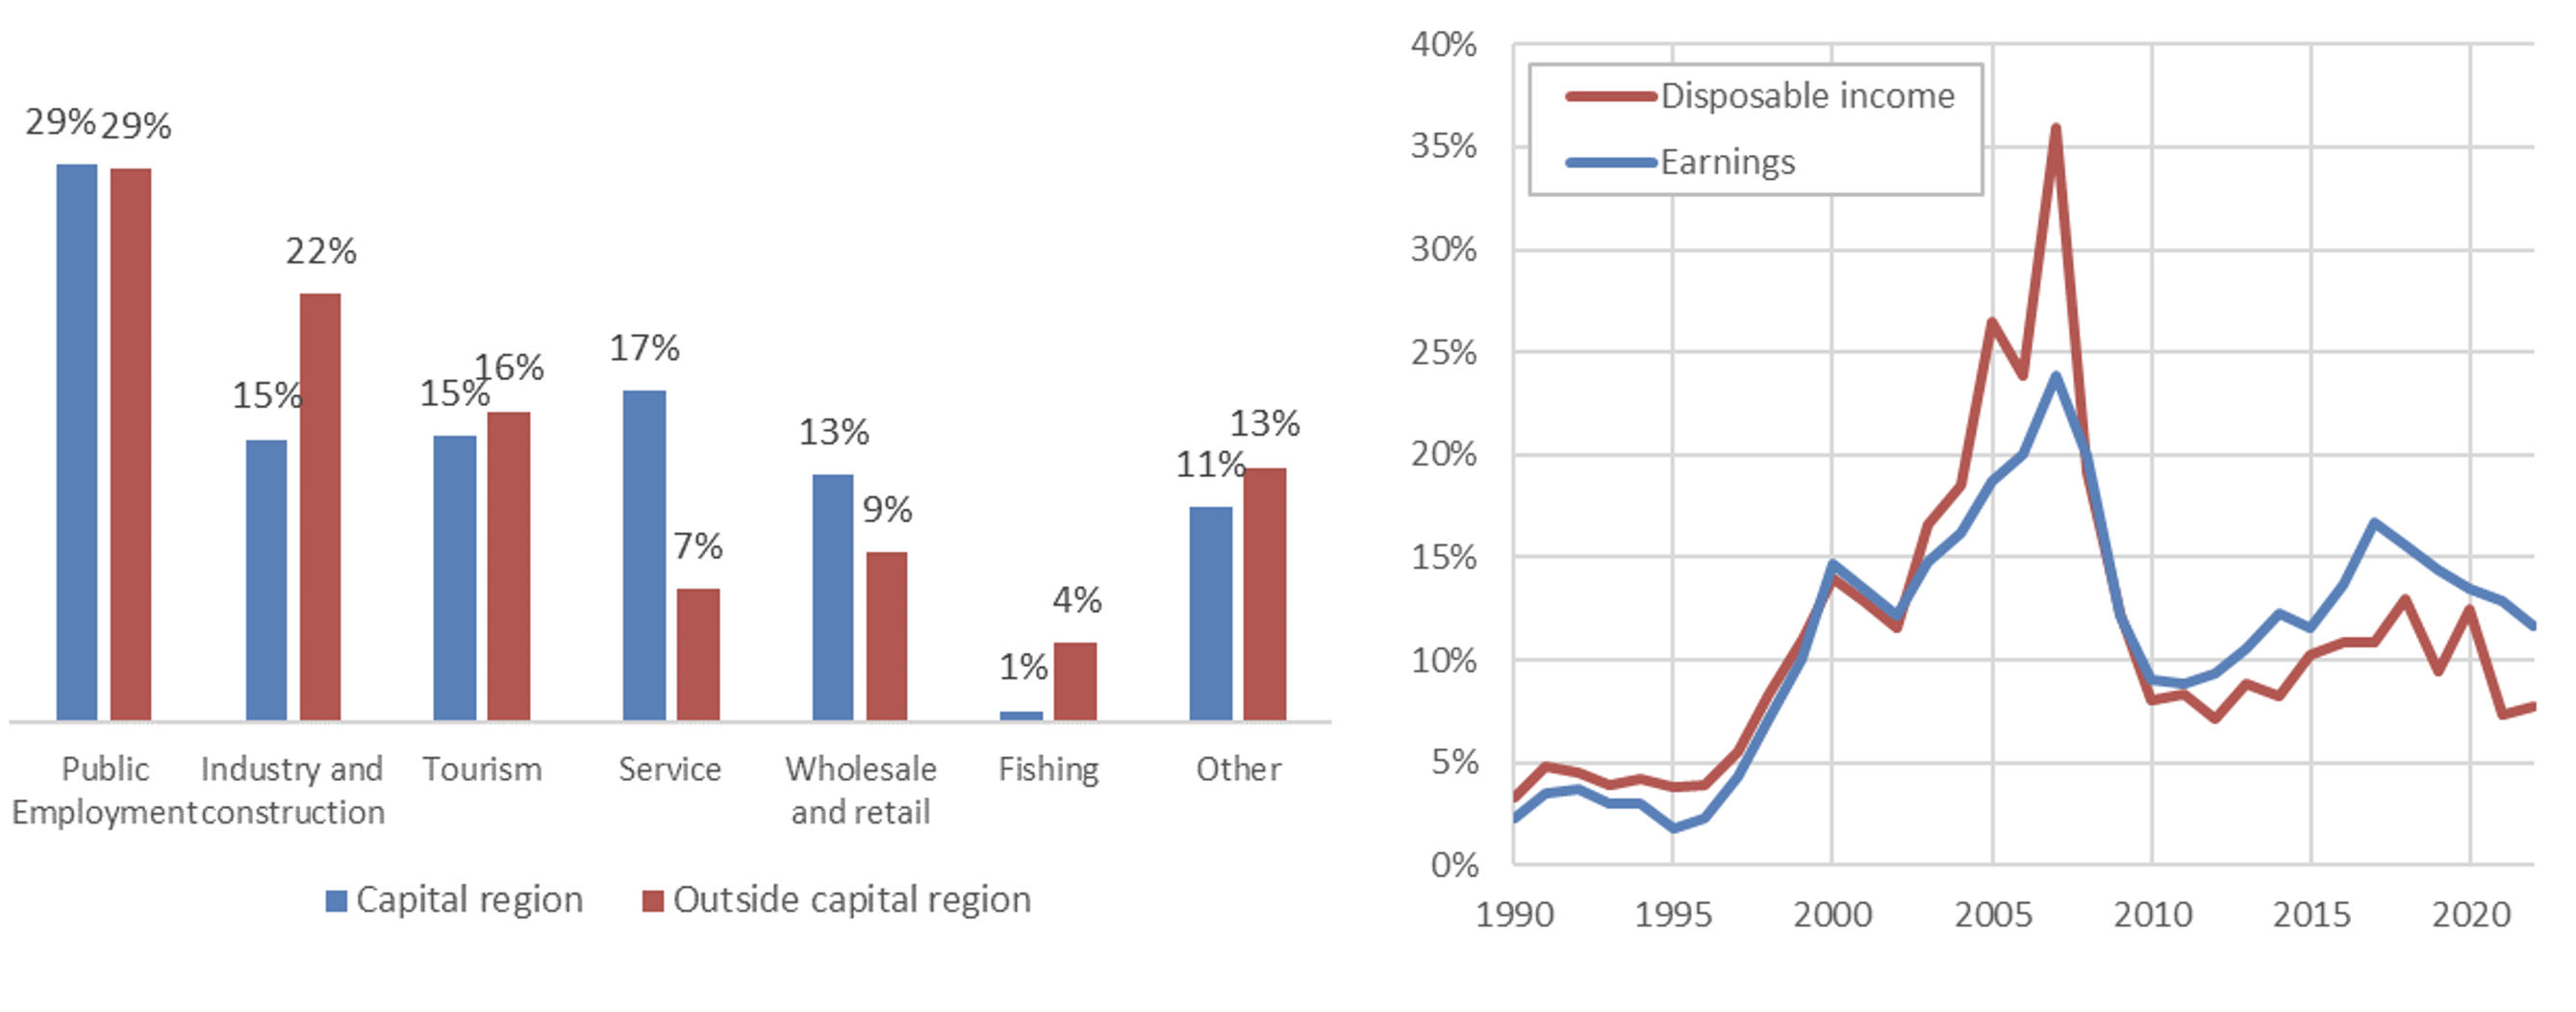
Figure 6.4. Share of employees by region (left); mean income difference between Capital Region and elsewhere (right).
Source: Left: Statistics Iceland (n.d.c); right: Statistics Iceland (n.d.d).
Source: Left: Statistics Iceland (n.d.c); right: Statistics Iceland (n.d.d).
Until the 2008 financial crisis, regional differences in unemployment were relatively stable, with the disparity between the highest and lowest regional unemployment rates fluctuating around the 2 percentage point mark. Although unemployment increased everywhere following the financial crisis, some regions experienced much greater rises than others, as shown in Figure 6.5. Surprisingly, those regions with the lowest unemployment rates were also those that experienced the lowest population growth. Here, a likely explanation is that poor job prospects led to emigration or reduced immigration.
The Westfjords – the region that saw the largest population decline over the period 1998–2024 (see Table 6.2) – has exhibited a relatively low, stable unemployment rate. By contrast, the Southern Peninsula – which saw the most rapid population growth over the same period – has experienced higher, more volatile unemployment rates. Labour mobility therefore appears to contribute to the Icelandic labour market’s efficiency.
Granger causality tests indicate that unemployment causes population development, rather than in the opposite direction. Granger causality measures which variable increases first, thereby indicating whether a relationship is causal.
Data on vacancies by region only covers positions registered at the Directorate of Labour, and so does not cover all vacant positions. As such, the data for all vacancies used to create Figure 6.2 is based on estimations. With this limitation in mind, Figure 6.6 presents Beveridge curves for the Capital Region and the countryside using monthly data. Although this data is more volatile, these curves indicate that the countryside has a somewhat more efficient labour market than the Capital Region (i.e. less unemployment for a given number of vacancies), the difference is not large.
Finally, labour shortages, estimated by vacancy-to-unemployment ratio, are somewhat higher outside the Capital Region than within it (see Figure 5). Again, however, the difference is not large.
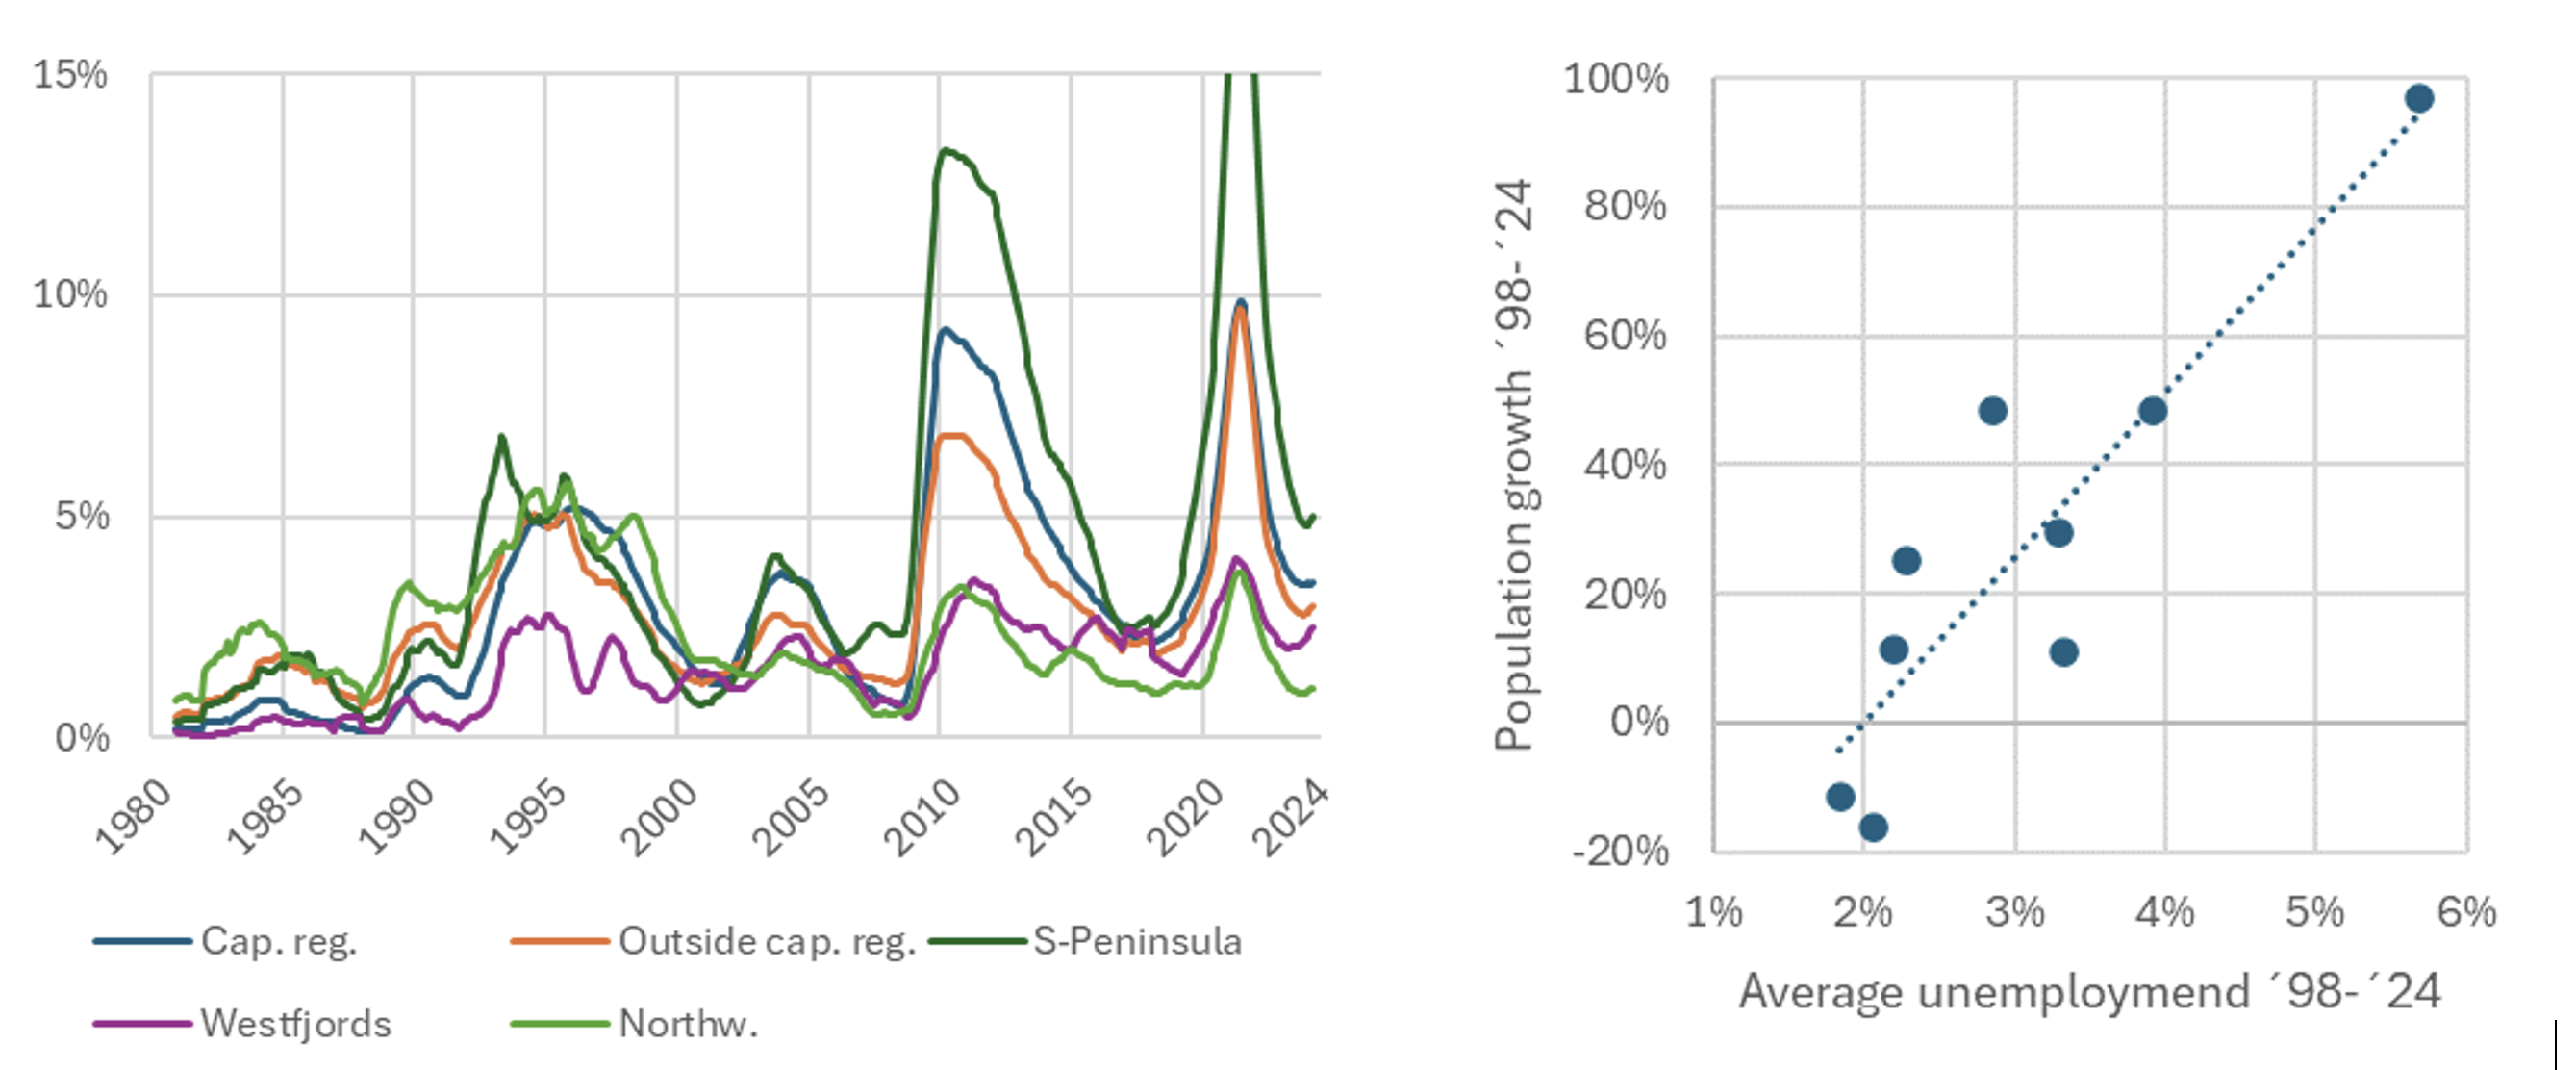
Figure 6.5. Unemployment in selected region, 12-month rolling average (left); relationship between unemployment and population by region (right).
Source: Left: Directorate of Labour; right: Directorate of Labour and Statistics Iceland (n.b.b).
Source: Left: Directorate of Labour; right: Directorate of Labour and Statistics Iceland (n.b.b).
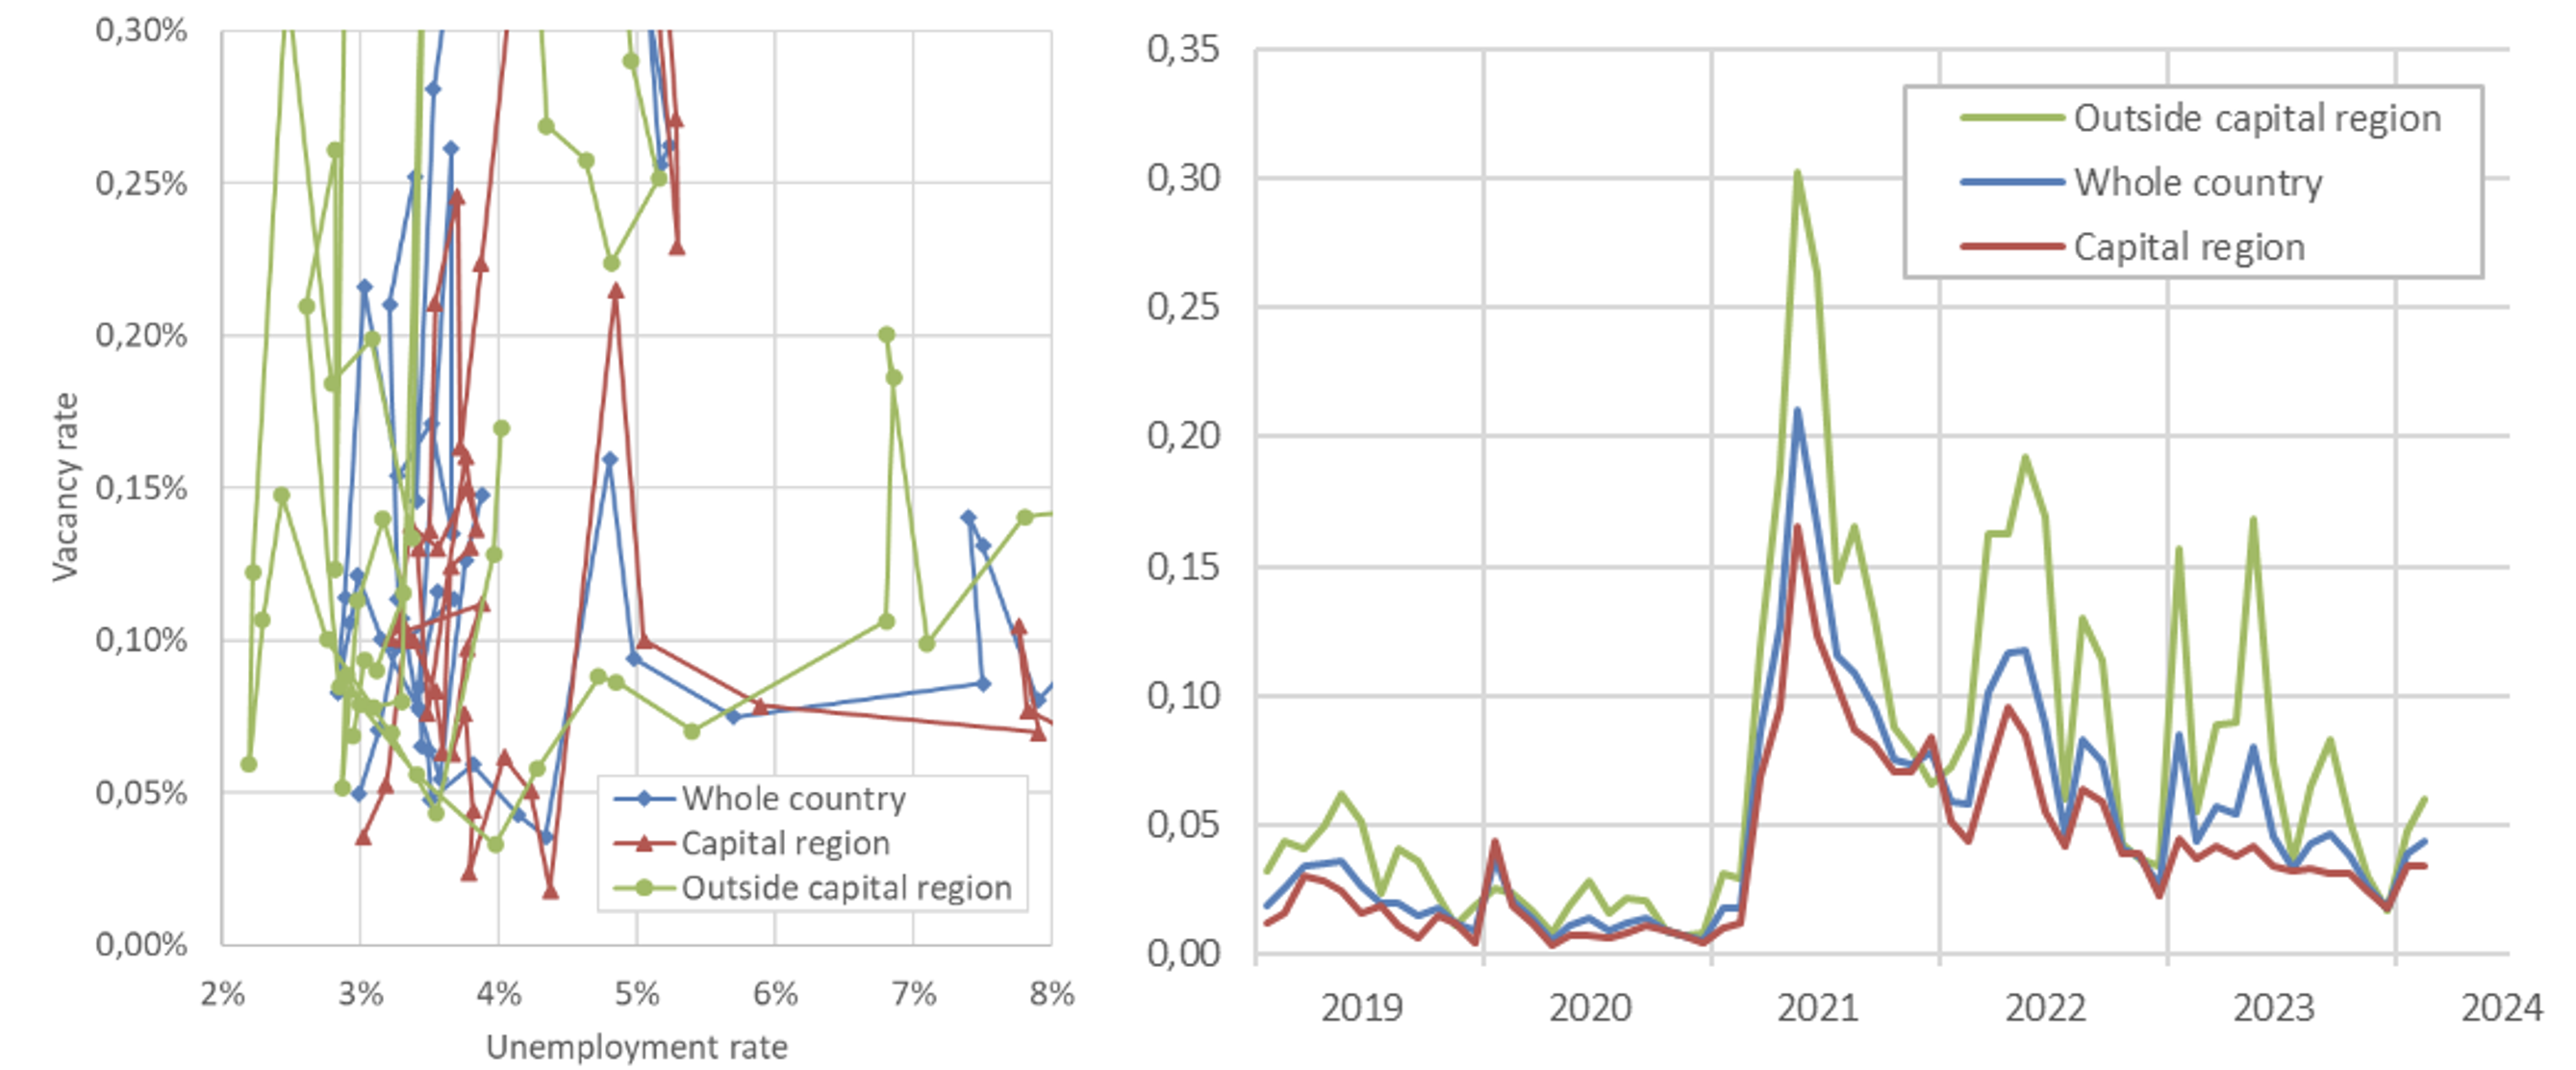
Figure 6.6. Beveridge curve (left) and vacancy-to-unemployment ratio (right) by region 2019–2023.
Source: Directorate of Labour.
Source: Directorate of Labour.
In conclusion, labour mobility between regions, together with immigration, appears to have been effective in matching Iceland’s labour demand. Overall, people have moved to those areas with the greatest job prospects, with the Southern Peninsula a prime example of this trend. Thus, regional problems are mostly related to poor job prospects rather than labour shortages.
Regional policies
Iceland has various policies aimed at strengthening rural areas. For the most part, however, such measures are designed to increase employment opportunities in rural areas, rather than address labour shortages.
The Icelandic parliament’s 15-year regional plan for 2022–2036 focuses on enhancing infrastructure and public services across the country, with the overall objective of ensuring equal access and fostering sustainable communities. The plan contains numerous actions designed to boost employment, support demographic challenges and promote balanced regional development. It also includes a strategy for moving government jobs from the Capital Region, which currently hosts a disproportionate number of such positions, to other areas.
The Icelandic Regional Development Institute (‘Byggðastofnun’ in Icelandic) is an independent state-owned institute tasked with encouraging settlement and economic development in rural areas. Its remit includes a particular focus on ensuring equal access to employment and housing for all residents (Byggðastofnun n.d.b). Byggðastofnun, among other things, gives out loans to boost regional employment, provides consultancy services and monitors regional settlement trends. It also runs an initiative called ‘Fragile Communities’, which is supposed to boost local economies and infrastructure.
The transition from public investment fund-based loans to a market-driven quota system in 1990 transformed the Icelandic fisheries sector. While the new system enhanced efficiency, it led to shifts in port activities and recued employment in some areas (Hall et al. 2002). Targeted community and by-catch quotas have now been introduced to address these socioeconomic challenges and stabilise vulnerable rural economies. In practical terms, however, they only represent a modest adjustment within the broader quota framework (Ministry of Food, Agriculture and Fisheries 2023).
The establishment of aluminium industries in Iceland, especially in the rural East and West regions, has significantly influenced local development and employment. These industries have created numerous job opportunities and played a central role in the development of infrastructure and energy resources, in turn supporting broader economic growth. Although the policies introduced to assist Iceland’s aluminium sector may not primarily have been intended as regional policies, they have nevertheless supported the local development of certain regions (Institute of Economic Studies 2009).
Concluding remarks
As has been discussed, Iceland’s Beveridge curve indicates that the country experiences efficient labour market matching – that is, relatively few vacancies are needed for an unemployed individual to get a job. This can likely be attributed to labour mobility, particularly immigration, with people moving to areas with high labour demand and away from areas with low labour demand. As such, labour shortages do not appear to be significant in either the Capital Region or the countryside.
While it is difficult to state exactly why people immigrate to Iceland, immigration in general is largely driven by job opportunities. Given migrants from Eastern Europe constitute the bulk of those coming to Iceland, it seems likely that the country’s high labour demand and wages have contributed to the increased immigration seen in recent years.
Over the past decade, increased labour demand has mainly been seen in Iceland’s tourism and construction sectors, particularly in the countryside. Going forward, other sectors may experience increased labour demand, with the degree to which immigration will meet those demands as yet unclear.
References
Bjarnason, Þ. & Garðarsdóttir, Ó. (2022). ‘Mannfjöldaþróun á Íslandi’. In: Bjarnason, Þ. (ed.), Byggðastefna og búferlaflutningar á Íslandi. Reykjavík: Háskólaútgáfan.
Bjarnason, Þ. & Karlsson, V. (2022). ‘Atvinna og búferlaflutningar’. In: Bjarnason, Þ. (ed.), Byggðastefna og búferlaflutningar á Íslandi. Reykjavík: Háskólaútgáfan.
Borjas, G. J. (2024). Labor Economics. McGraw-Hill Education Press.
Byggðastofnun (Icelandic Regional Development Institute) (2020). ‘Hagvöxtur landshluta 2012–2019’. https://ioes.hi.is/sites/ioes.hi.is/files/2021-12/Hagv%C3%B6xtur_landshluta_2012_2019_lok.pdf.
Byggðastofnun (n.d.a). ‘Tekjur einstaklinga eftir svæðum 2008–2022’. www.byggdastofnun.is/is/utgefid-efni/maelabord/tekjur.
Byggðastofnun (n.d.b). ‘About Byggðastofnun’. https://www.byggdastofnun.is/en.
Causa, O. et al. (2022). ‘The post-COVID-19 rise in labour shortages’. OECD Economics Department Working Papers No. 1721. OECD Publishing. https://doi.org/10.1787/e60c2d1c-en.
Central Bank of Iceland (n.d.). ‘Economic Indicators’. Monthly Economic Indicators available from: https://www.cb.is/publications/publications/publications-all-archive/?all=1.
Davis, S., Faberman, J. & Haltiwanger, J. (2012). ‘Recruiting intensity during and after the Great Recession: National and industry evidence’. American Economic Review 102(3): 584–588.
Eurostat (n.d.a). ‘Labour market transitions – annual data’. https://ec.europa.eu/eurostat/databrowser/product/page/lfsi_long_a__custom_11055192.
Eurostat (n.d.b). ‘Long-term unemployment (12 months or more) as a percentage of the total unemployment, by sex, age and citizenship (%)’. https://ec.europa.eu/eurostat/databrowser/product/page/lfsa_upgan__custom_11068480.
Eurostat (n.d.c). ‘Unemployment rates by sex, age and citizenship (%)’. https://ec.europa.eu/eurostat/databrowser/view/lfsq_urgan/default/table?lang=en.
Eurostat (n.d.d). ‘Job vacancy statistics by NACE Rev. 2 activity - quarterly data (from 2001 onwards)’. https://data.europa.eu/data/datasets/aabtuygsf5y5cznd2h29qg?locale=en.
Federation of Icelandic Industries (2024). ‘Stjórnendur iðnfyrirtækja bjartsýnni á þróun efnahagsmála’. 24 April. www.si.is/media/_eplica-uppsetning/Greining-SI_Stjornendur-idnfyrirtaekja-bjartsynni-a-throun-efnahagsmala_24-04-2024.pdf.
Hall, A., Jónsson, Á. & Sigurðsson, S. (2002). Byggðir og búseta: Þéttbýlismyndun á Íslandi. Reykjavík: Hagfræðistofnun Háskóla Íslands. https://rafhladan.is/bitstream/handle/10802/5089/Byggdir_og_buseta.pdf?sequence=1.
Hall, A. & Zoega, G. (2014). ‘Values and labor force participation in the Nordic countries’. Economics 8(2014-41): 1–43.
Haltiwanger, J., Scarpetta, S. & Schweiger, H. (2010). ‘Cross country differences in job reallocation: The role of industry, firm size and regulations’. EBRD Working Paper No. 116. European Bank for Reconstruction and Development. www.ebrd.com/downloads/research/economics/workingpapers/wp0116.pdf.
Institute of Economic Studies (2009). ‘Áhrif stóriðjuframkvæmda á íslenskt efnahagslíf’. www.stjornarradid.is/media/atvinnuvegaraduneyti-media/media/Rafraen_afgreidsla/2009-07-ahrif-storidjuframkvaemda-isl-efnahagslif.pdf.
Keynes, J. M. (1930) [2008]. ‘Economic possibilities for our grandchildren’. In: Pecchi, L. and Piga, G. (eds), Revisiting Keynes: Economic Possibilities for Our Grandchildren. Cambridge, MA: MIT Press.
Ministry of Food, Agriculture and Fisheries (2023). Auðlindin okkar: Sjálfbær sjávarútvegur. Reykjavik: Ministry of Food, Agriculture and Fisheries. www.stjornarradid.is/library/01--Frettatengt---myndir-og-skrar/MAR/Fylgiskjol/230819%20Matvaelaraduneytid%20Audlindin%20okkar%20Rit%201%20WEB.pdf.
Ministry of Health (2023). ‘Tillögur starfshóps heilbrigðisráðherra til jöfnunar á aðgengi að sérfræðiþjónustu á heilbrigðissviði óháð búsetu’. www.stjornarradid.is/library/04-Raduneytin/Heilbrigdisraduneytid/ymsar-skrar/Till%c3%b6gur%20starfsh%c3%b3ps_%c3%advilnanir%20n%c3%a1msl%c3%a1na_2023.pdf.
OECD (2018). Employment Outlook 2018. OECD: Paris. www.oecd-ilibrary.org/employment/oecd-employment-outlook-2018_empl_outlook-2018-en.
OECD (n.d.a). ‘Productivity levels’. Applied filters: https://tinyurl.com/s5u7wnzc.
OECD (n.d.b). ‘NAAG Chapter 1: GDP’. Applied filters: https://tinyurl.com/4cyprjpw.
OECD (n.d.c). ‘Employment rate’. Applied filters: https://tinyurl.com/ymcbrhb7.
OECD (n.d.d). ‘Decile ratios of gross earnings’. Applied filters: https://tinyurl.com/47jyr5ec.
OECD (n.d.e). ‘Public and private social expenditure’. Applied filters: https://tinyurl.com/2myjyrf2.
OECD (n.d.f). ‘Income distribution database’. Applied filters: https://tinyurl.com/22kz4mx7.
OECD (n.d.g). ‘Eurostat harmonised index of consumer prices (HICP)’. Applied filters: https://tinyurl.com/39jeheux.
OECD (n.d.h). ‘NAAG Chapter 1: GDP’. Applied filters: https://tinyurl.com/ycz3dce9.
OECD (n.d.i). ‘Trade union density’. Applied filters: https://tinyurl.com/yc8ev64h.
Ólafsdóttir, K. & Olafsson, S. (2014). Economy, Politics and Welfare in Iceland: Booms, Busts and Challenges. NordMod2030. Sub-report 4. Oslo: Fafo.
Statistics Iceland (n.d.a). ‘Vinnumarkaður’. https://sogulegar.hagstofa.is/vinnumarkadur/.
Statistics Iceland (n.d.b). ‘Population by regions, sex and age 1 January 1998-2024’. https://px.hagstofa.is/pxen/pxweb/en/Ibuar/Ibuar__mannfjoldi__2_byggdir__Byggdakjarnarhverfi/MAN03250.px.
Statistics Iceland (n.d.c). ‘Employed persons in main and second job by economic activity, sex and region 1991-2023’. https://px.hagstofa.is/pxen/pxweb/en/Samfelag/Samfelag__vinnumarkadur__vinnumarkadsrannsokn__3_arstolur/VIN01110.px.
Statistics Iceland (n.d.d). ‘Income by municipalities and sex 1990-2023 - Division into municipalities as of 1st of January 2024’. https://px.hagstofa.is/pxen/pxweb/en/Samfelag/Samfelag__launogtekjur__3_tekjur__1_tekjur_skattframtol/TEK01002.px.