3. Sustainable labour markets – labour market participation in the Nordic Region
SUNREM definition of sustainable labour markets
High labour market participation is not only a fundamental prerequisite for the Nordic model but also a key characteristic of a sustainable labour market. The initial literature overview conducted in the SUNREM project examined research on sustainable labour market participation.
First, a critical aspect of sustainable labour market participation involves maintaining a balance between job supply and demand within the local labour market. According to the ILO (2015), this balance is essential to ensure that a significant proportion of the working-age population is actively engaged in the labour market, either through employment or job-seeking. It also serves as an indicator of the available labour force contributing to the production of goods and services.
Second, the ILO (2018) emphasises the importance of both the ability and willingness to work, encompassing factors such as fair wages, reasonable working hours, workplace safety, health protection, the eradication of child labour and the provision of equal treatment for all workers. This aligns with Goal 8 of the Sustainable Development Goals on Decent Work, which seeks to "promote sustained, inclusive and sustainable economic growth, full and productive employment and decent work for all" (ILO, 2018). The decent work agenda includes rights at work, including social dialogue, and quality of work.
Third, a sustainable labour market should consist of high-quality jobs.
Based on the literature overview and the key dimensions outlined, the SUNREM project conceptualises sustainable labour market participation as encompassing a balance between job supply and demand, the provision of high-quality jobs and decent work, both in the present and the future.
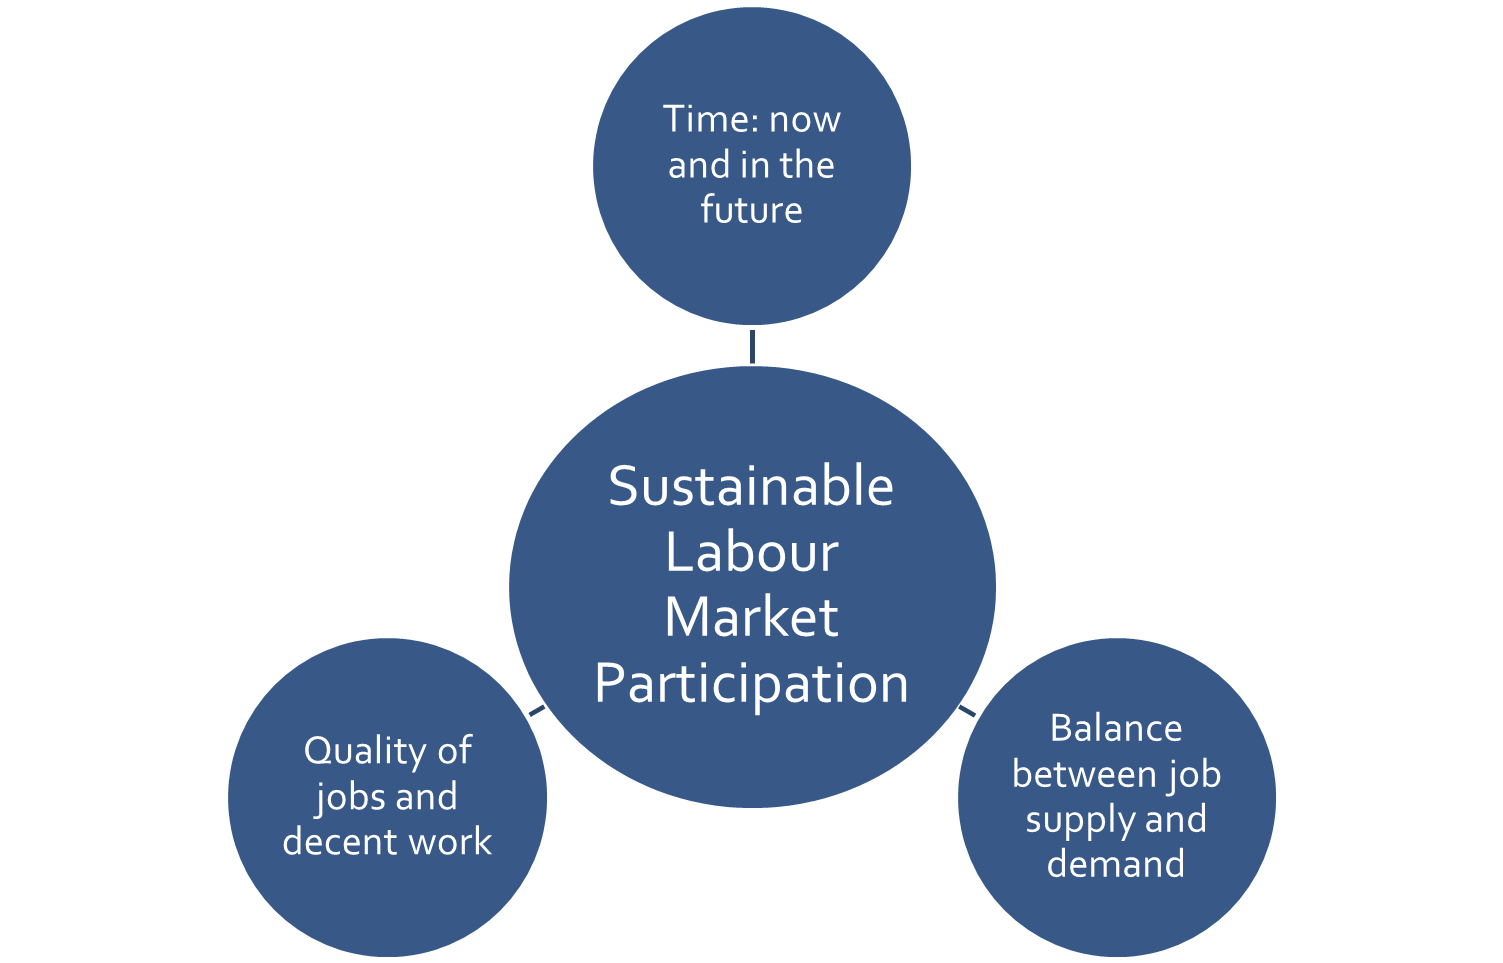
Figure 5. Conceptualisation of sustainable labour market participation (authors’ work, 2024).
The following sections of this paper examine the performance of the Nordic Region in relation to these key dimensions and features. It begins by analysing employment trends in the region, including how employment has evolved in recent years, before exploring unemployment and persons outside the labour force.
The balance between job supply and demand, a core aspect of sustainable labour market participation, will be partially addressed in this paper. However, this theme will be explored in greater depth in dashboards that provide insights into the economic structure and labour market dynamics of the case study areas. The quality of jobs will be assessed in relation to the main industries within these areas, primarily through qualitative analysis conducted as part of the case studies.
Labour force participation in the Nordic Region
There are several complementary ways of measuring labour market performance. In this section we examine data on employment and unemployment rates, as well as the share of the population outside the labour force.
In the official labour market statistics, the working-age population is categorised into three groups: those in employment, those who are unemployed (i.e. actively seeking a job) and those outside the labour force (see Appendix 2 for more information).
The employment rate is calculated as the proportion of individuals in employment relative to the total population within a specific age group. As previously mentioned, overall employment rates in the Nordic Region are high, with over 80% of the population aged 20-64 in employment, compared to the EU-27 average of 75% in 2022. In many Nordic countries, employment levels surged following the Covid-19 pandemic, reaching their highest levels in at least two decades (Norlén, 2024). However, as illustrated in Map 3, significant regional and municipal disparities persist.
The map highlights persistent differences in employment rates between Nordic countries, with Finland and Greenland exhibiting lower employment levels, although the gap has narrowed in recent years. A low employment rate may indicate a mismatch between labour supply and demand. However, an exceptionally high employment rate can also signal an imbalance, suggesting potential labour shortages.
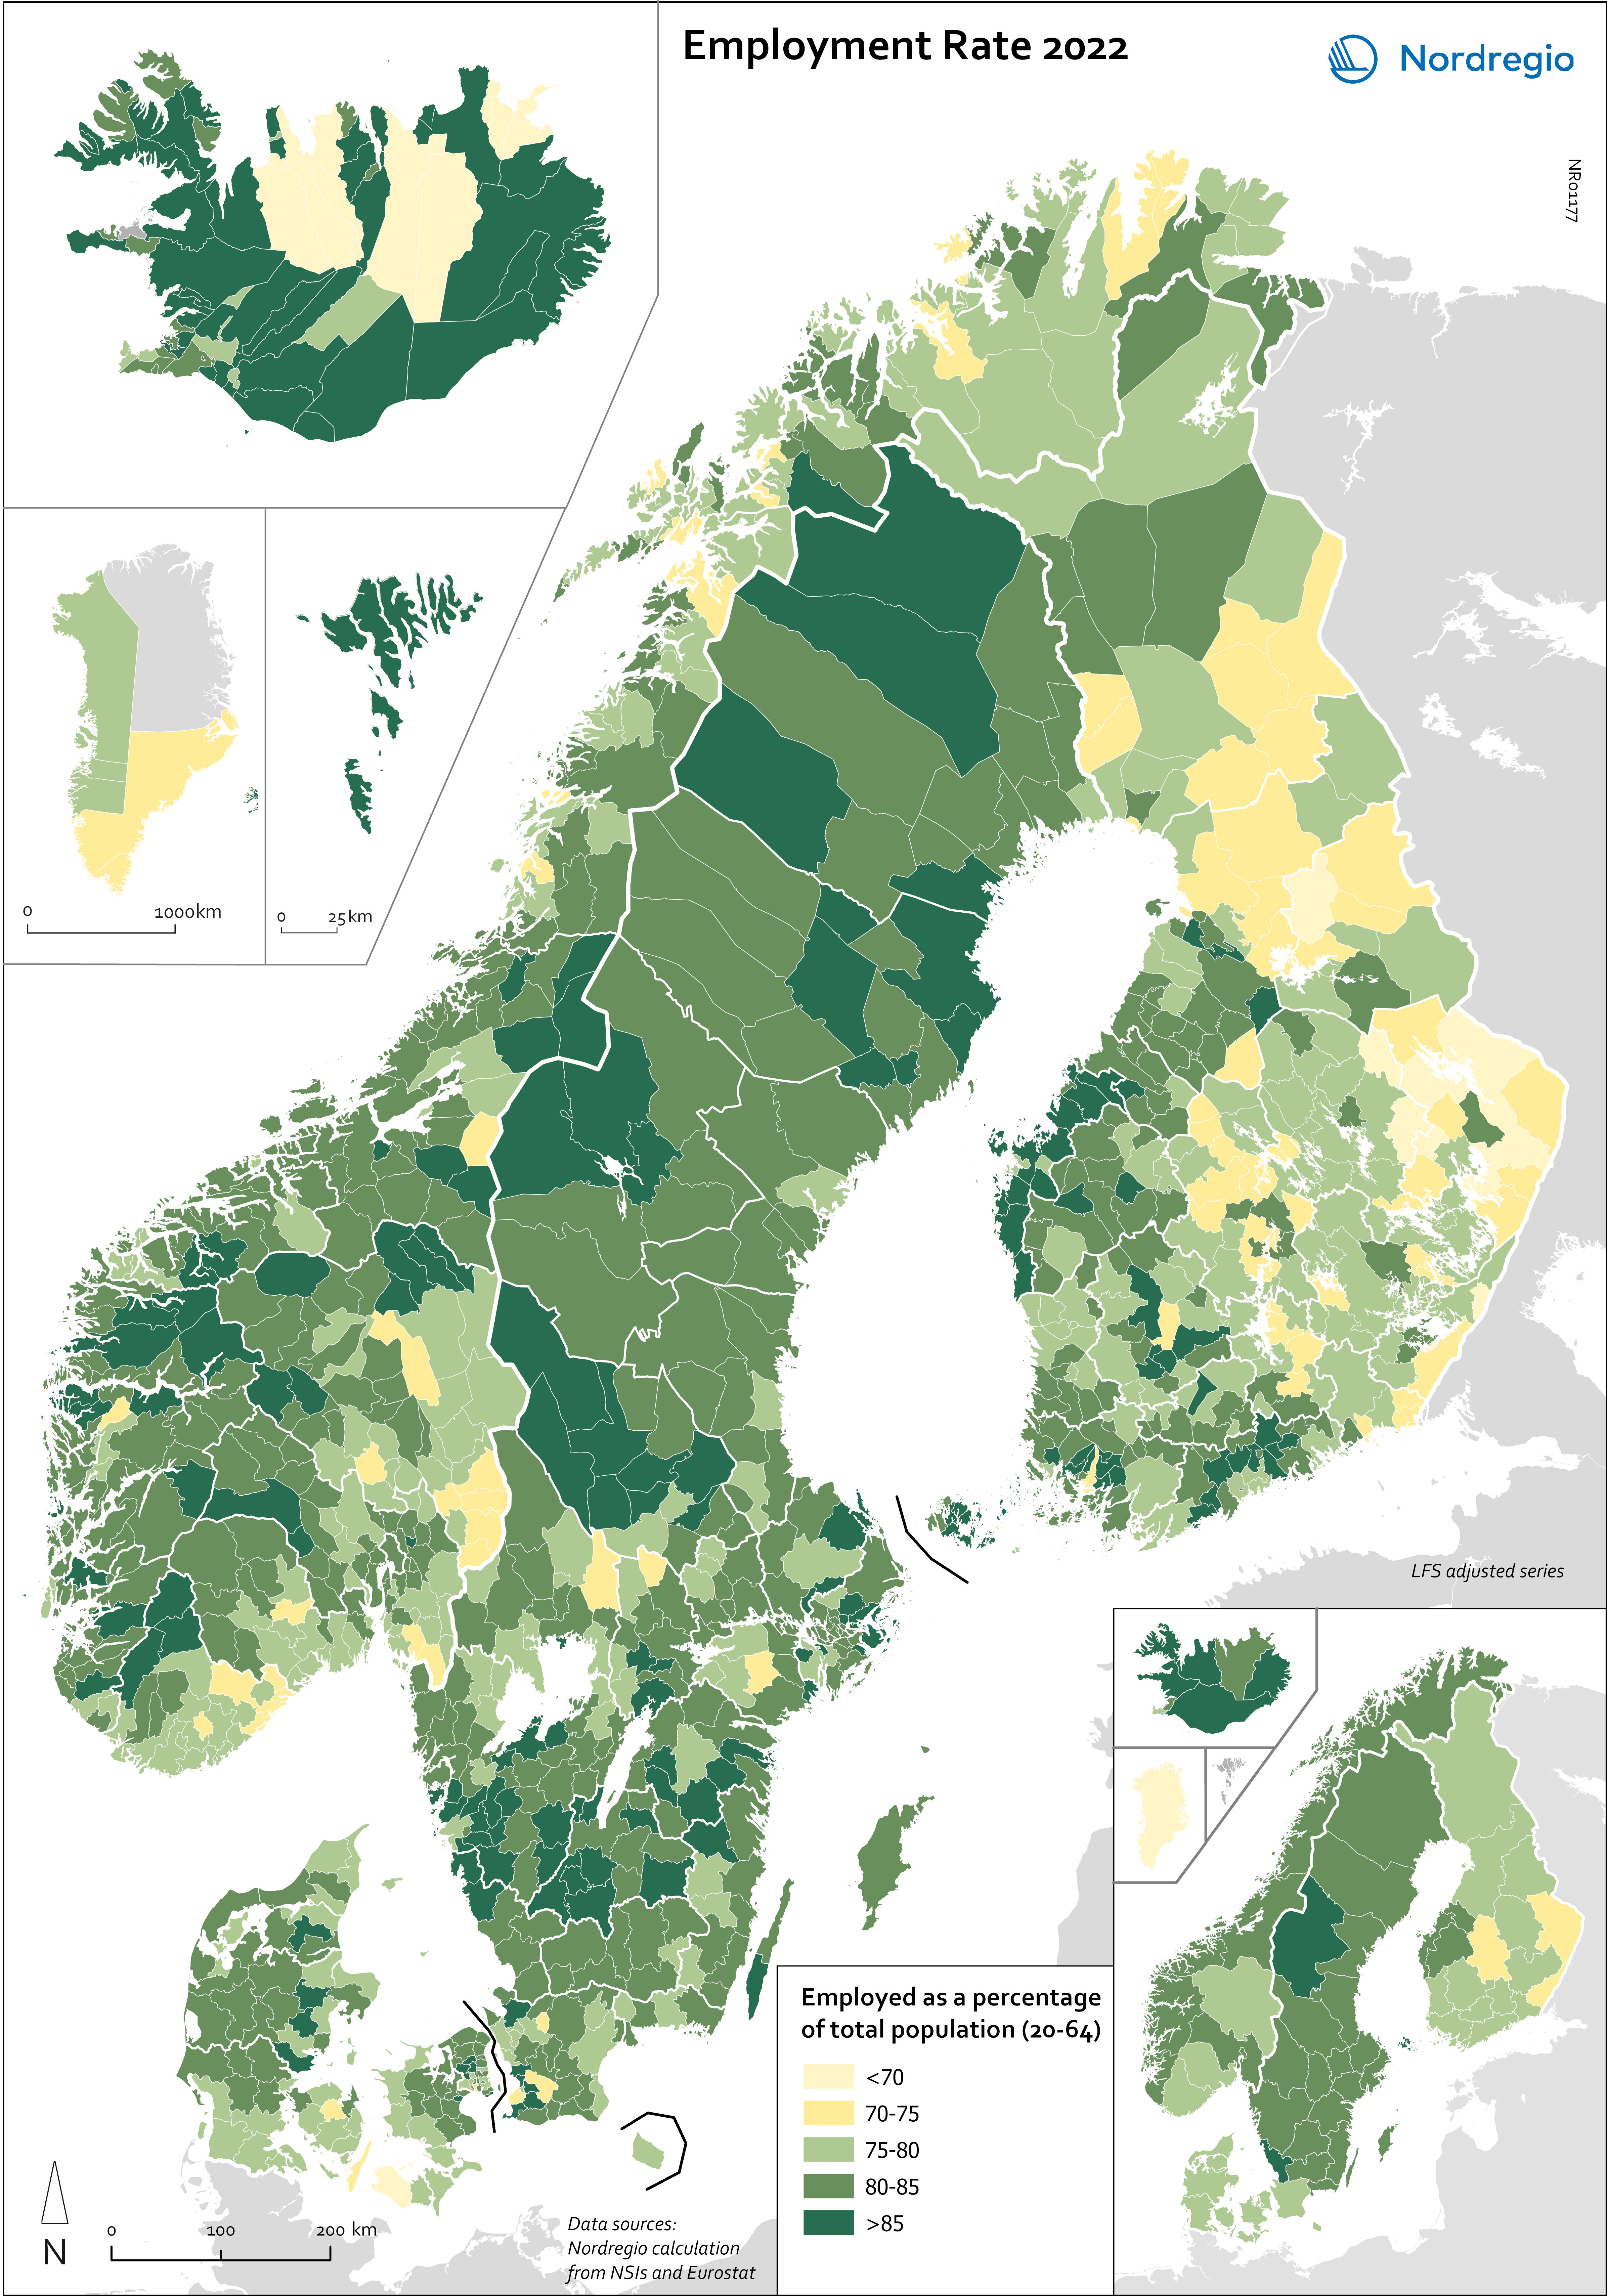
Map 3. Employment rate, 2022.
Many remote labour markets report employment rates above the respective national average, including the case study areas, as shown in Table 3. Given that a portion of the population will always remain outside the labour market due to factors such as illness, education or parental leave, an employment rate exceeding 80% is considered close to "full employment" (ref.).
Norð-urþing | Dalvík-urbyggð | Stord | Hammer-fest | Skellefteå | Gotland | Åland | |
Employment rate (2022) | 91.5 | 86.1 | 82.2 | 81.4 | 85.7 | 82.8 | 85.8 |
National average | 84.0 | 80.4 | 81.6 | 78.1 | |||
Average for remote labour markets (excl. Denmark) | 81.0 | ||||||
Nordic average | 80.7 | ||||||
Table 2. Employment rate in the case study areas. Data source: Own calculations based on LFS and register data.
Another key indicator of labour market performance is the unemployment rate. Unlike the employment rate, the unemployment rate excludes individuals who are outside the labour market
The unemployment rate is calculated as the share of unemployed persons within the total workforce (i.e. those in employment plus those who are unemployed). The data presented in the map have been harmonised with the official source for labour market statistics, the Labour Force Survey (LFS). The workforce includes both employed and unemployed individuals, while those outside the labour market are not included. According to the LFS definition, unemployed individuals are those who have actively sought a job in the last four weeks and are available to start work within the next two weeks.
Due to varying national policies regarding individuals not in employment, unemployment rates often present a different pattern from employment rates. For example, while Sweden and Norway have similar employment rates, Norway has a significantly lower unemployment rate. This reflects the influence of social policies, such as unemployment benefits, sick leave provisions and pathways for exiting the workforce.
At the regional level, some variations can be attributed to structural unemployment within specific groups and mismatches between labour supply and demand. In most of the case study areas, the unemployment rate is below the national average, suggesting that the available labour supply is relatively low.
Norð-urþing | Dalvík-urbyggð | Stord | Hamm-erfest | Skellefteå | Gotland | Åland | |
Unemploy-ment rate 2022 | 3.7 | 3 | 2.1 | 3.0 | 4.6 | 5 | 5.3 |
National average | 3.9 | 3.2 | 7.5 | 6.6 | |||
Average for remote labour markets (excl. Denmark) | 4.8 | ||||||
Nordic average | 6.0 | ||||||
Table 3. Unemployment rate in the case study areas. Data source: Own calculations based on LFS and register data.
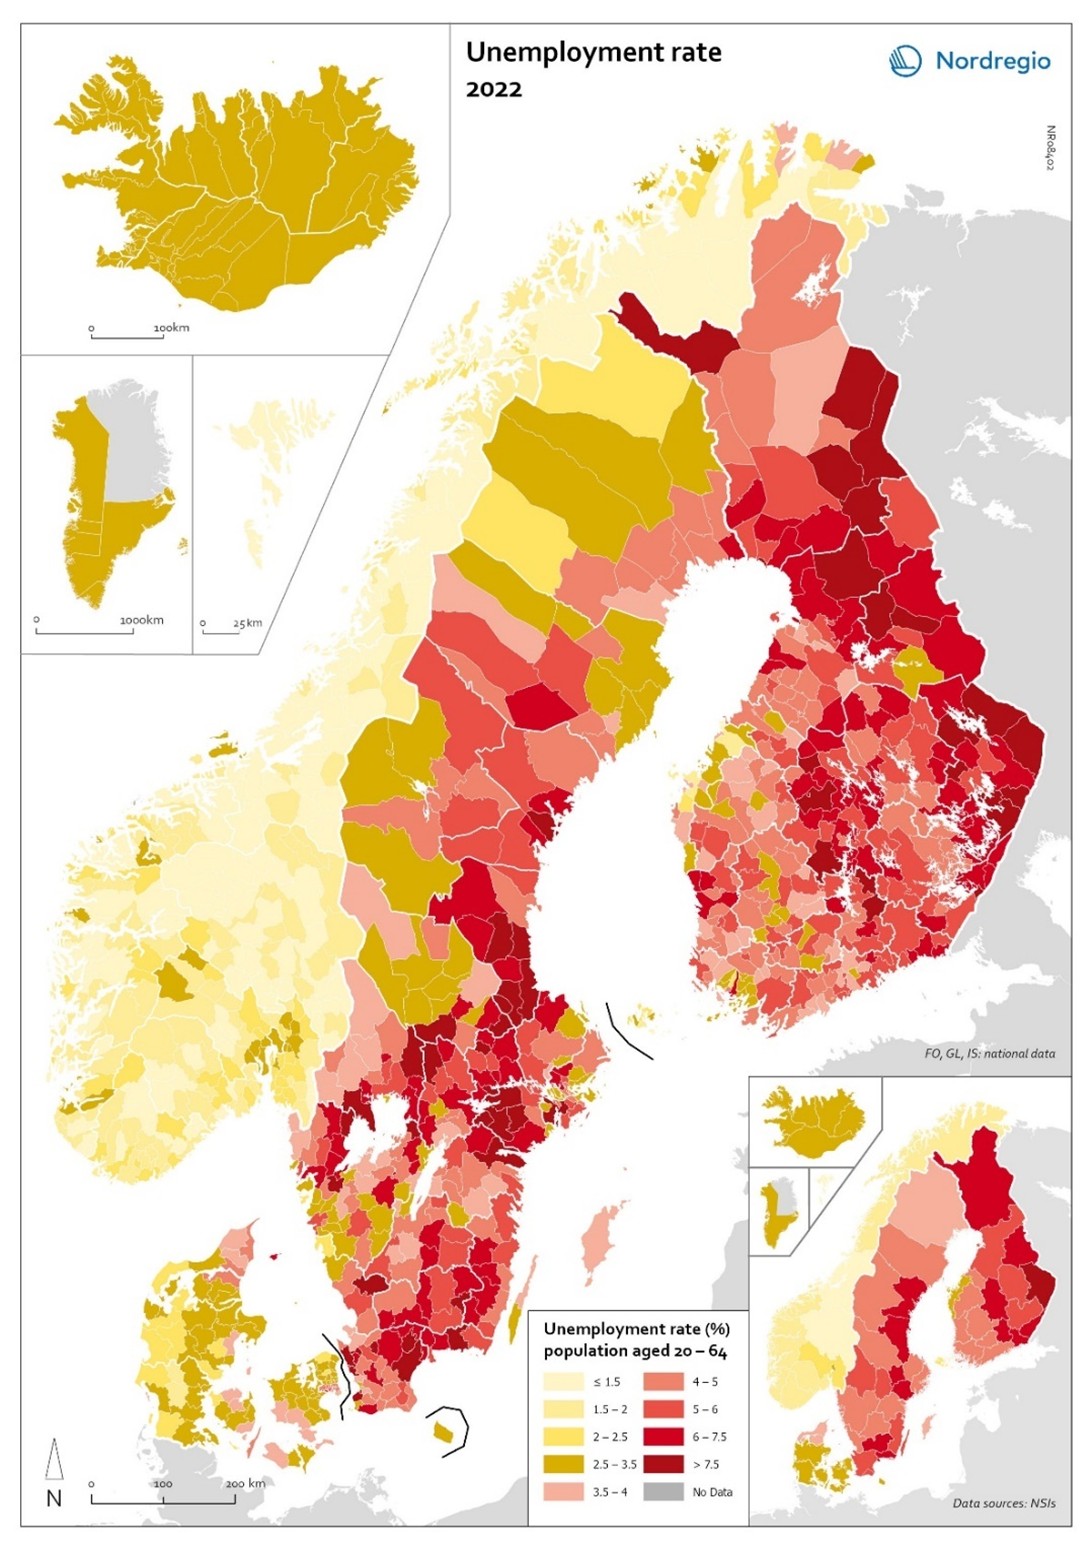
Map 4. Unemployment rate, 2022.
The third category in labour market statistics comprises individuals who are outside the labour market, i.e. those who are neither employed nor seeking work. While the unemployment rate covers those who are actively seeking work and immediately available to start, this group includes individuals who are not currently working or looking for work, such as students, those on long-term sick leave or individuals with other personal circumstances preventing labour market participation.
According to the Labour Force Survey (LFS), labour force participation in the Nordic Region is high. Among the population aged 20-64, 82.4% are employed based on the LFS definition, while 2.6% are unemployed and 15% are outside the labour market. This indicates that unemployed individuals account for only a small proportion of those not participating in the labour market.
Statistics for individuals outside the labour market are collected at regional level. See the table below.
Norðurþing | Dalvík-urbyggð | Stord | Hamm-erfest | Skellefteå | Gotland | Åland | |
Region | Outside Huvustaden | Vestland | Troms og Finnmark | Väster-botten | |||
Outside the labour market, aged 20-64 (2022) | 11.3 | 11.3 | 16.4 | 17.6 | 15.7 | 12.9 | No data |
National average | 12.2 | 16.9 | 12.3 | 16.3 | |||
Nordic average | 15 | ||||||
Table 4. Share of individuals outside the labour market in the case study areas. Data source: own calculations based on LFS and register data. Note: data are at the regional level.
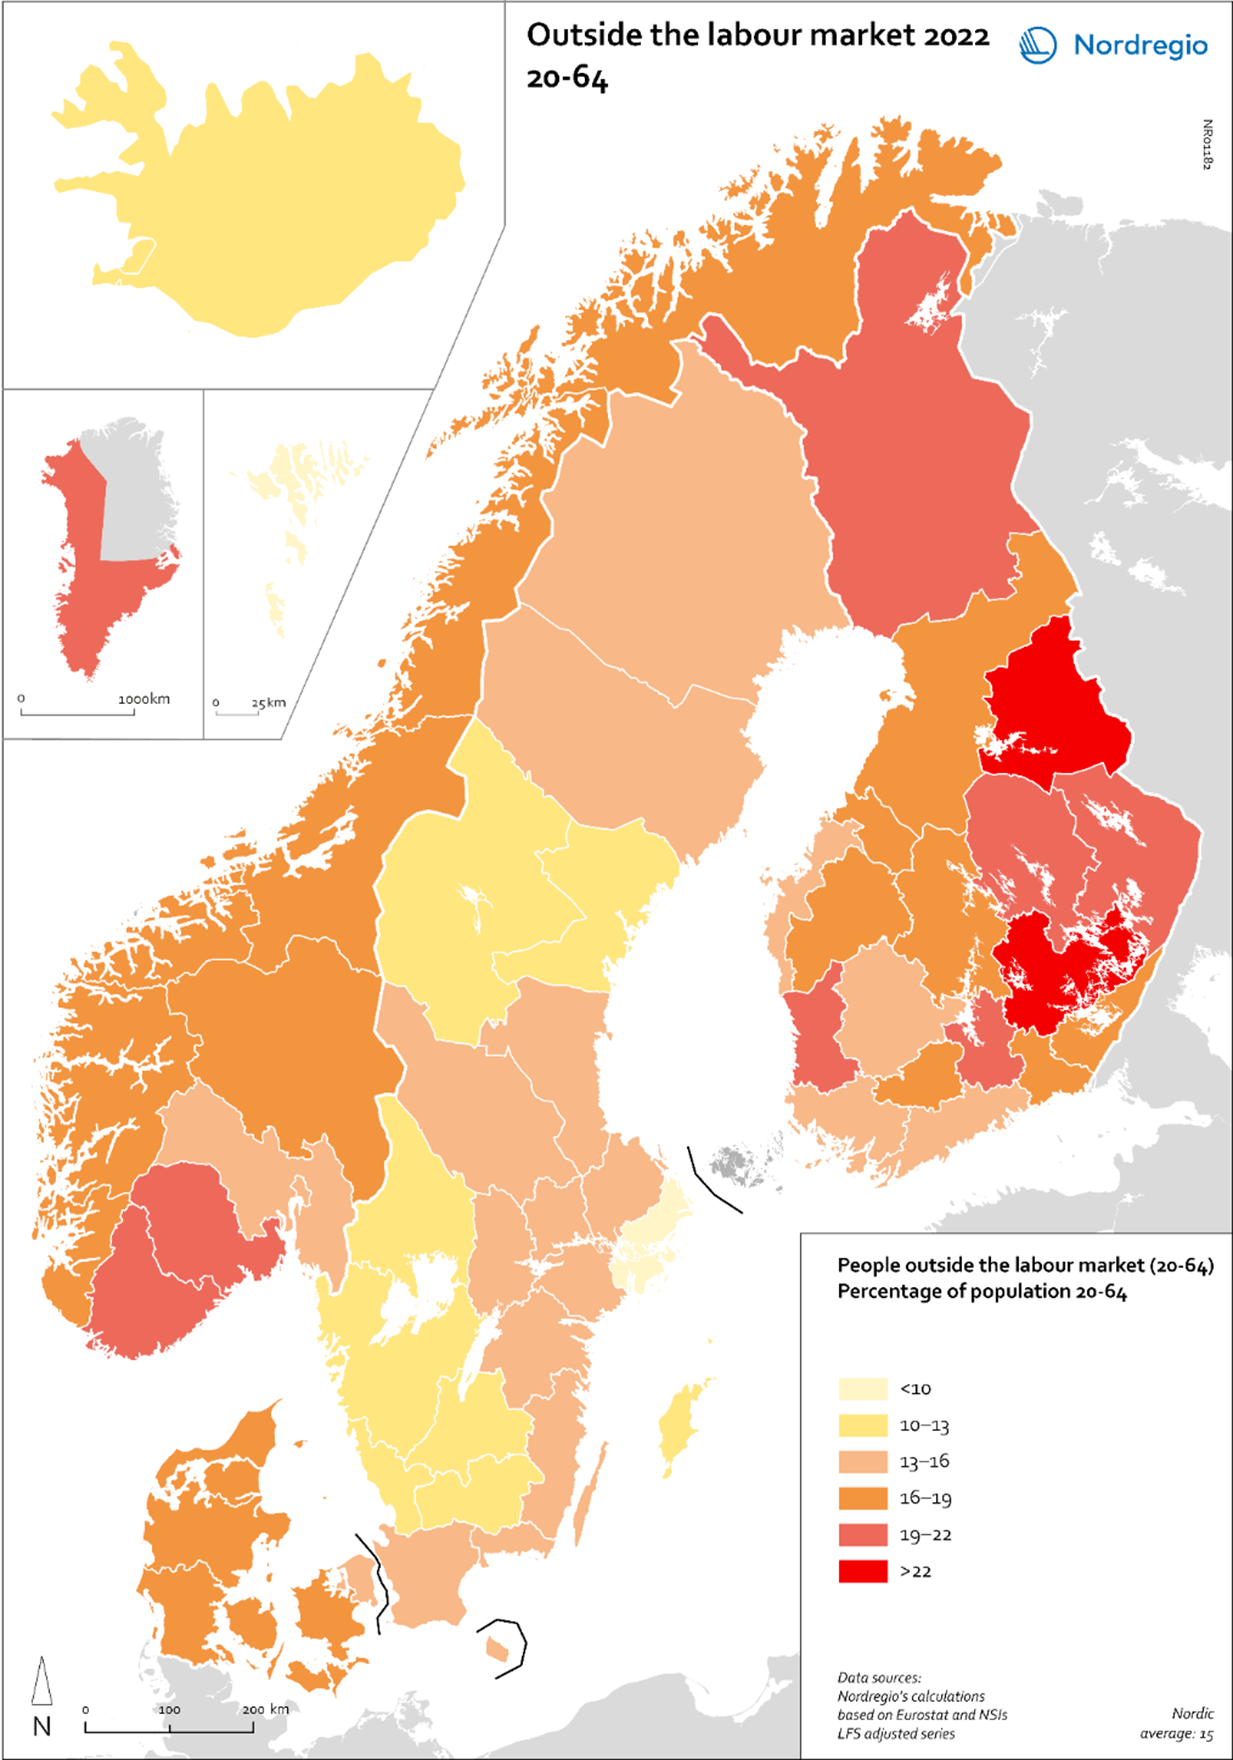
Map 5. Individuals (aged 20-64) outside the labour market as share of the total population (aged 20-64), 2022.